

 6
6
Bitcoin is closing out Q1 2026 on a sour note. The largest crypto is trading around $66.4k after a quarter that saw shedding nearly half its value from the October 2025 peak near $125k. With macro and geopolitical uncertainty still weighing on risk assets and no major structural level reclaimed, $BTC heads into Q2 without a clear bullish catalyst on the horizon.
Bitcoin Price Analysis: The Daily Chart
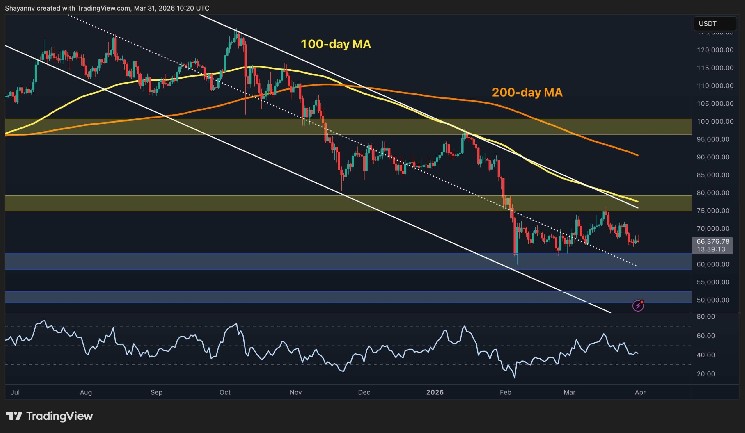
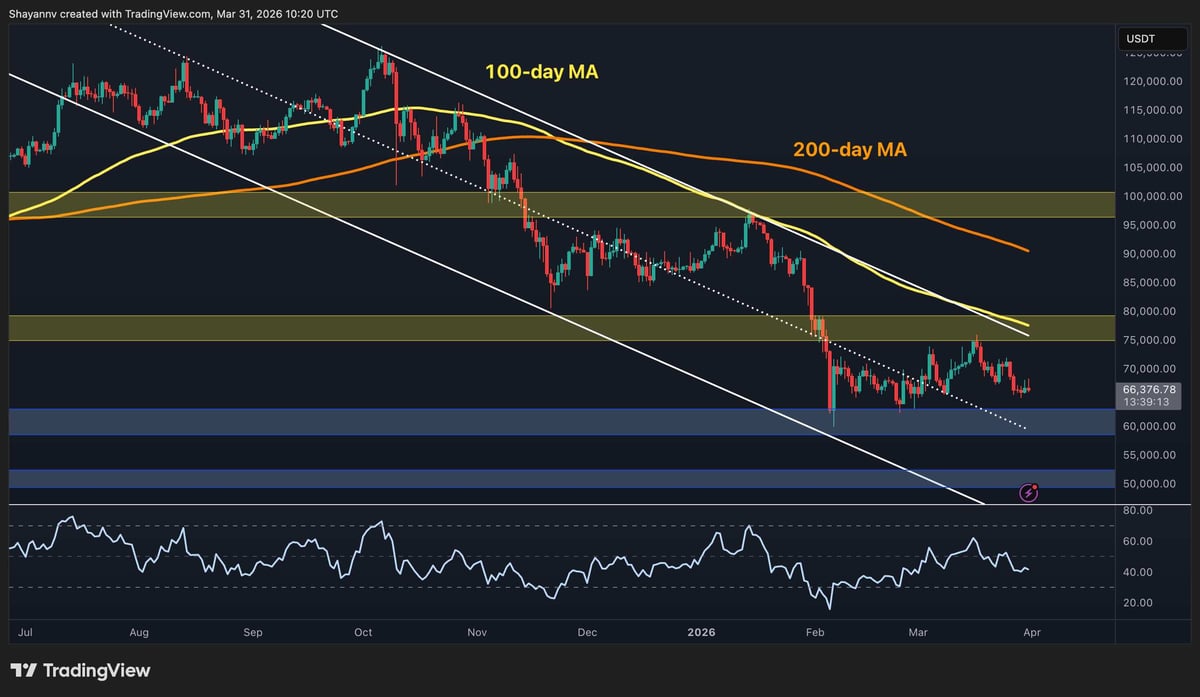
On the daily timeframe, it is evident that the descending channel that has governed Bitcoin’s price action since late 2025 remains intact. Both the 100-day MA (~$77k) and 200-day MA (~$90k) are declining above the current price. The $75k–$80k zone, which served as a key support base earlier, has since flipped to resistance and rejected every recovery attempt in March.
Immediate support sits at the $60k band, which held during the February capitulation drop. A breakdown below that level on a closing basis would expose $BTC to the $50k zone. Meanwhile, the RSI is hovering around 40, which reflects a market that is stabilizing but far from turning around. Therefore, a decisive daily close above $75k remains the minimum requirement for any credible shift in the broader trend.
$BTC/USDT 4-Hour Chart
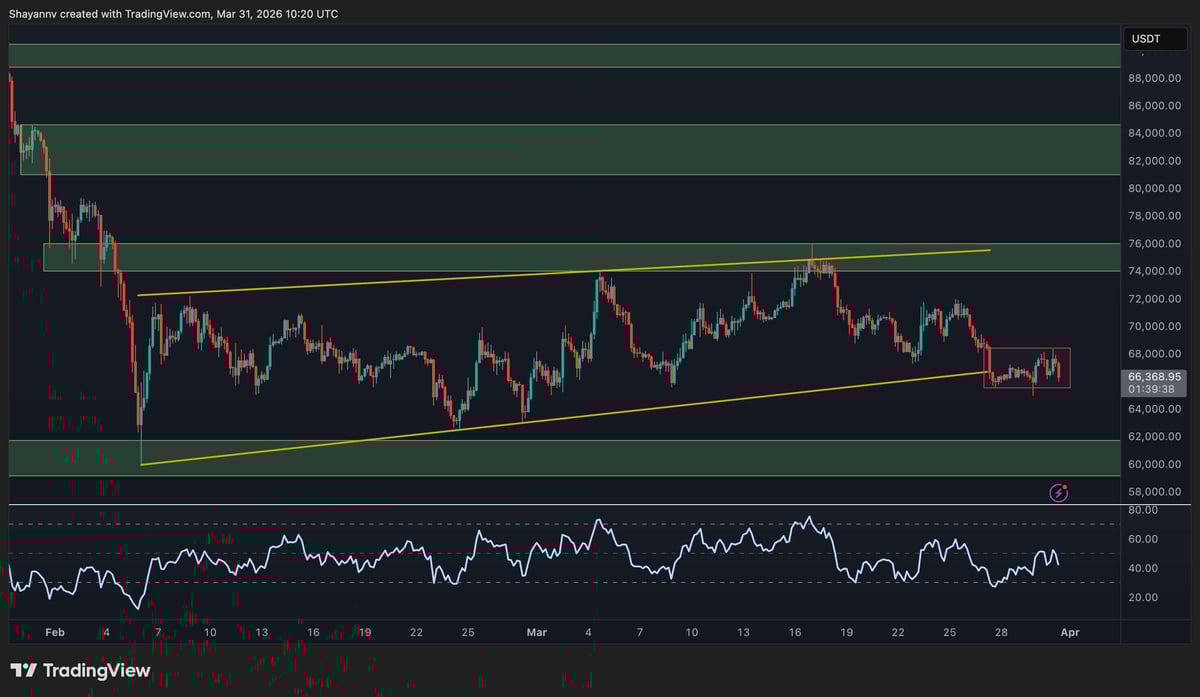
After spending several weeks compressing inside a rising flag pattern between roughly $60k and $75k, $BTC has broken the pattern to the downside and is now consolidating near $66. The current range is flagged clearly by the red box on the chart. The triangle’s lower boundary, which had provided support on multiple retests, gave way in the final days of March, and the price has since struggled to reclaim it.
The RSI on the 4-hour is recovering from oversold territory and ticking upward toward the mid-40s. This leaves room for a short-term bounce. However, the key test will be whether $BTC can reclaim the broken pattern support and build above it. Failure to do so keeps the path open toward a retest of the key $60k–$62k support zone.
On-Chain Analysis
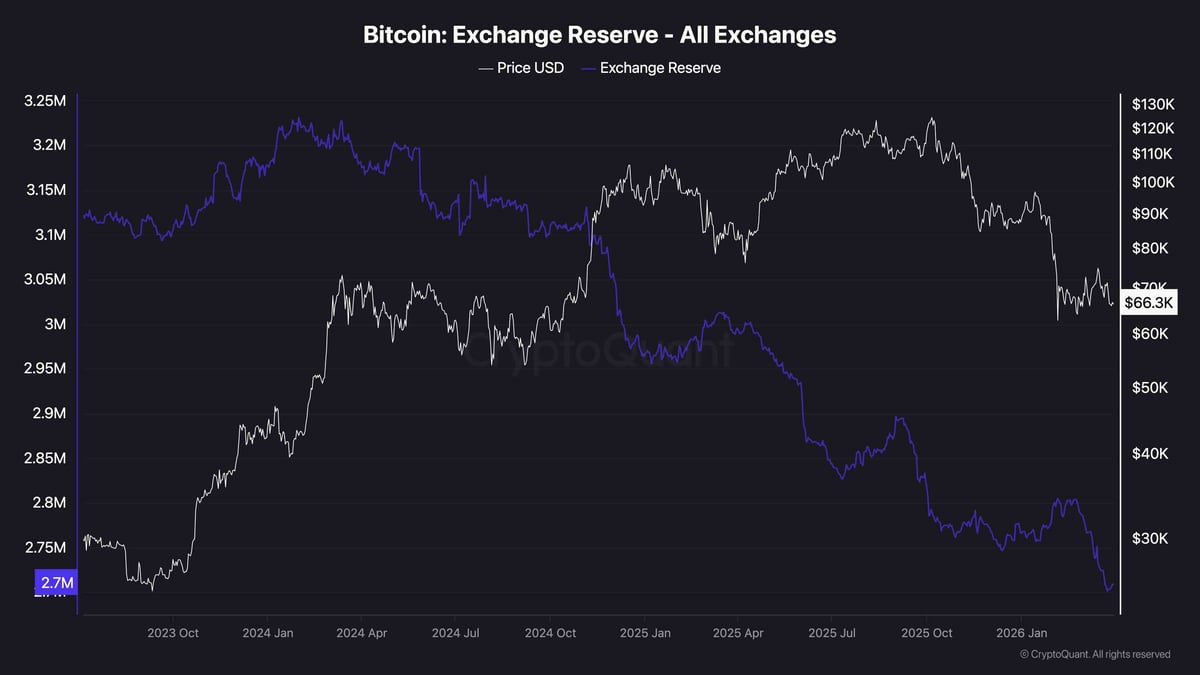
One of the more compelling data points heading into Q2 is Bitcoin’s exchange reserve, which has dropped to approximately 2.7M $BTC. This is the lowest level in the entire dataset going back to late 2022. The decline has been especially relentless over the past couple of weeks, as the market is trying to form a bottom above $60k
In isolation, declining exchange reserves are typically interpreted as a bullish structural signal, because fewer coins on exchanges means reduced immediate sell-side availability. However, the context matters.
Reserves have been falling alongside price, not ahead of a recovery, which suggests the outflows reflect long-term holder accumulation rather than incoming demand. So, until fresh buyers step in and translate that supply tightness into actual price appreciation, the on-chain picture remains constructive in theory but unconfirmed in practice.