


 4
4
-
Bitcoin has fallen below $70K as whales and retailers alike accumulate on every price dip.
-
A divergence in which LTH buying overwhelms micro-wallet selling could catapult $BTC to new highs.
-
Near-term action could be bearish, in line with historical trends and prevailing macroeconomic/geopolitical events.
Bitcoin ($BTC) has recently breached the key psychological support level of $70,000, trading at $68,739.30 (-3.49% in 24h) at press time.
This happened after the Pentagon reported plans to execute a “final blow” on Iran, in addition to the upcoming expiration of $16.4 billion in Bitcoin and Ethereum options on Friday.
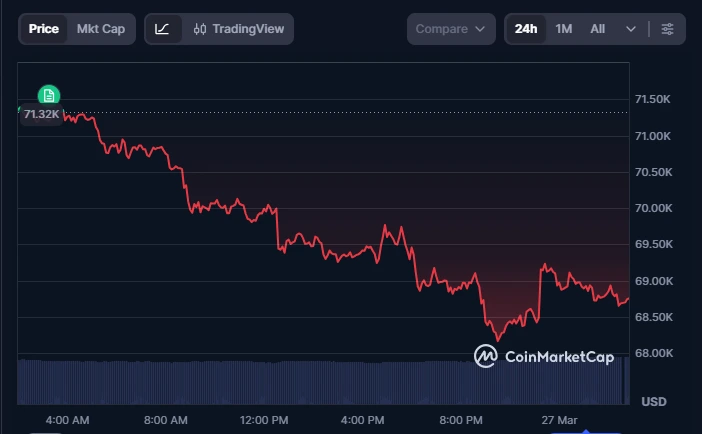
Source: CoinMarketCap
Bitcoin breakout signal
Nonetheless, on-chain data show persistence in whale accumulation, with wallets holding between 10 and 10,000 $BTC increasing their positions by 0.45% (61,568 $BTC) over the past month.
Consistent accumulation is generally a sign that the market is ripe for bullish momentum.
Still, the digital asset’s price has continued to drift, failing to break above $75,000 over the past month.
Beyond macroeconomic and geopolitically driven uncertainty, retail fear of missing out (FOMO) is contributing to the price pullback.
According to market intelligence platform Santiment, retailers’ accumulation of Bitcoin is moving in tandem with that of sharks and whales. In the past month, wallets with under 0.01 $BTC have added onto their stash by 0.42%.
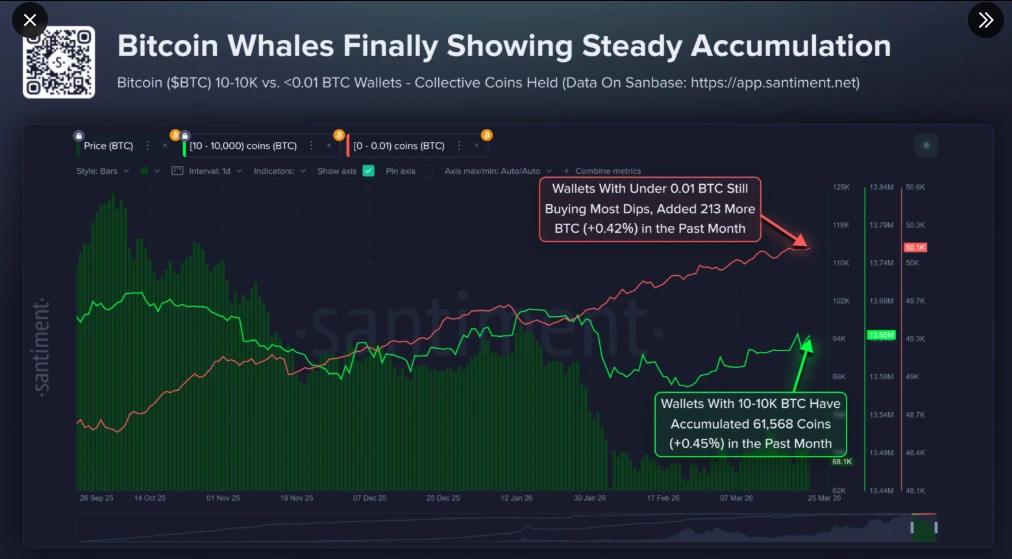
Source: Santiment
Bitcoin has historically shifted from bearish to bullish momentum when the actions of these two investors diverged – long-term holders expressed immense buying pressure as short-term holders exited the market.
Until we attain such a trend, the digital asset is likely to experience prolonged sideways movement. Fed actions, inflation reports, and developments in the ongoing US-Iran conflict will continue to drive price volatility.
Near-term $BTC movement
In the near term, analysts point to an impending capitulation, driven by historical trends and economic pressures.
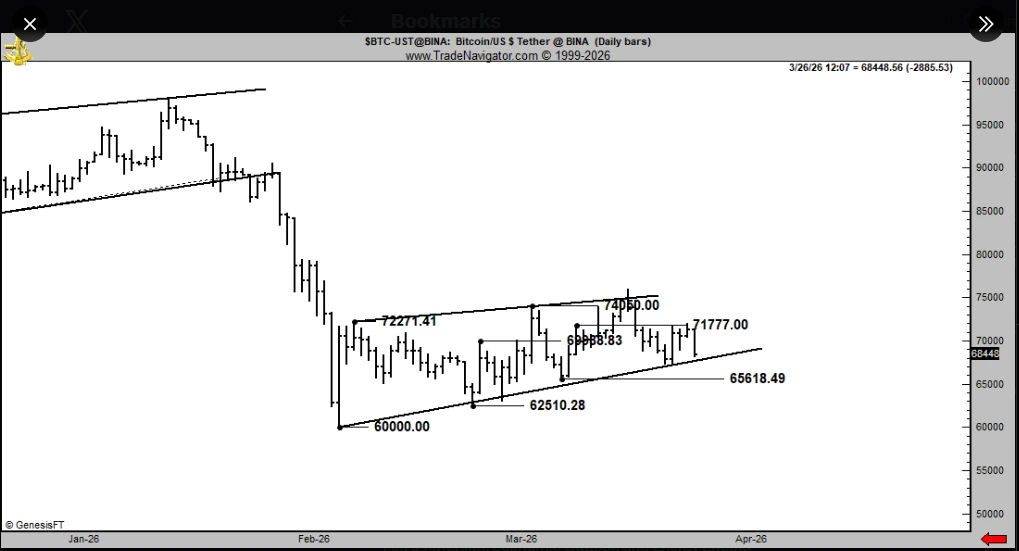
Source: X
Another analyst points out that a dip below $48,387 (the long-term holder realized price) and the -0.2 standard deviation band ($36,657) have historically sparked bull runs. And each time the gains exceeded 300% within 18 months.
For over a decade, Bitcoin $BTC has kicked off new bull runs after dropping below:
— Ali Charts (@alicharts) March 26, 2026
• Long-term holder realized price: $48,387
• −0.2 standard deviation band: $36,657
I’ll be watching these zones for dip-buying opportunities ahead of the next bull cycle. pic.twitter.com/T2SismH5Pl
The gold-Bitcoin narrative supports this theory, in which Bitcoin experienced a V-shaped recovery following a surge and cool in gold prices.
Bleak forecasts hint at a possible recession due to unemployment, economic shifts, and the West-Middle East friction.
Unemployment rate rising
— Benjamin Cowen (@intocryptoverse) March 26, 2026
Geopolitical conflicts rising
Price of oil rising
Inflation rising
Airport travel collapsing
Bitcoin dropping
Stocks dropping
All business cycles must come to an end, and it usually ends with a recession.

