

 3
3
Bitcoin ($BTC) price trades near $70,700, flat over the past 24 hours but still holding roughly 10% gains on the month. The 8-hour chart shows an ascending channel that has been building since early February, with multiple breakout attempts that have failed. Possible easing in geopolitical tensions has helped stabilize the price, but underneath, two opposing forces are pulling in different directions.
On one side, retail holders and whales are both moving Bitcoin to exchanges, a pattern that typically precedes selling. On the other hand, the derivatives market has flipped bullish. When spot flows and derivatives positioning diverge this sharply, the resolution tends to be violent. The question is which side gives first. If the spot sellers are right, the 10% monthly rally may have walked straight into a liquidity trap built by leveraged optimism.
Retail and Whales Are Moving to Exchanges in Tandem
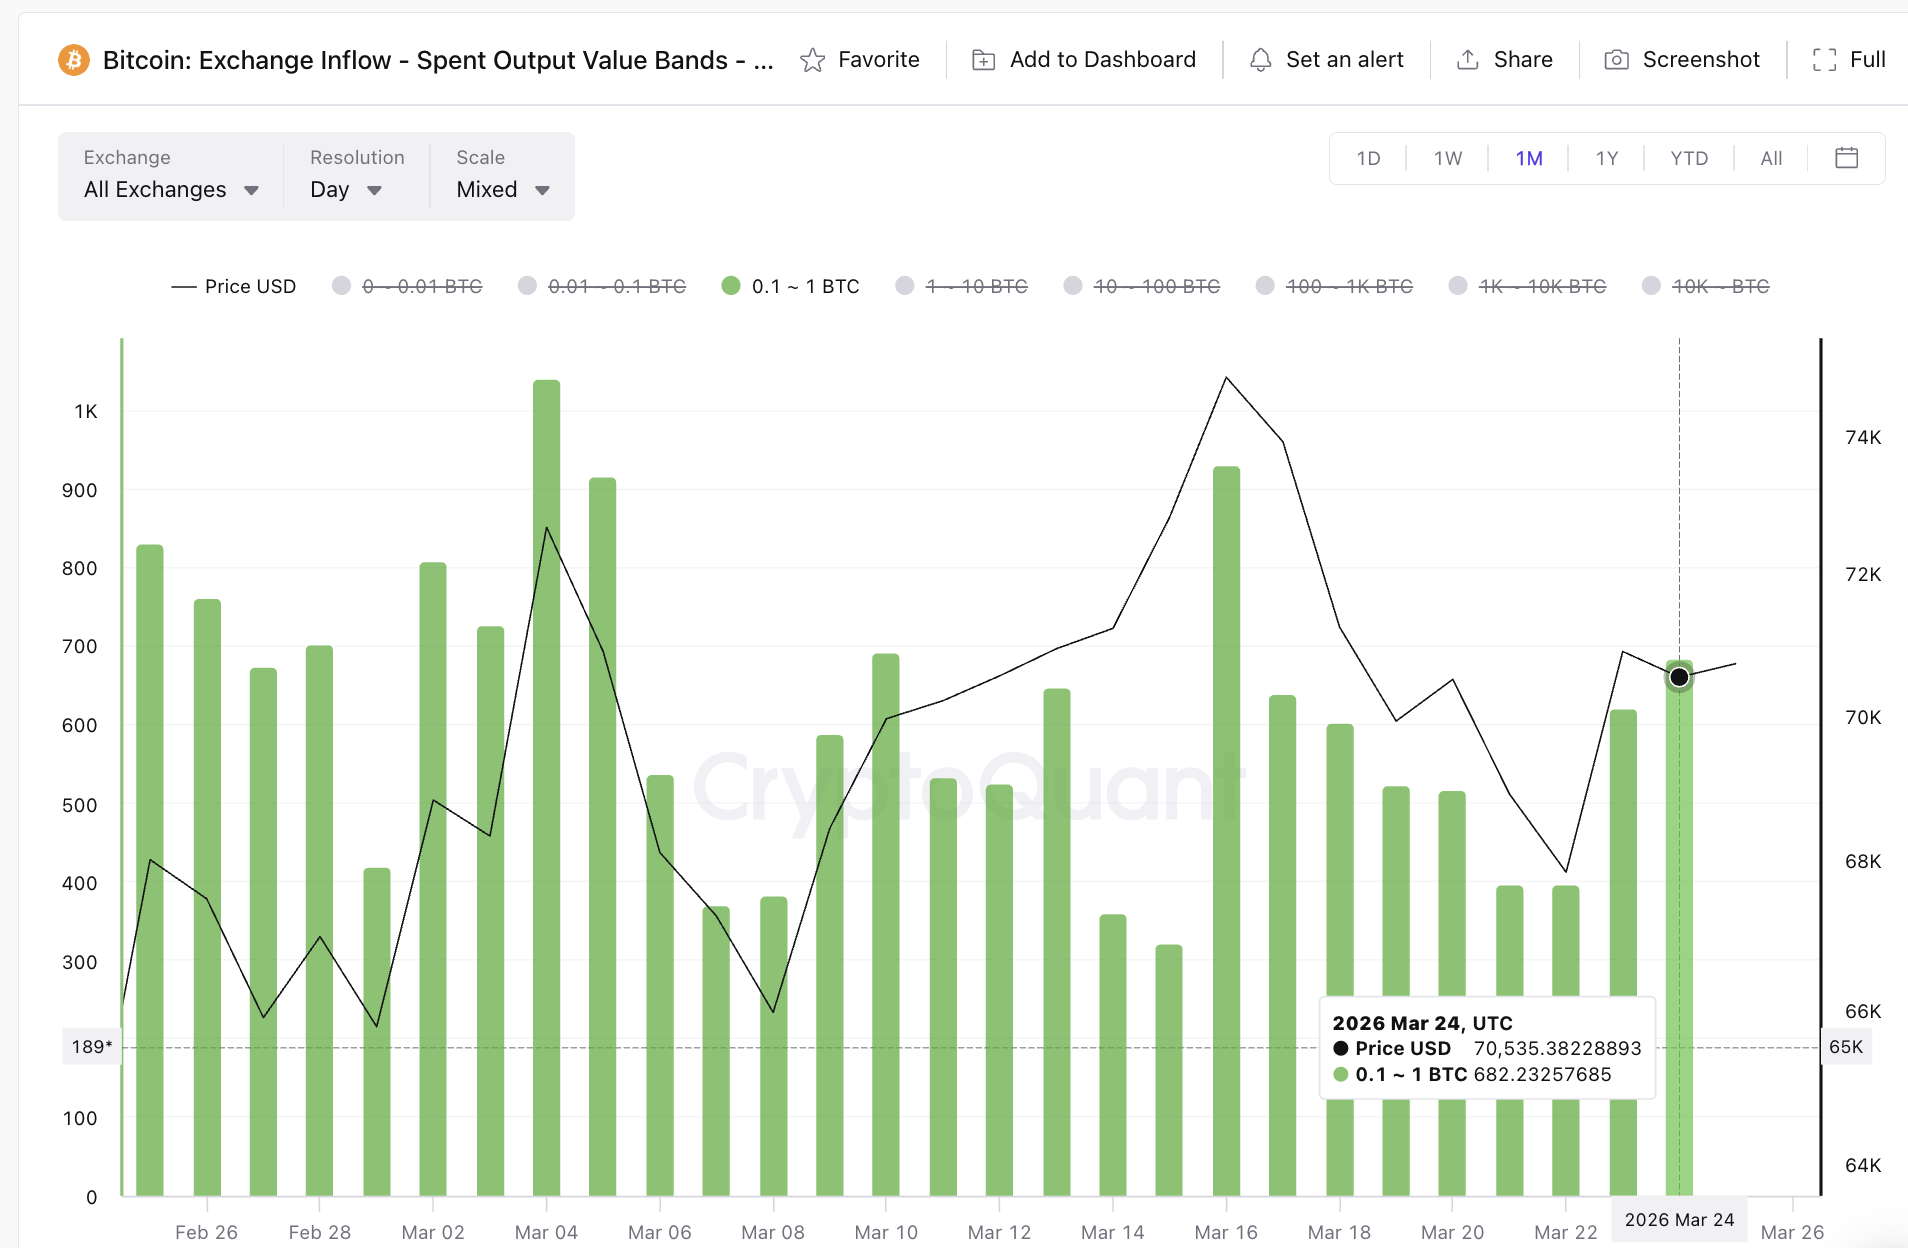
The on-chain data reveals a coordinated shift toward exchanges across multiple holder cohorts. According to CryptoQuant, the 0.1 to 1 $BTC cohort, a proxy for retail participants, nearly doubled its exchange inflows from approximately 394 $BTC to 682 $BTC over three days. This is not an isolated retail event.
Want more token insights like this? Sign up for Editor Harsh Notariya’s Daily Crypto Newsletter here.
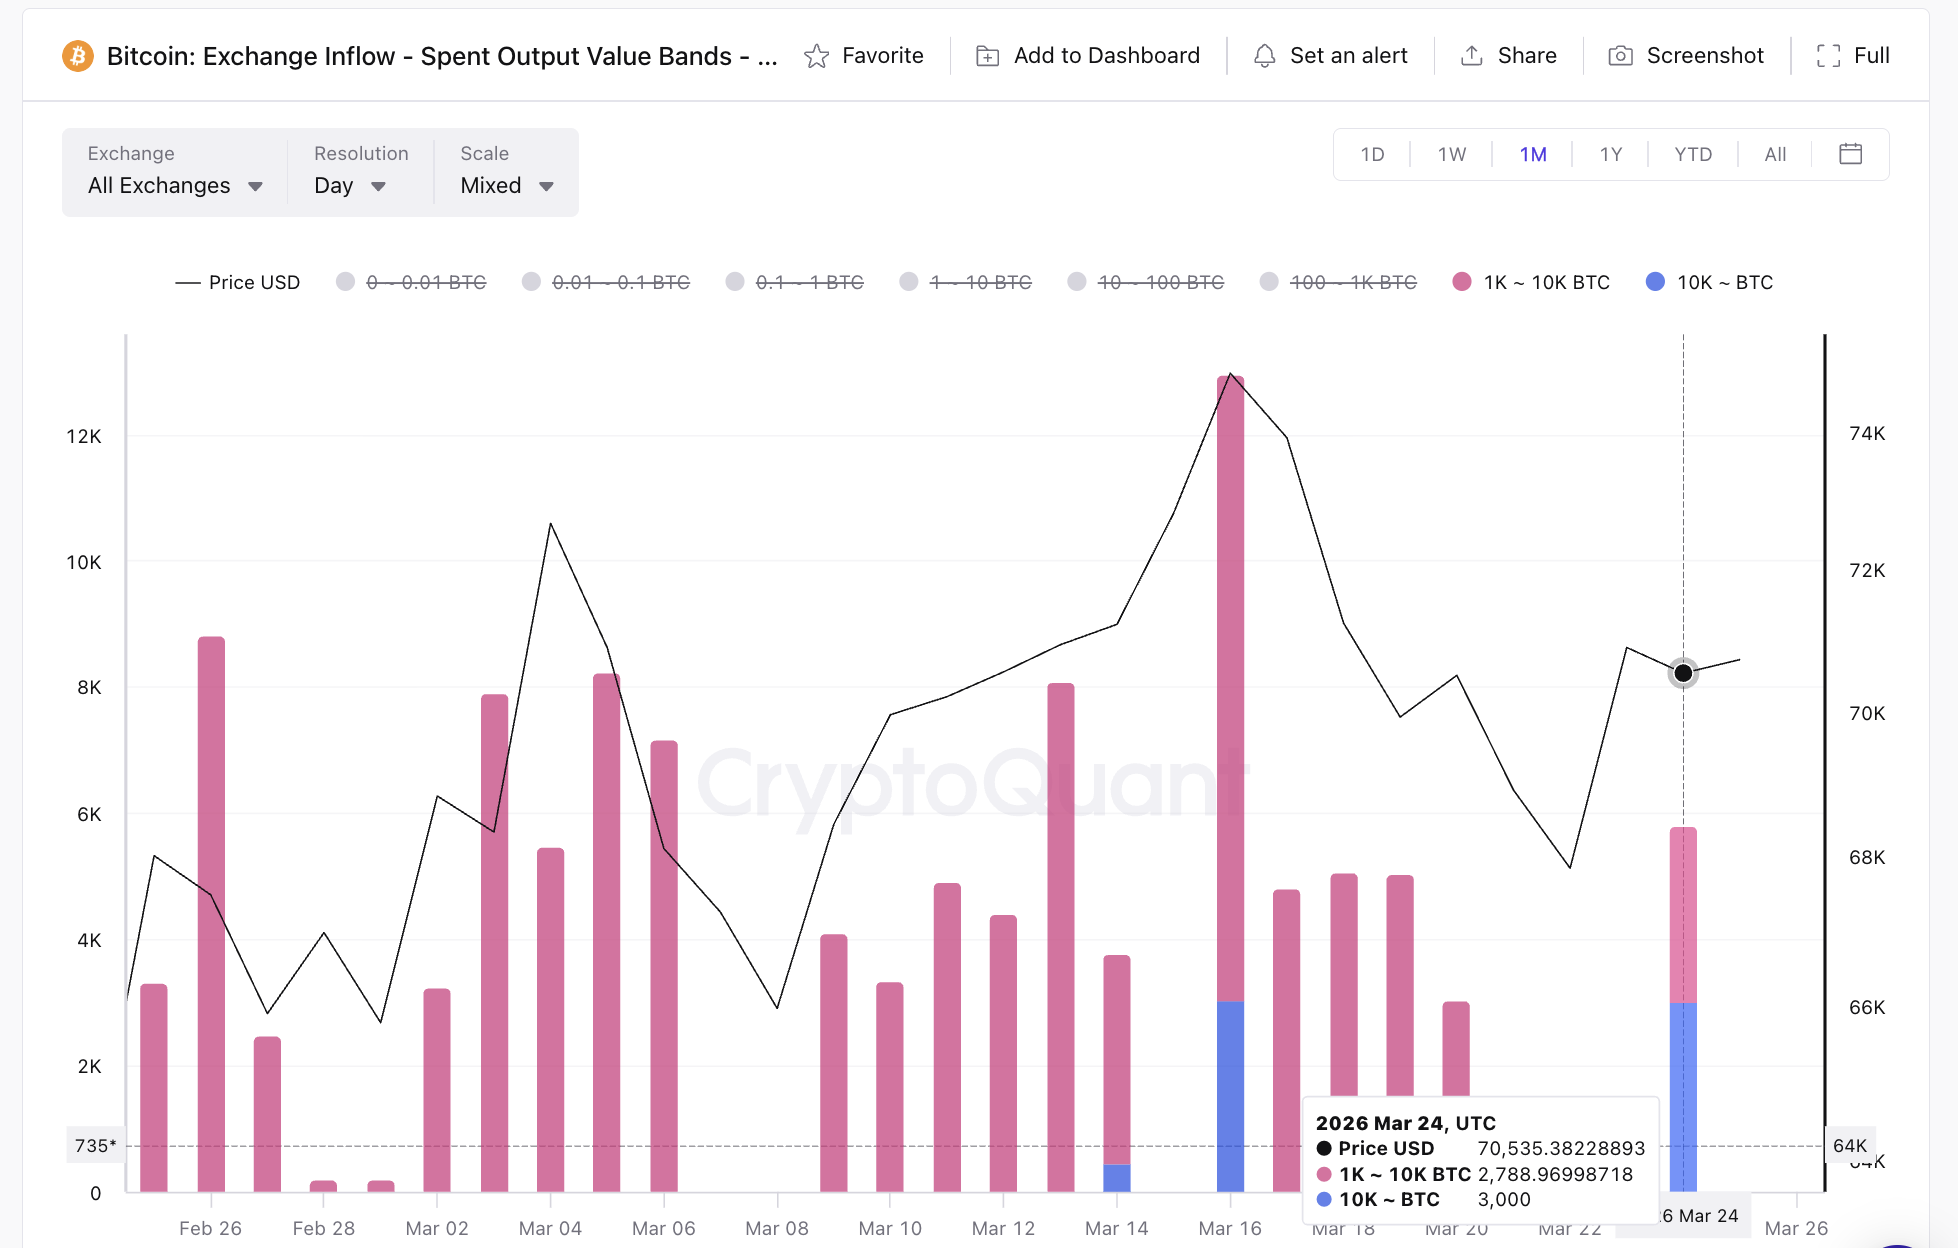
The largest Bitcoin whales followed. The 1,000 to 10,000 $BTC cohort moved 444 $BTC to exchanges on March 23. By March 24, that figure had surged to 2,788 $BTC, a roughly 528% increase in a single day. The 10,000+ $BTC holders joined the same day, with 3,000 $BTC moved to exchanges.
When both retail and whale cohorts increase exchange inflows simultaneously, after a relatively silent phase between March 20 and March 22, it suggests that selling pressure is building across the entire holder spectrum, not just one segment.
The pattern is notable because it is synchronized. Retail and whales rarely move in the same direction at the same time. When they do, the combined flow tends to create meaningful sell-side pressure, particularly if the price fails to hold a key technical level.
Derivatives Stay Bullish, and That Is the Risk
While spot holders are moving to exchanges, the derivatives market is leaning the opposite way. The total funding rate for Bitcoin flipped from -0.0028 on March 23 to +0.006, a sharp swing into positive territory. Positive funding means long positions are paying short positions to maintain their bets, indicating the market is net long.
Meanwhile, open interest has held relatively flat, dipping marginally from $22.67 billion to $22.55 billion. However, the rise in funding rate even on a flat day shows the bullishness in play.
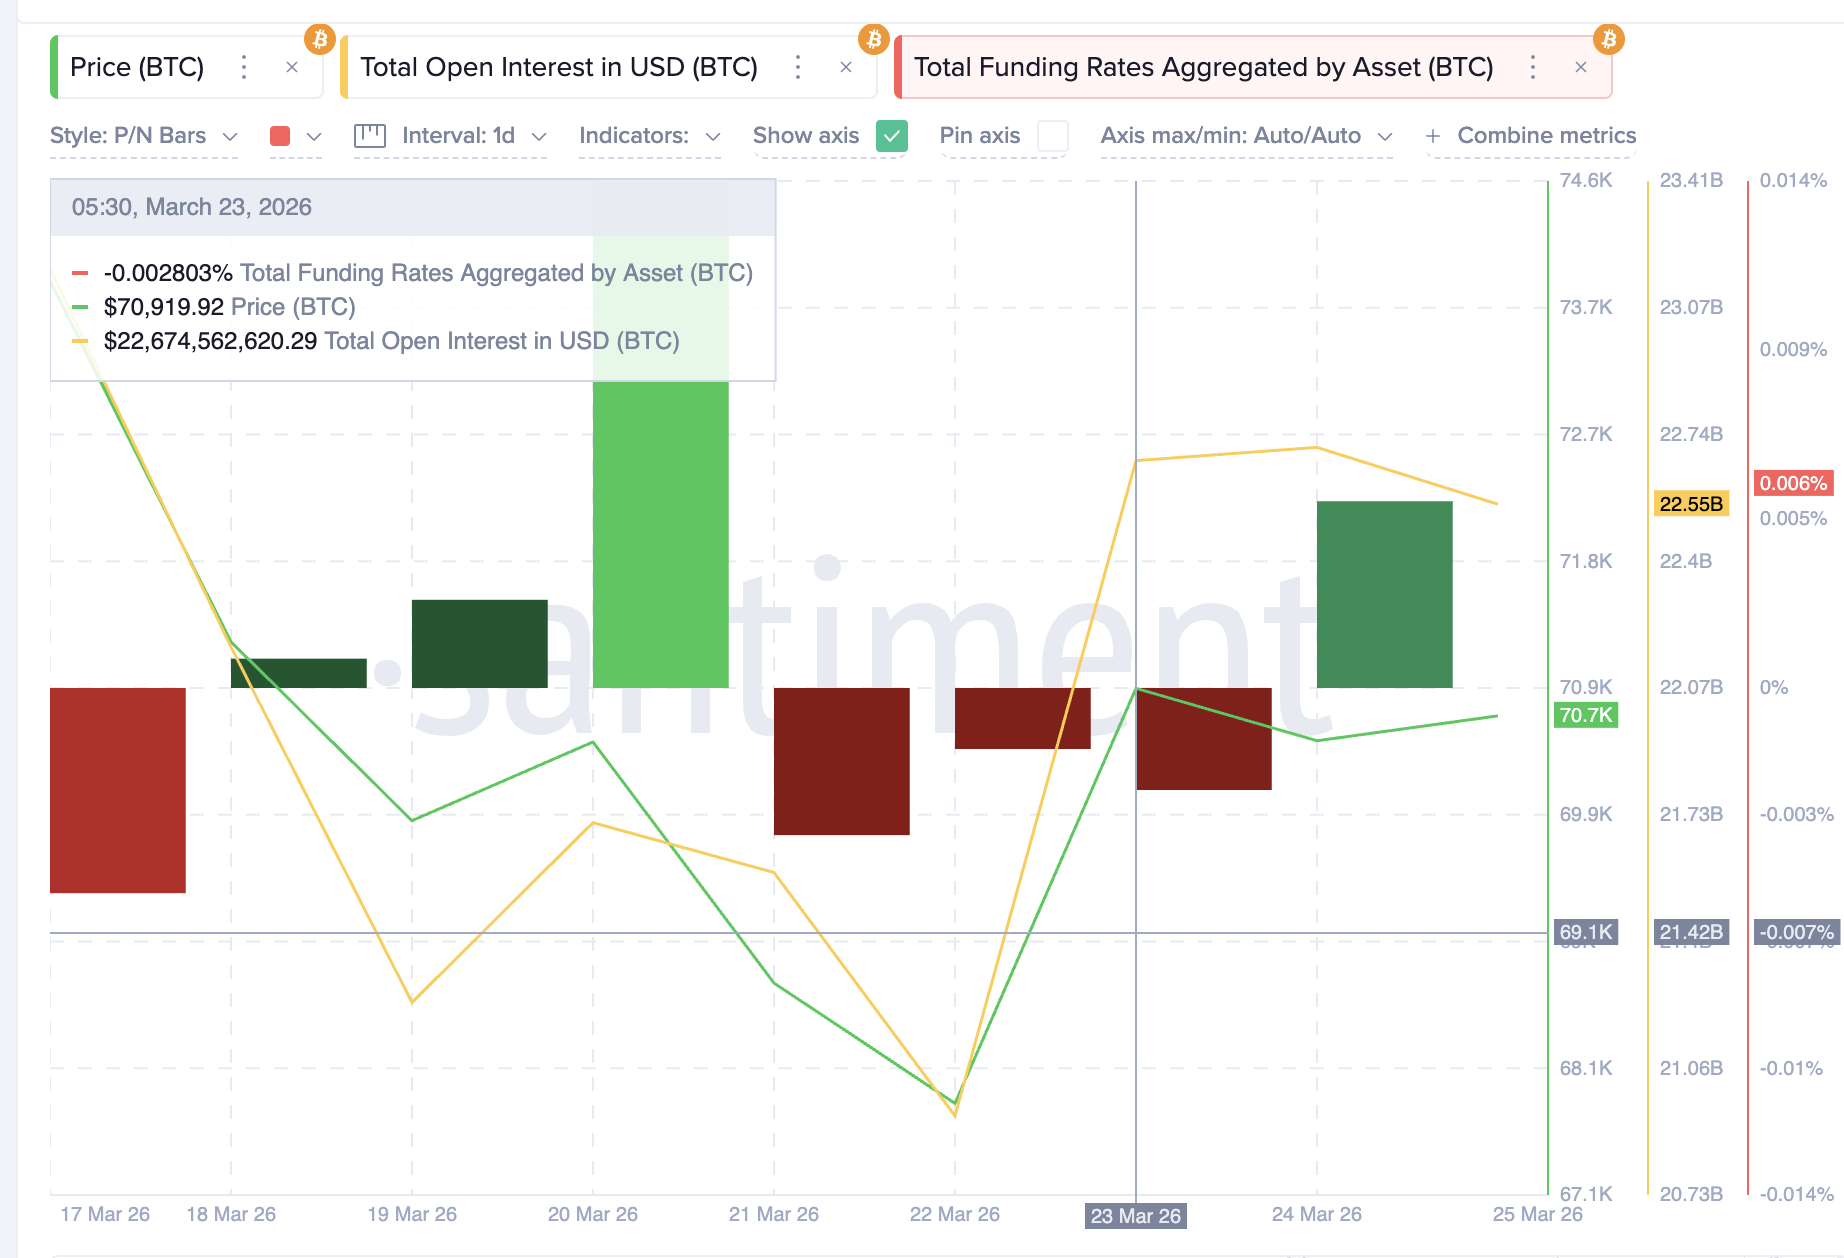 $BTC Open Interest and Funding Rate">
The divergence between spot and derivatives is the core risk. Spot holders are positioning to sell. Derivatives traders are positioning for a bounce. If the spot selling overwhelms the derivatives optimism and price drops below a key support, the leveraged longs face forced liquidation.
That cascade of long closures would accelerate the move lower, turning derivative bullishness into the very fuel that powers the correction. This is the long liquidation cascade risk that the current setup is quietly building. The only saving grace here is that the open interest (aka leverage) hasn’t risen insanely, yet.
These Bitcoin Price Levels Could Resolve the Tug of War
The 8-hour chart frames the decision zone, with $BTC continuing to move inside a rising channel since late February. Bitcoin price is currently testing the 100-period Exponential Moving Average (EMA), an indicator that gives more weight to recent price data to identify trend direction, at $70,700. The last time $BTC cleanly reclaimed this EMA in mid-March, it rallied approximately 8%.
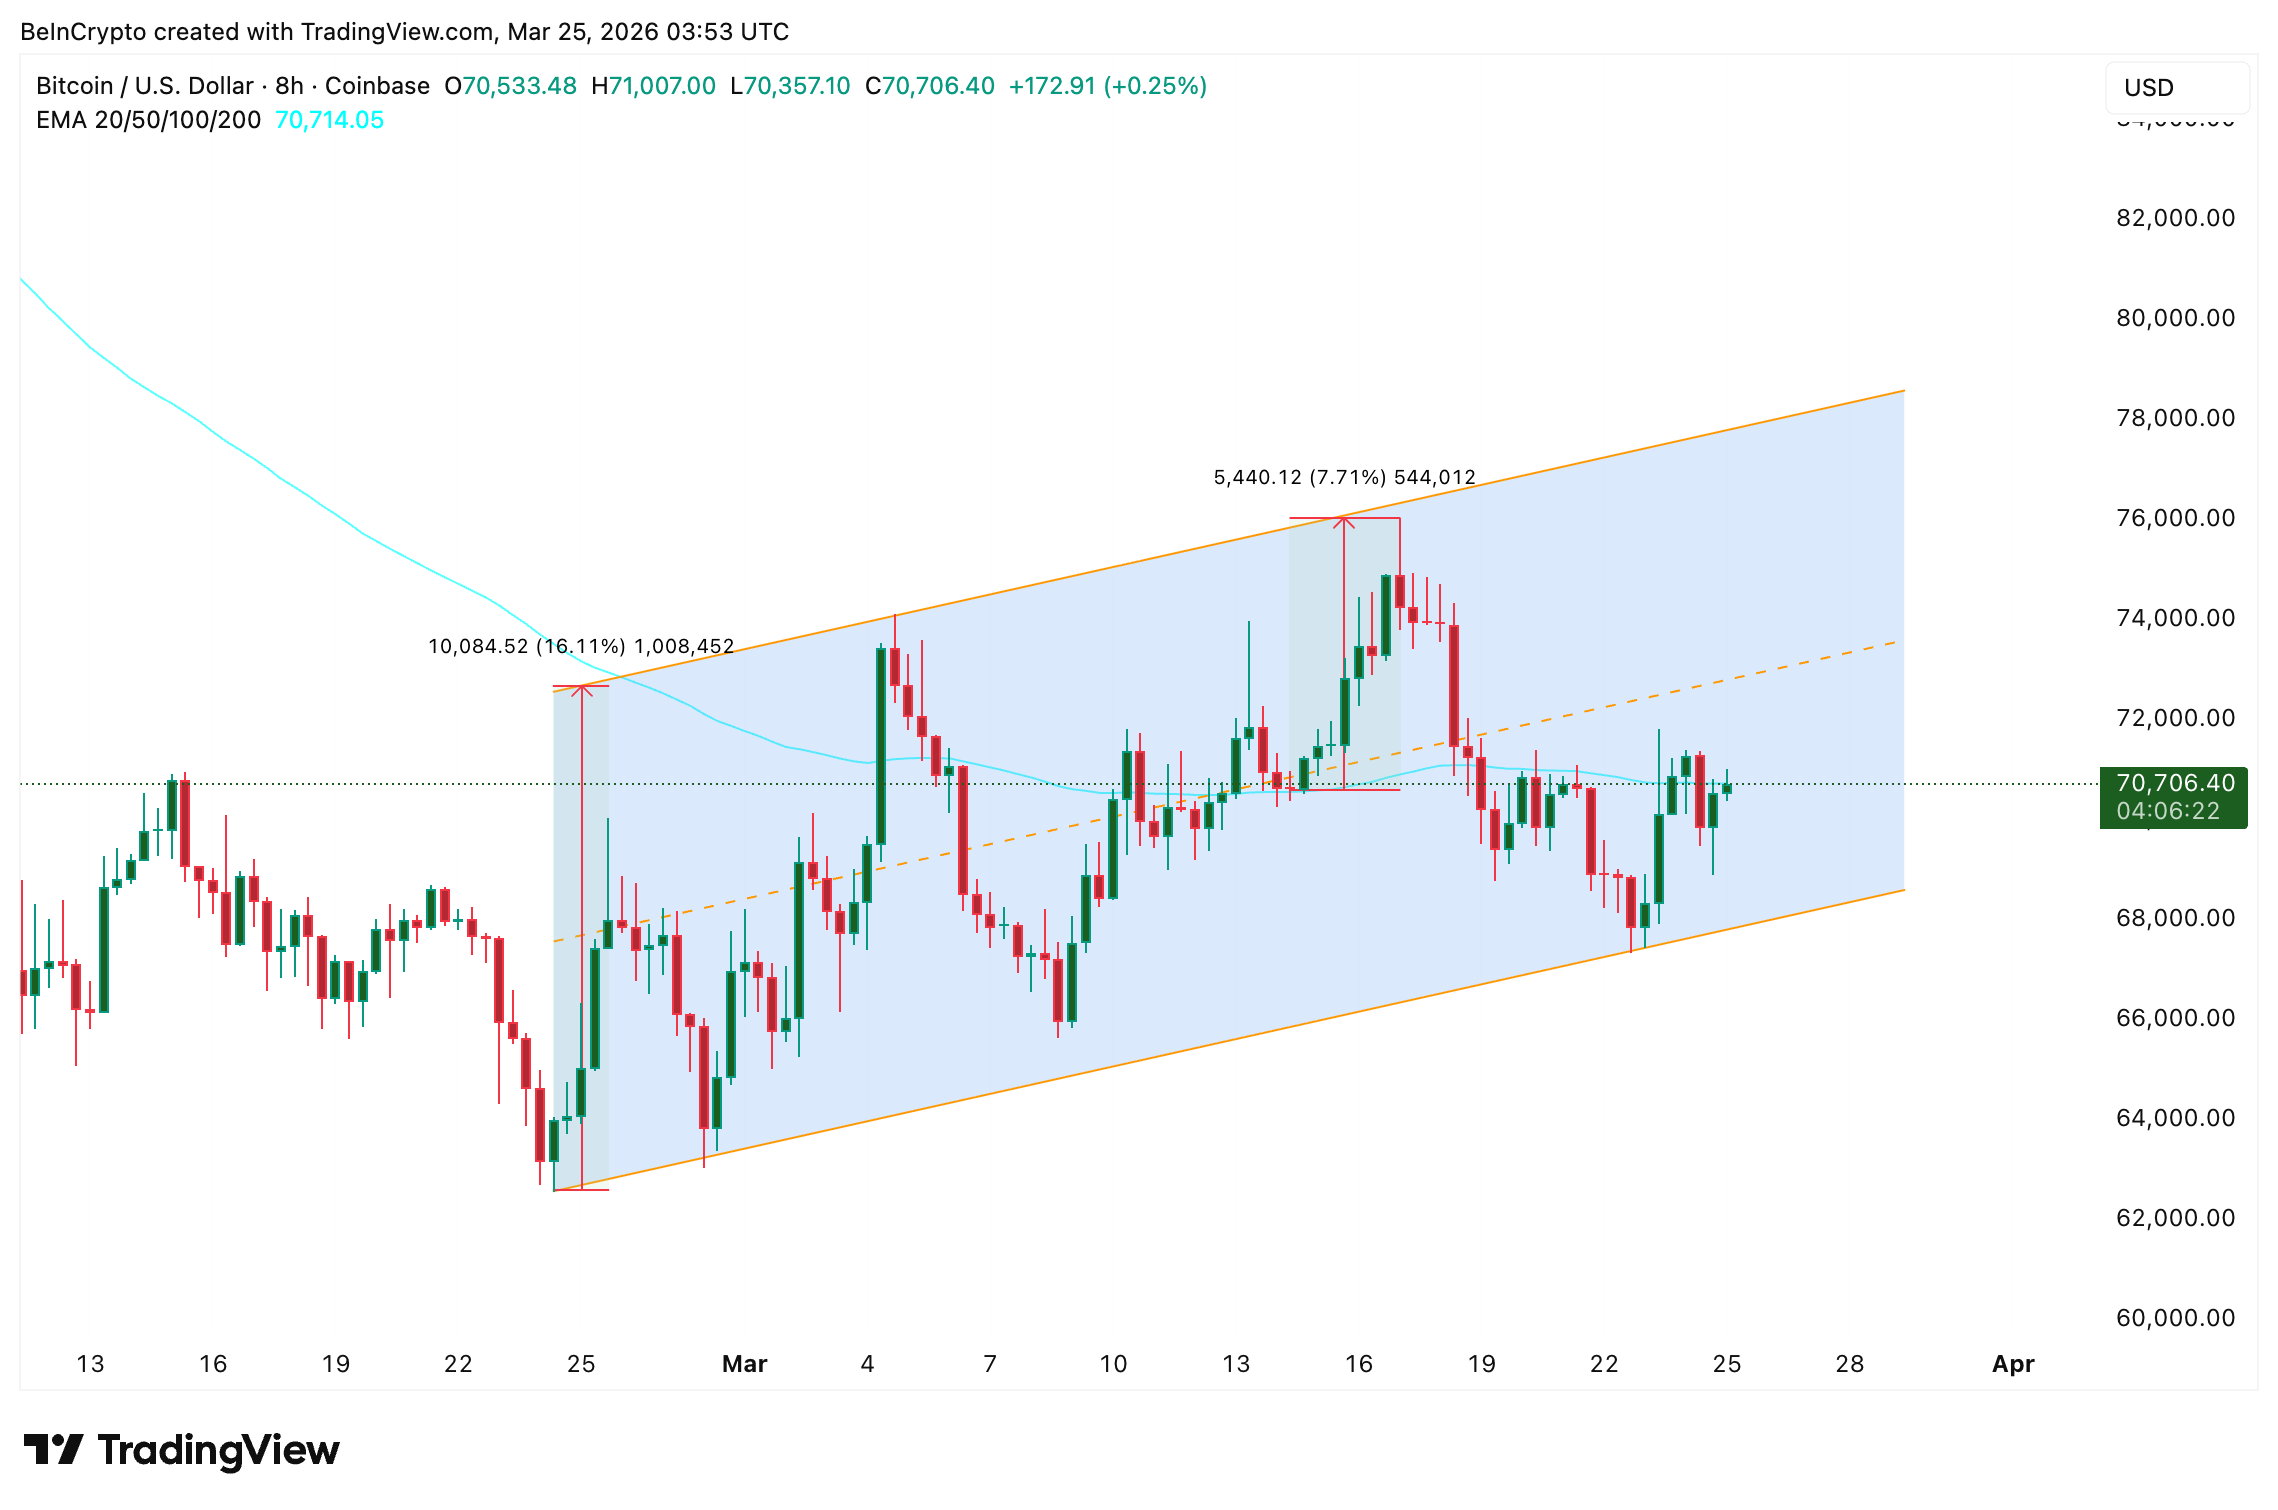 $BTC Ascending Channel">
A similar reclamation above $70,900 would signal near-term strength and a possible push toward $72,800 and eventually $76,000, closer to the channel’s upper boundary. All of this could happen if the Iran-US ceasefire talks advance.
However, if the EMA reclamation fails, the downside levels become critical. The 0.5 Fibonacci at $69,300 is the first support. Below that, $67,700 (0.618 Fib) represents a strong floor-like zone. A daily close below $67,700 would confirm that the spot selling pressure has won and open the path toward $65,400 and even $62,600.
Currently, an 8-hour close above $70,900 is what separates a potential channel bounce from a long cascade that the exchange inflow data is warning about.
The post Bitcoin Price Rallies 10% Into a Trap? Exchange Inflows Surge as Derivatives Go Long appeared first on BeInCrypto.