


 4
4
Bitcoin rebounded above a key support zone as buyers returned, while momentum and futures demand point to a possible breakout ahead today.
Bitcoin ($BTC) snapped back above $71,000 after a sharp intraday surge erased early weakness and put bulls back in control of the short-term trend. At the time of this press, Bitcoin traded at $71,000.3, up 3.82% over 24 hours, after bouncing from an earlier low near $68.33K.
That intraday structure matters because it shows aggressive buying interest stepped in once Bitcoin cleared the lower range.
The latest push back toward $71,000 also shows buyers remained active into the final part of the session. From here, the first level to watch is whether Bitcoin can keep holding above $71,000.
Can Bitcoin Hold Above $71,000
Bitcoin is pushing higher again, but its daily indicators show the market is still caught between recovery and a full breakout.
On the daily chart, Bitcoin traded near $71,175, extending its rebound after recovering from the recent pullback. The price is now sitting well above the Chande Kroll Stop long level at $68,433, which suggests bulls have regained short-term control after defending lower support.
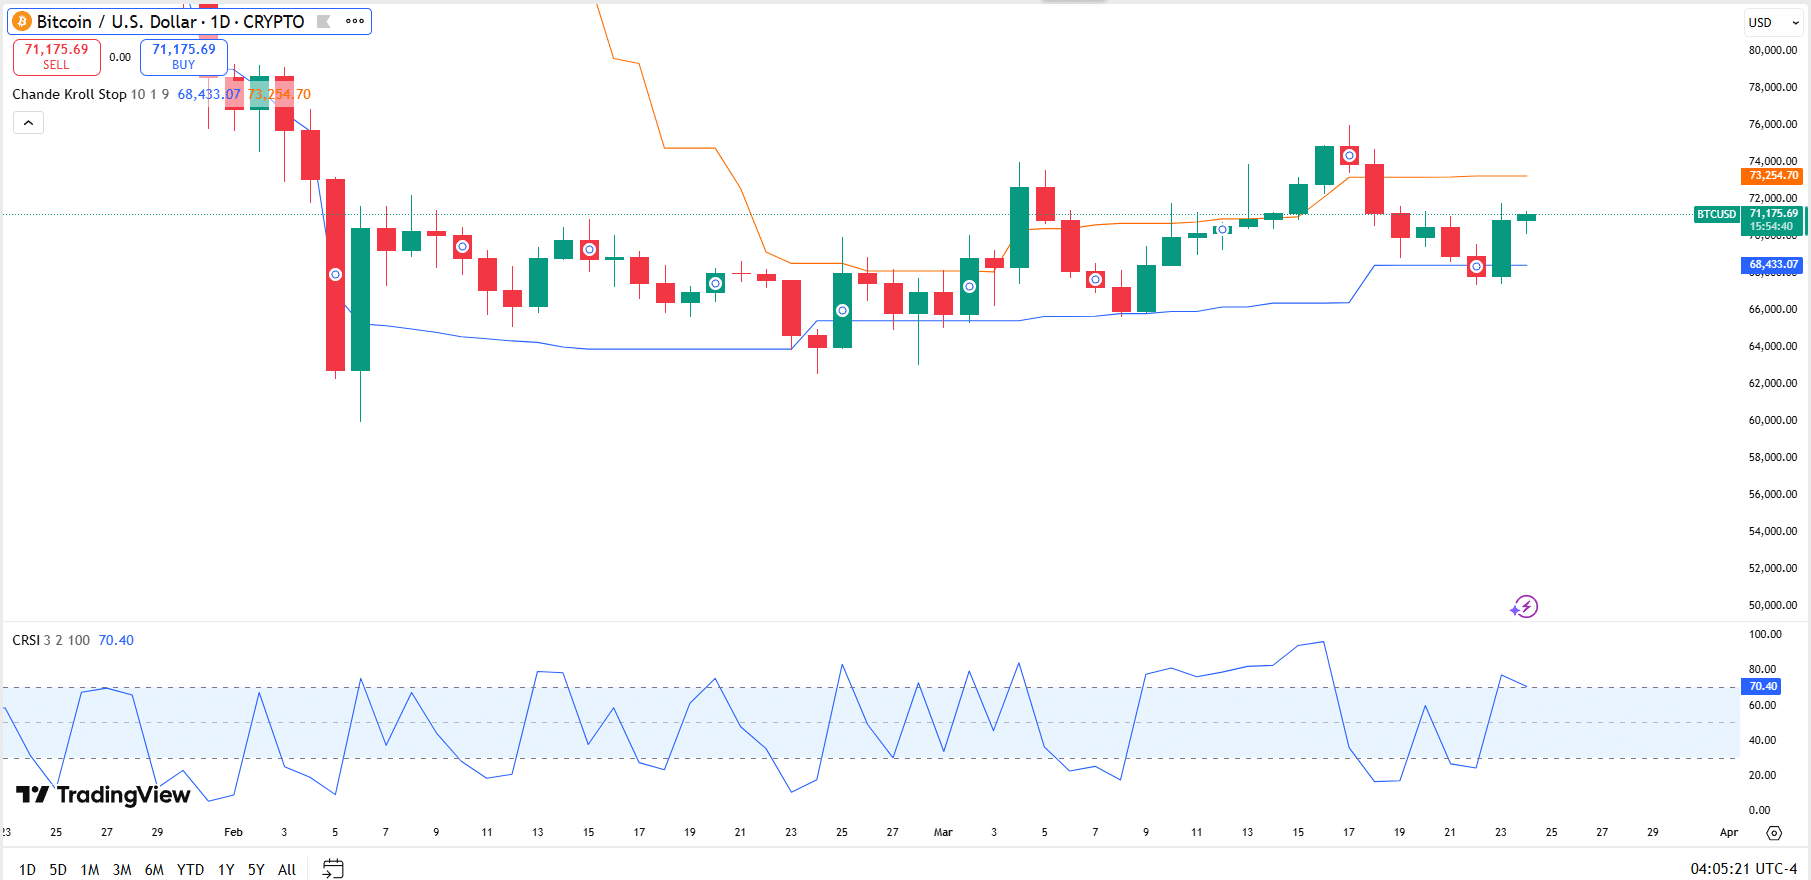
That said, the move still lacks full confirmation. Bitcoin remains below the Chande Kroll Stop short level at $73,254, which now stands out as the next major upside barrier. In practical terms, that leaves $BTC in a transition zone. The structure has improved, but buyers still need a decisive push above $73,254 to strengthen the case for a broader continuation higher.
The second indicator, Connors RSI (CRSI), came in at 70.40. That reading shows momentum has strengthened sharply, now entering elevated territory. A CRSI near or above 70 often signals that buying pressure has accelerated quickly.
That can support continued upside in a strong trend, but it can also mean the market is getting stretched and may pause before the next move.
Bitcoin Futures Flows
Meanwhile, Coinglass data showed mostly positive futures flows over the latest tracked periods, pointing to stronger derivatives-side demand despite a brief dip in the 30-minute window.
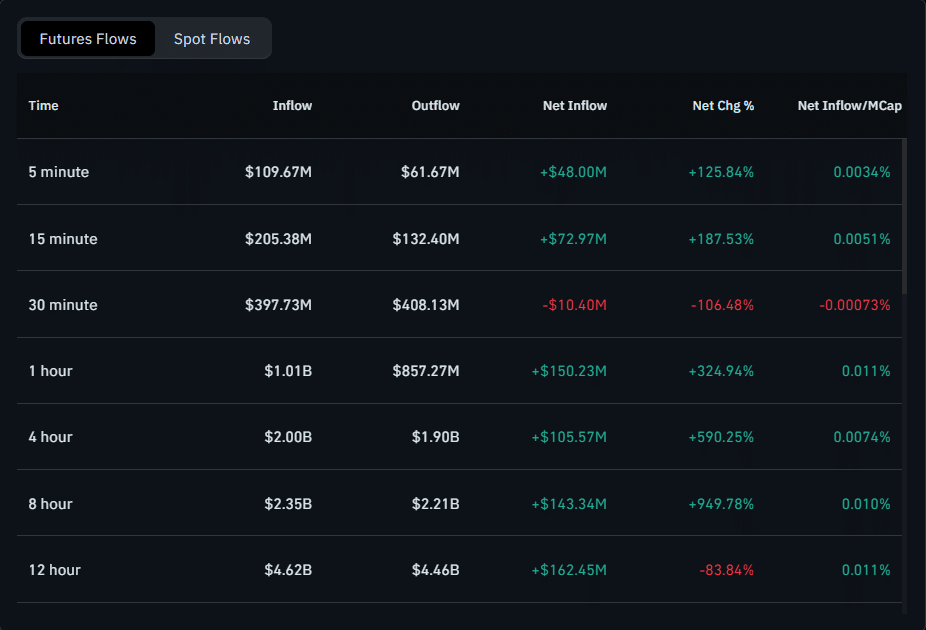
The table showed net inflows of $48.00 million over 5 minutes, $72.97 million over 15 minutes, and $150.23 million over 1 hour. It also showed net inflows of $105.57 million over 4 hours, $143.34 million over 8 hours, and $162.45 million over 12 hours.
The only negative reading appeared in the 30-minute period, where outflows of $408.13 million exceeded inflows of $397.73 million, resulting in a $10.40 million net outflow. Overall, the data suggest that futures traders were adding exposure across most short-term time frames.