

 5
5
Bitcoin ($BTC) is trading near $70,725 on March 21, trapped between rising long-term holder accumulation and a sustained stretch of on-chain realized losses that signal weak demand absorption above $70,000.
The tension between those two forces has compressed price action into a tight range for the better part of two weeks. The outcome of that compression will likely determine whether $BTC stages a clean break or retests lower support.
Bitcoin Holders Aren’t Showing Confidence
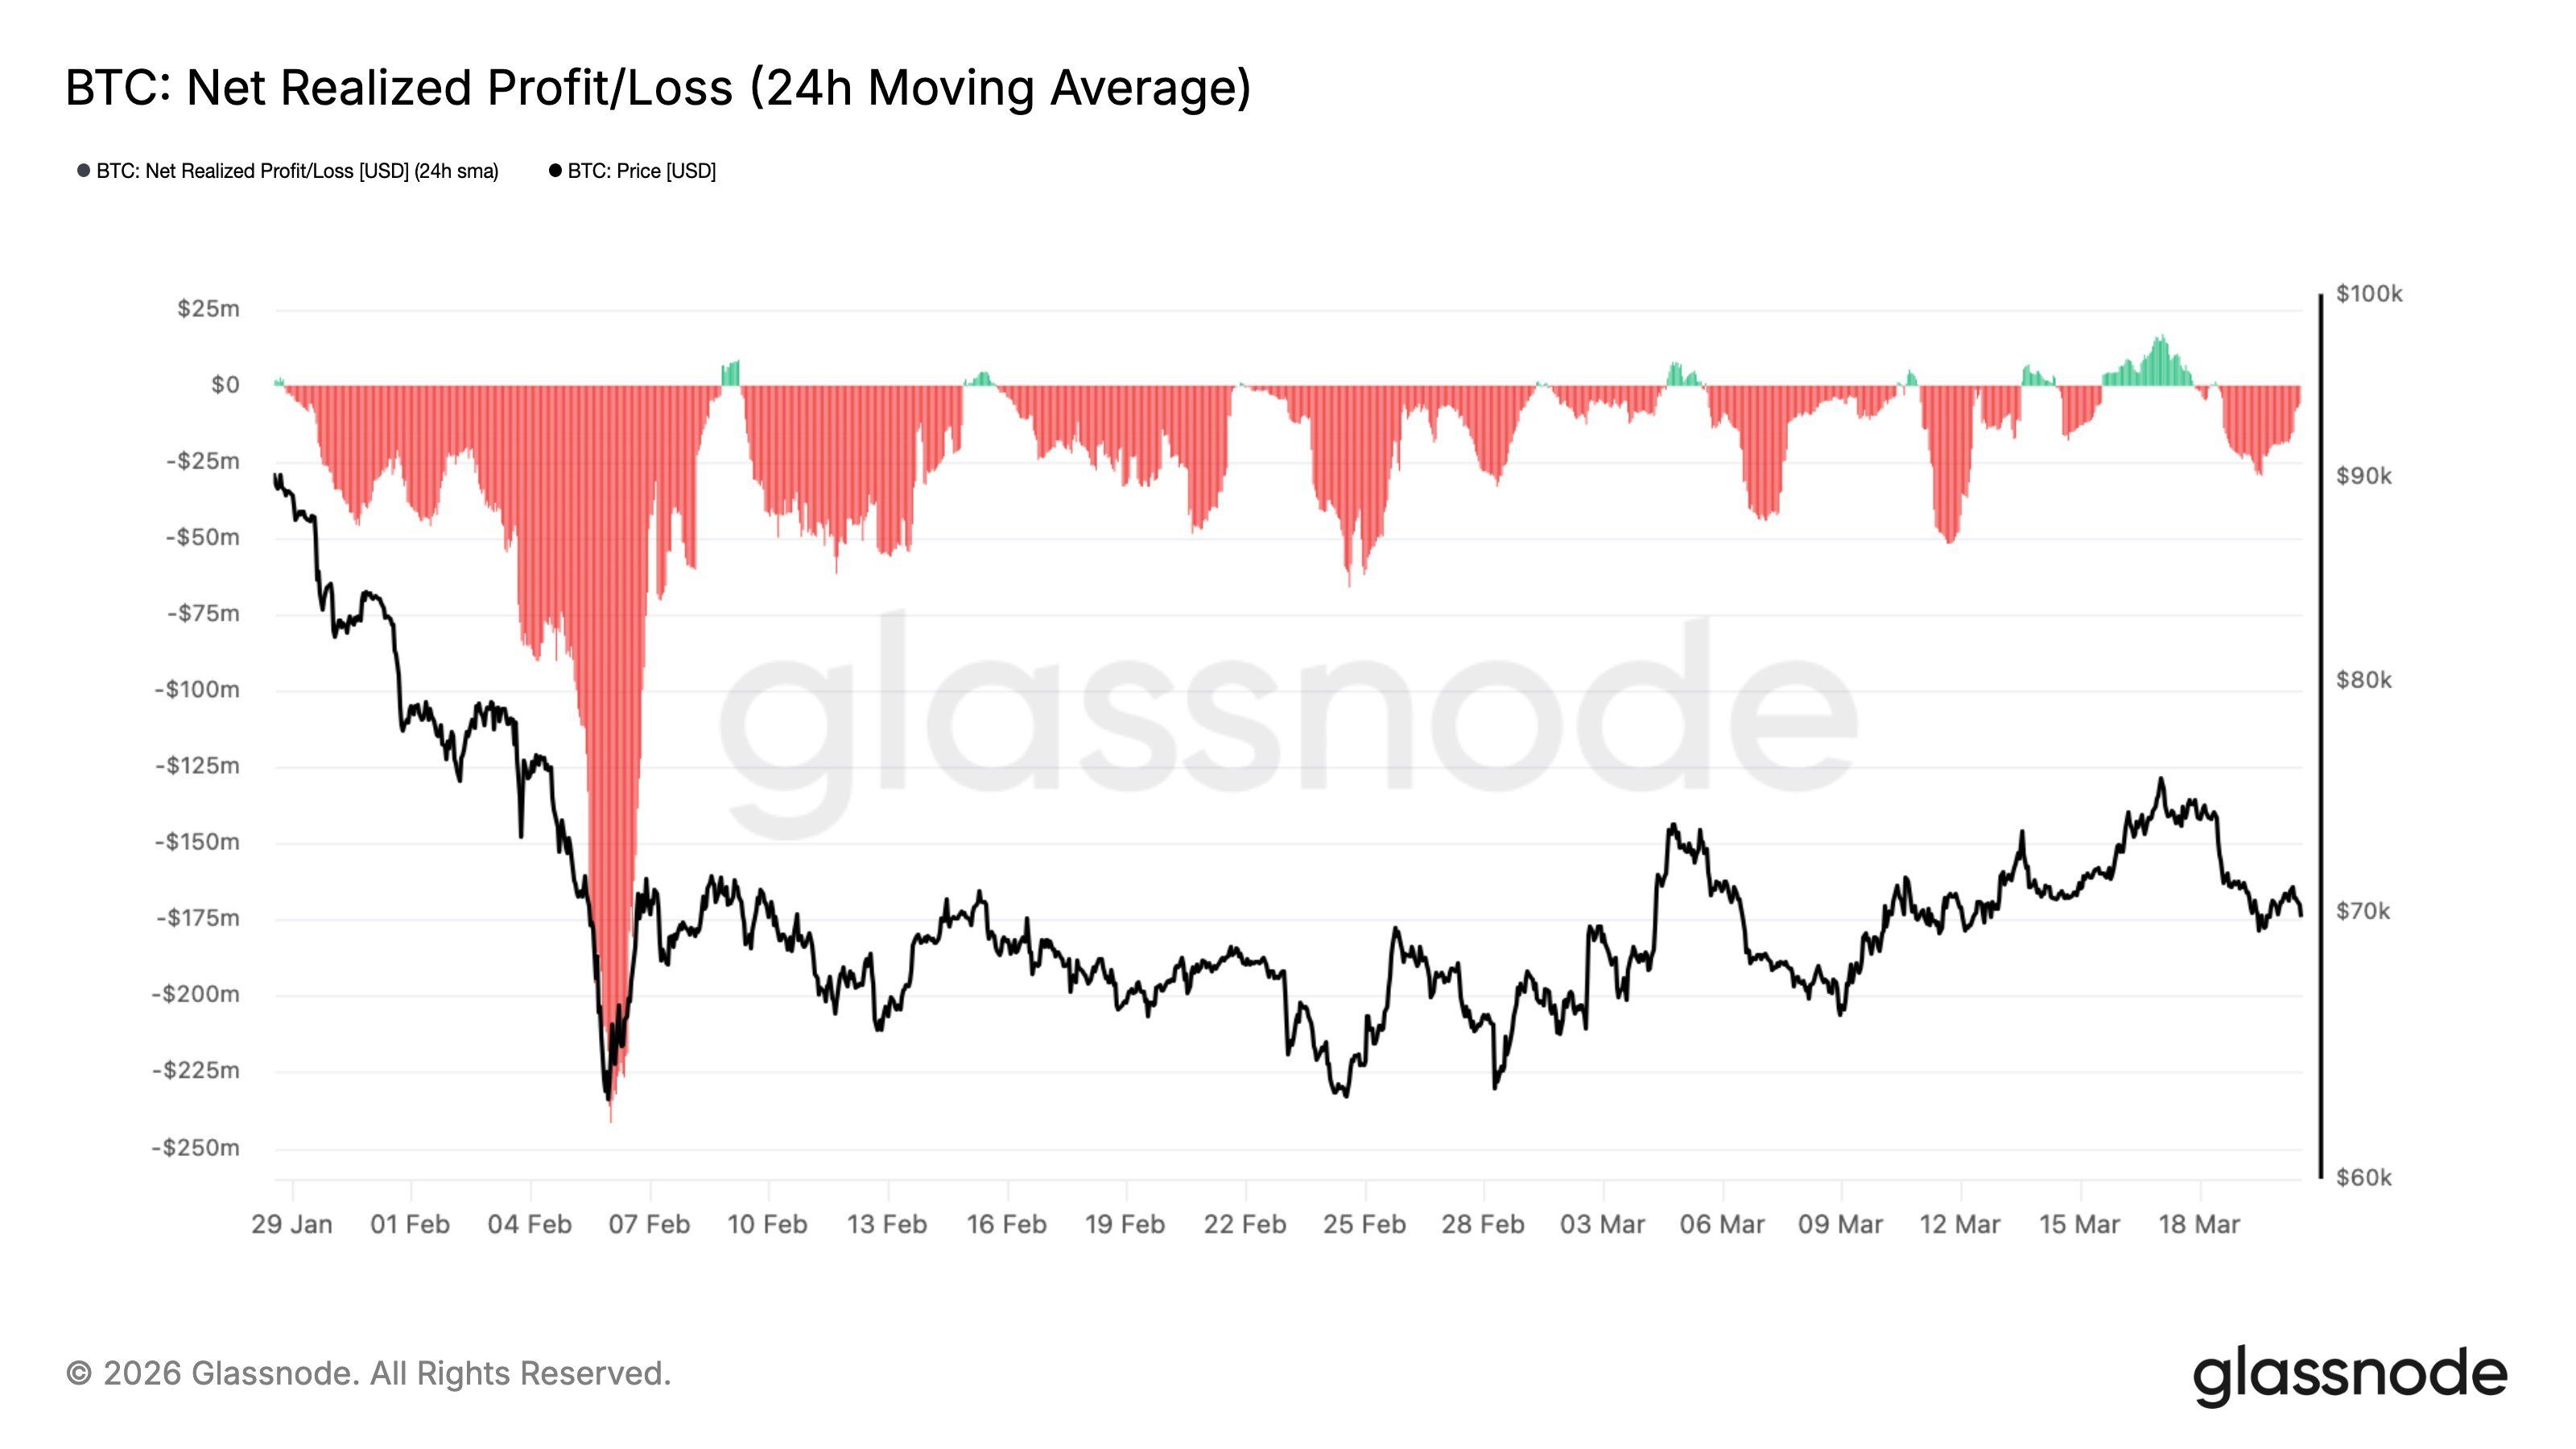
Glassnode’s $BTC Net Realized Profit/Loss (24h Moving Average) chart, covering January 29 through March 20, shows that the metric has remained almost entirely negative throughout the period. The deepest trough hit approximately -$240 million around February 7, coinciding with the sharpest price decline to near $62,000.
Since then, Bitcoin’s net realized losses have compressed to a shallower range, fluctuating between approximately -$25 million and -$50 million through mid-to-late March. Occasional flickers into positive territory appeared around February 9, February 14, and briefly in early-to-mid March, but none sustained.
The most recent reading, as of March 18–19, shows the metric still negative, in the -$25 million range, even as the price recovered to $74,000 and pulled back.
Want more token insights like this? Sign up for Editor Harsh Notariya’s Daily Crypto Newsletter here.
This matters because prolonged negative net realized P/L indicates that the market’s cost basis sits above the current price for a large portion of holders.
Buyers who entered during the late 2025 rally are still underwater, and their reluctance to sell is not translating into price strength.
For the metric to flip sustainably positive, $BTC needs to hold above the average cost basis of recent buyers—a threshold the price chart suggests lies between $72,000 and $75,000.
LTHs Are Still Optimistic
Despite the realized loss of pressure, the Glassnode Long-Term Holder (LTH) supply chart tells a contrasting story. Total supply held by long-term holders bottomed at approximately 14.46 million $BTC around February 4–5, at the exact point where price collapsed to its cycle lows near $62,000.
Since then, LTH supply has climbed steadily to approximately 14.61 million $BTC as of March 20 — a net addition of roughly 150,000 $BTC over six weeks.
The orange line’s trajectory has been consistent and upward, even as price whipsawed between $63,000 and $75,850.
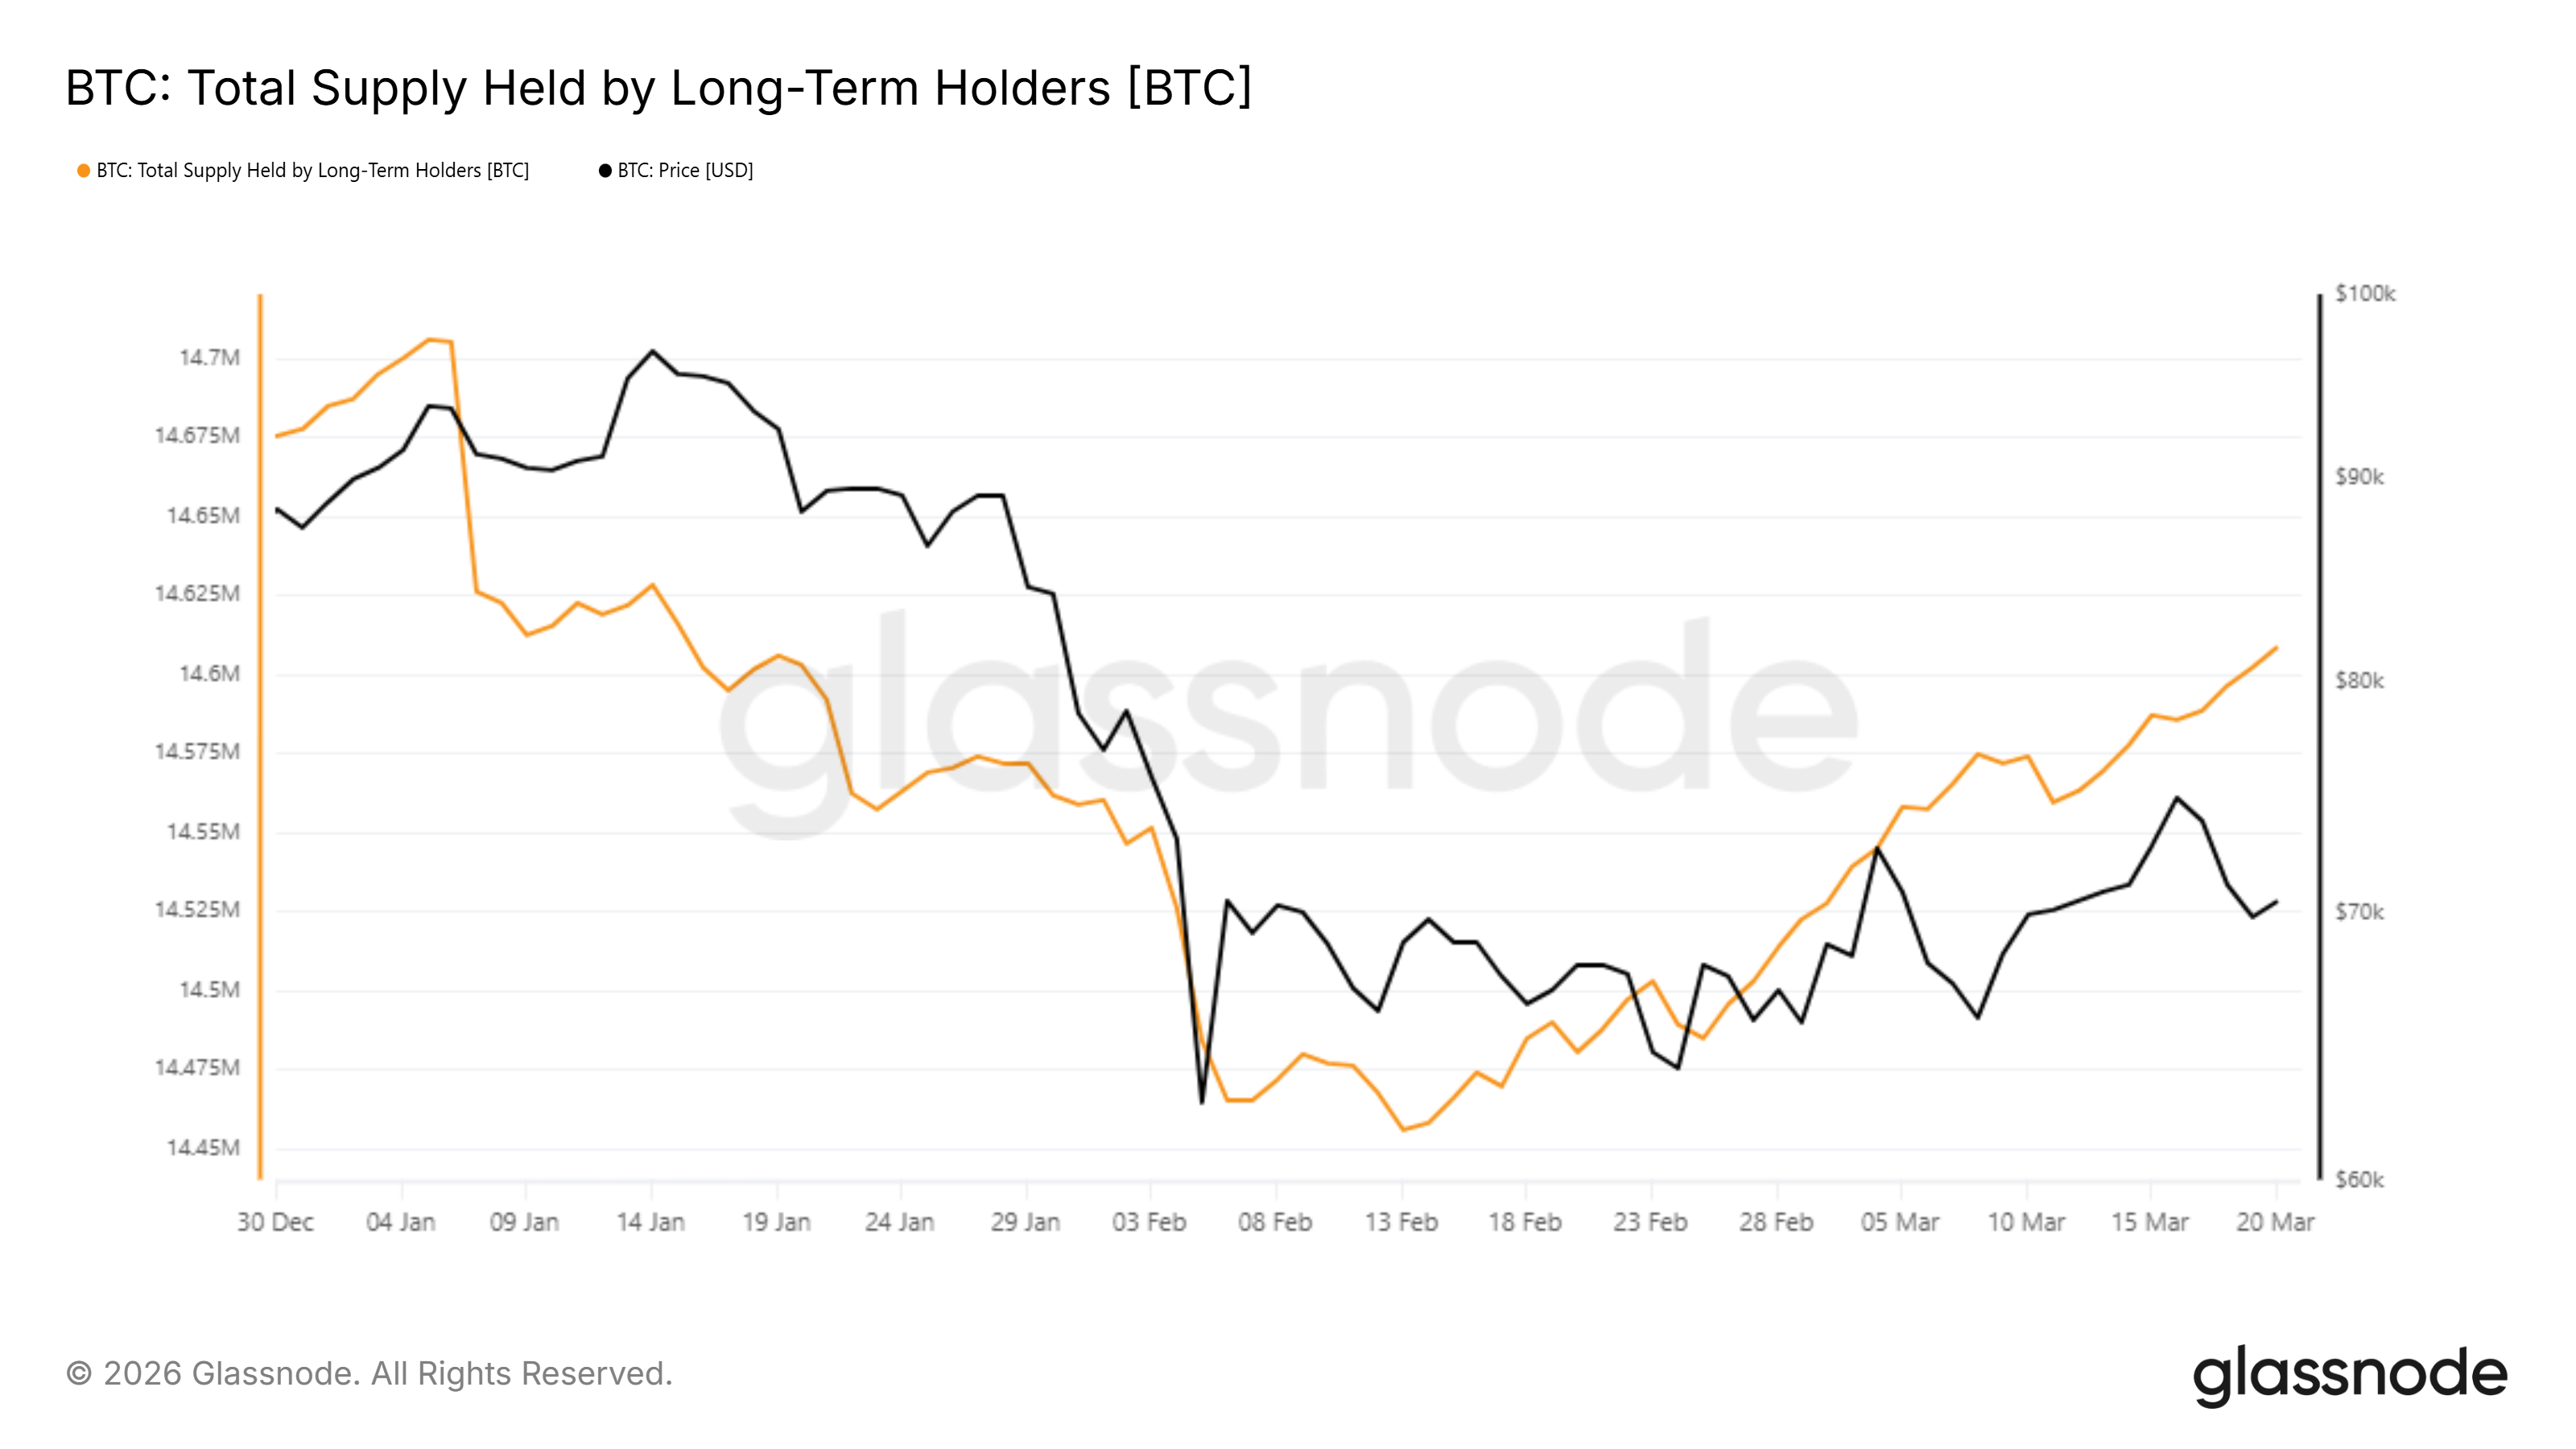
The divergence between the two charts is significant. Long-term holders are absorbing coins during every dip, reducing the liquid supply.
However, their accumulation has not been sufficient to push the price above the $75,850 resistance level. The supply constraint is building, but demand from short-term buyers and institutions has not yet come together with enough force to clear the overhead wall.
Is Bitcoin Set To Establish a Ceiling?
Bitcoin’s price is at $70,725 inside a Bollinger Band squeeze. The upper band has pulled back to approximately $74,636; the middle band sits near $70,366; and the lower band is rising toward $66,097. The tightening of the bands signals a contraction in volatility — a condition that historically precedes a sharp directional move.
Bitcoin price reached a high of $75,850 on March 17 before a two-candle rejection brought it back below $74,000. That level is now confirmed resistance. Below the current price, the first visible support is $68,865, followed by the lower Bollinger Band at $66,097 and the deeper floor at $62,891.
The setup frames a clear binary. A daily close above $75,850 — backed by a positive flip in net realized P/L — would remove the primary overhead obstacle and bring $78,000 into range.
A break below $68,865, however, would confirm that LTH accumulation is insufficient to absorb sell pressure at current levels, opening the door to a retest of the $65,000–$66,000 zone.
The March 27 quarterly options expiry, with $14 billion in Bitcoin notional open interest, is the most likely catalyst for a resolution of the current range. Until that event clears, the Bollinger Band squeeze suggests the market is coiling for a move — but the direction is not yet set.
The post Will Demand Exhaustion Limit Bitcoin’s Upside to $70,000? appeared first on BeInCrypto.
