

 2
2
Bitcoin price has been trading flat in the past 24 hours, but the broader trend still shows strength. Over the last seven days, Bitcoin has gained more than 6%, signaling steady upward momentum.
However, short-term signals now suggest the rally may slow down before the next move. The setup is not bearish yet, but it is entering a phase where one key zone will decide whether the trend continues or pauses.
Bitcoin Price Shows Divergence Risk as Momentum Slows
On the 4-hour chart, Bitcoin price has formed a clear warning signal. Between March 4 and March 18, the price moved higher and created a new swing high near $74,800.
At the same time, the Relative Strength Index (RSI), a momentum indicator that measures the speed of price movement, formed a lower high. This is called a bearish divergence. It means price is rising, but the strength behind the move is weakening.
On shorter timeframes like the 4-hour chart, this setup often leads to a pullback. It does not always signal a full reversal, but it shows that buyers are losing some control in the short term.
Right now, the Bitcoin price is moving in a tight zone between $74,000 and $74,800 (two swing highs). A breakout above $74,800 would quickly invalidate this divergence and signal renewed strength.
To better understand this setup, BeInCrypto’s proprietary indicators provide additional clarity.
One Bitcoin indicator, which previously identified a low near $64,600, uses a 21-period Exponential Moving Average (EMA) and a specific RSI threshold. An EMA is a moving average that reacts faster to price changes.
This model’s level is now placed near $73,300. Losing that level earlier in March led to a near 7% correction.
Another tool, the Z-score model, measures how far the price is from its recent 30-period average. A higher Z-score means the price is stretched.
Currently, the Z-score is around 1.1, showing that the Bitcoin price is slightly stretched but not overheated. Earlier in March, when Bitcoin price reached similar levels near $74,800, the Z-score was much higher, at 3.15.
Now, even as the $BTC price has moved higher, the Z-score has moved lower. This shows the rally is cooling and becoming more stable.
On-Chain and Derivatives Data Show the Rally Remains Healthy
While the $BTC price chart signals a possible short-term pullback, on-chain data suggests the broader rally remains stable.
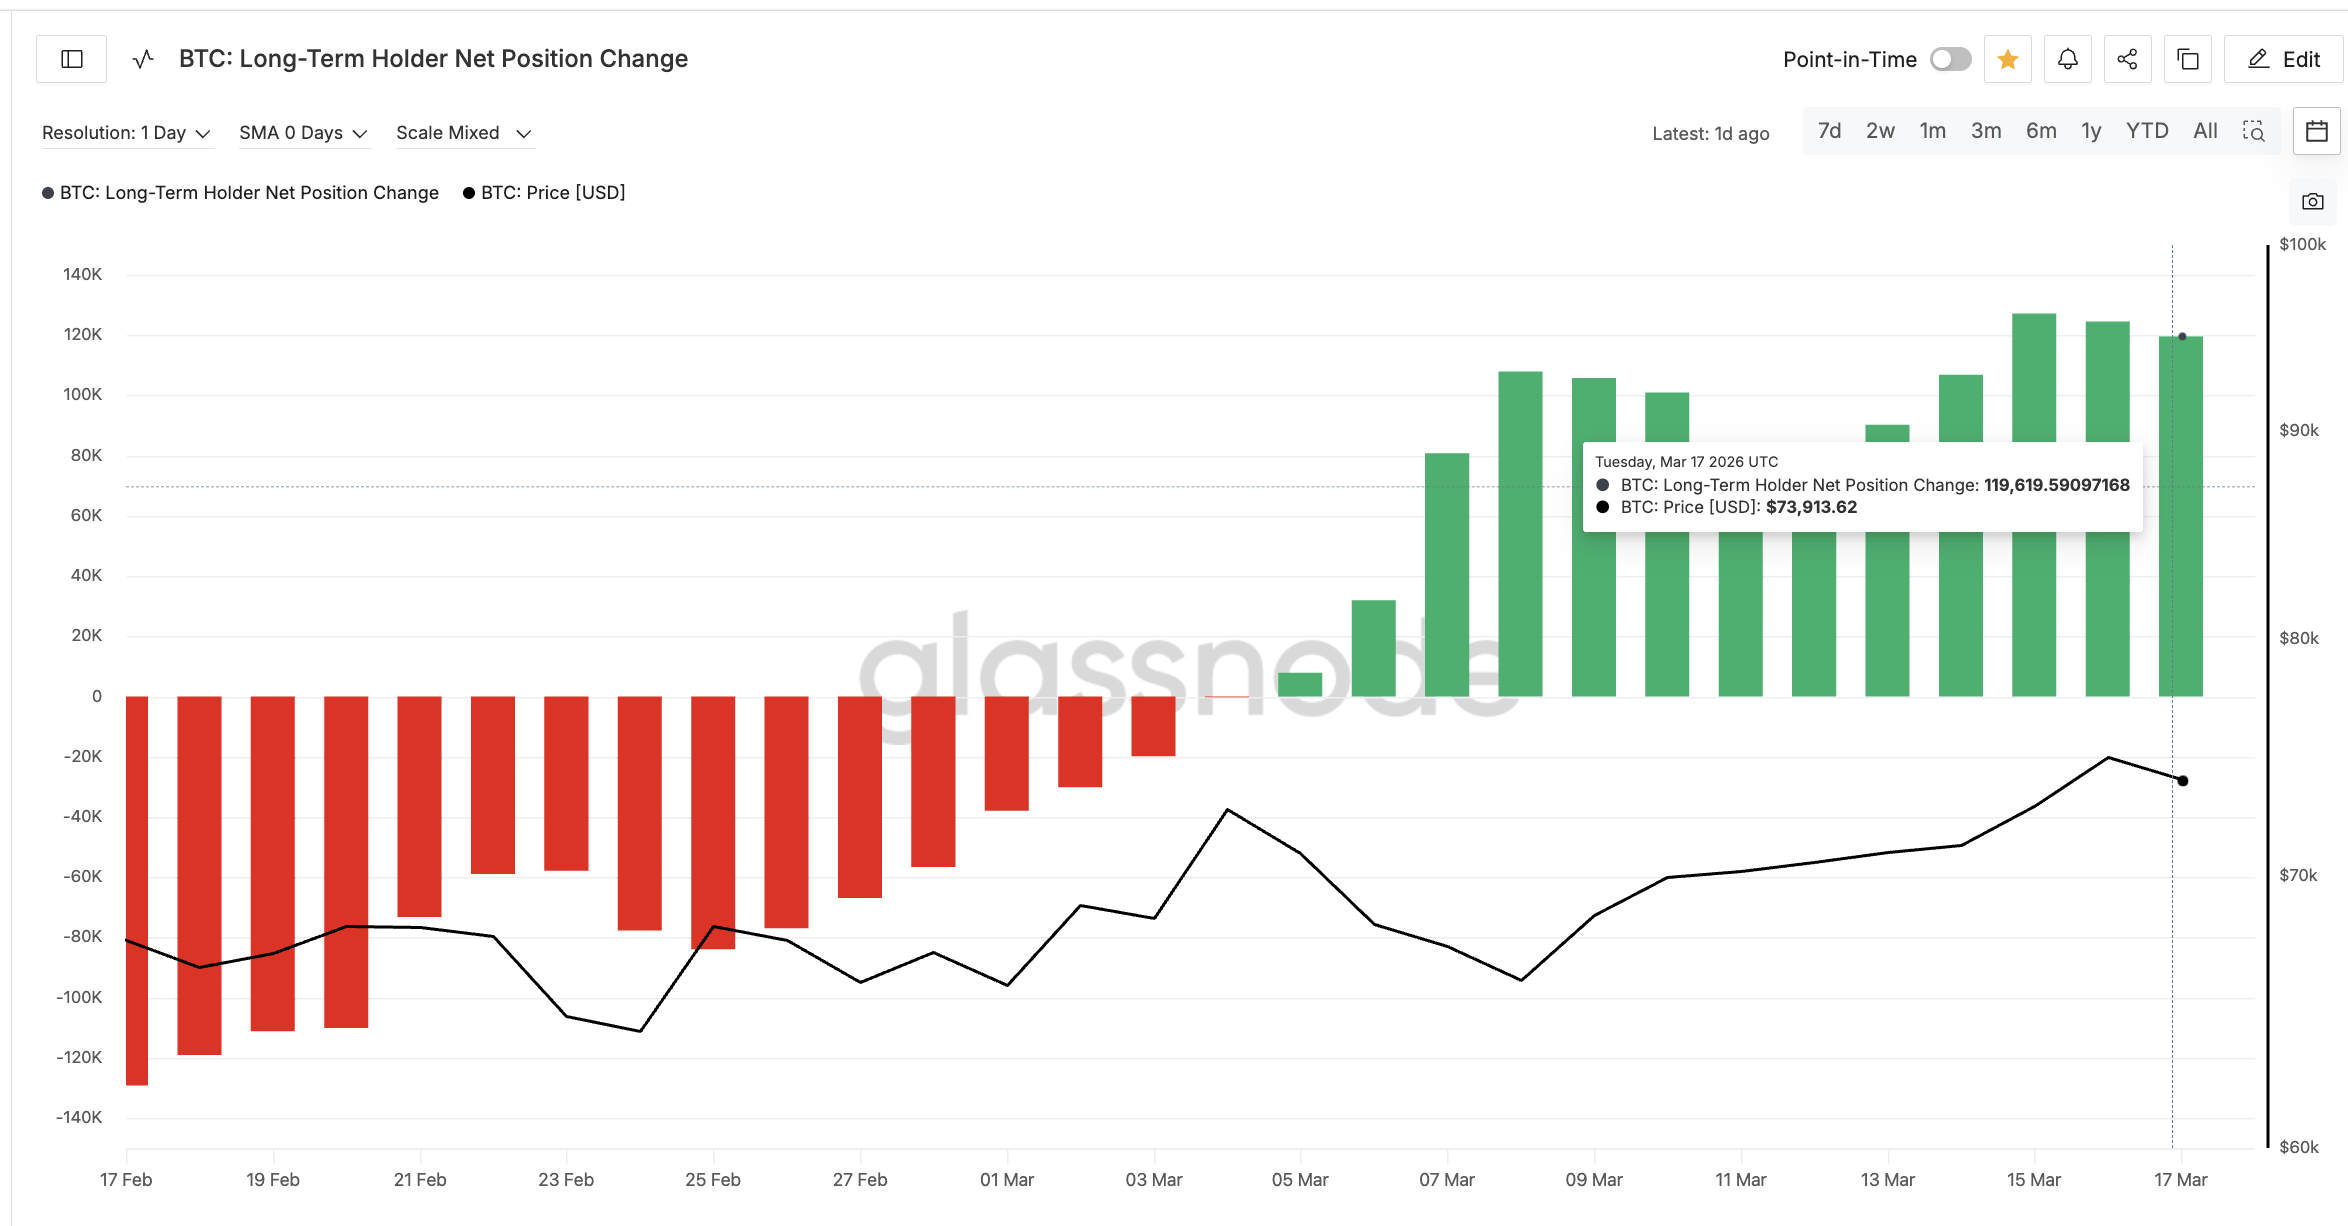
Long-term holders, who are investors holding Bitcoin over extended periods, are not making aggressive moves. Their net position change, which tracks the 30-day rolling change in holdings, has remained positive but mostly flat since March 15.
The latest reading stands near 119,600 $BTC. While this is slightly lower than earlier levels, it still shows accumulation. In simple terms, long-term holders are holding steady and waiting for a clear direction.
Want more token insights like this? Sign up for Editor Harsh Notariya’s Daily Crypto Newsletter here.
 $BTC Long-Term Holders">
A breakout above $74,800 could act as that trigger for renewed accumulation.
At the same time, derivatives data support a balanced structure. Open interest, which tracks the total value of active futures contracts, has slightly declined from $23.53 billion on March 16 to around $23.4 billion instead of rising with the rally. This shows that leverage is not aggressively building.
Funding rates, which indicate whether traders are paying to hold long or short positions, remain slightly negative near -0.004%. This means some traders are opening short positions in expectation of a pullback. However, this short positioning is not extreme yet. More importantly, there is no aggressive build-up of long positions either.
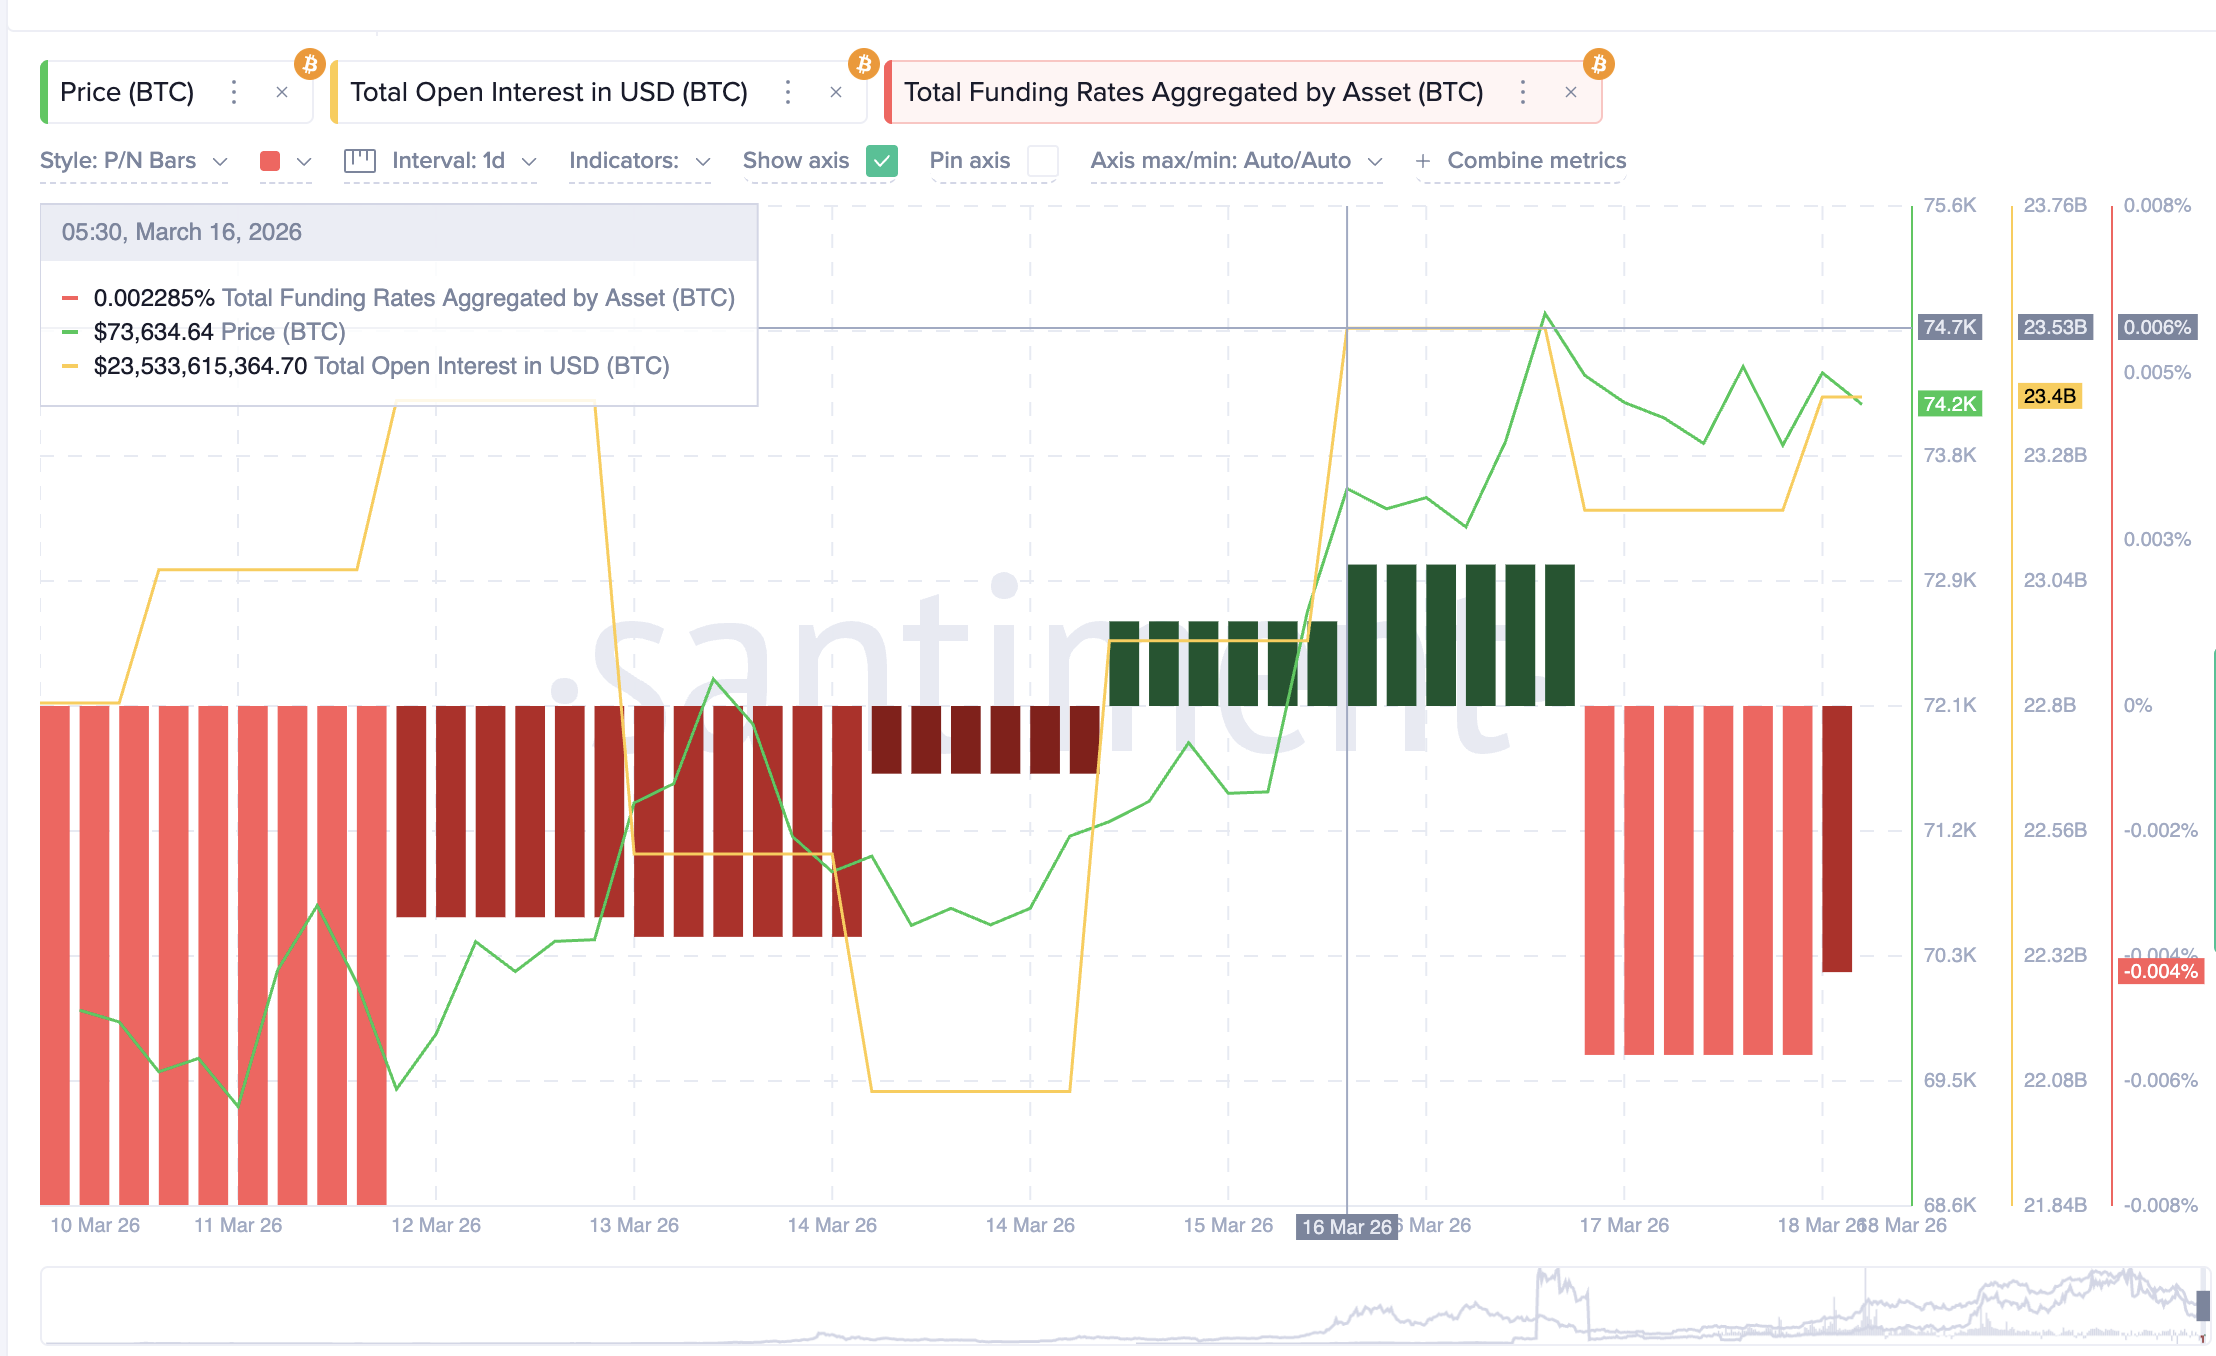
This is key. In many rallies, excessively long positions create the risk of sharp drops through long squeezes. Here, that risk remains limited because bullish positioning is not crowded.
Combined with the Z-score, which shows no overheating, this suggests the Bitcoin price is in a controlled pause rather than a weak rally.
Why $73,000 Is the Key Battle Zone for Bitcoin Price
The next move for Bitcoin price now depends on how it reacts around the $73,000 zone.
This area combines key levels around $73,300 (from the exhaustion model) and $73,500, forming a clear support range. It also aligns with the same indicator that previously identified the $64,600 low, adding strong technical significance.
If the RSI divergence leads to a pullback, this is the first zone where buyers are expected to step in. A strong hold above $73,000 would confirm that the trend remains intact and the pullback is temporary.
However, if the Bitcoin price breaks below this zone, the structure weakens. In that case, the next downside levels to watch are $72,000 and $70,800. A move toward these levels would signal a deeper correction.
On the upside, Bitcoin price needs to reclaim $74,800, the recent swing high. A 4-hour close above this level would invalidate the bearish divergence and signal renewed strength.
If momentum continues, the next key resistance stands near $76,000, the recent peak. A confirmed move above this level would suggest the broader uptrend is resuming. Putting everything together, the Bitcoin price is at a decision point. Short-term signals suggest a pullback, but broader data show the rally remains healthy. As long as the $73,000 zone holds, the trend still favors continuation rather than reversal.
The post Bitcoin Enters Critical Zone as a Proven Indicator Points to $73,000 Risk appeared first on BeInCrypto.