


 2
2
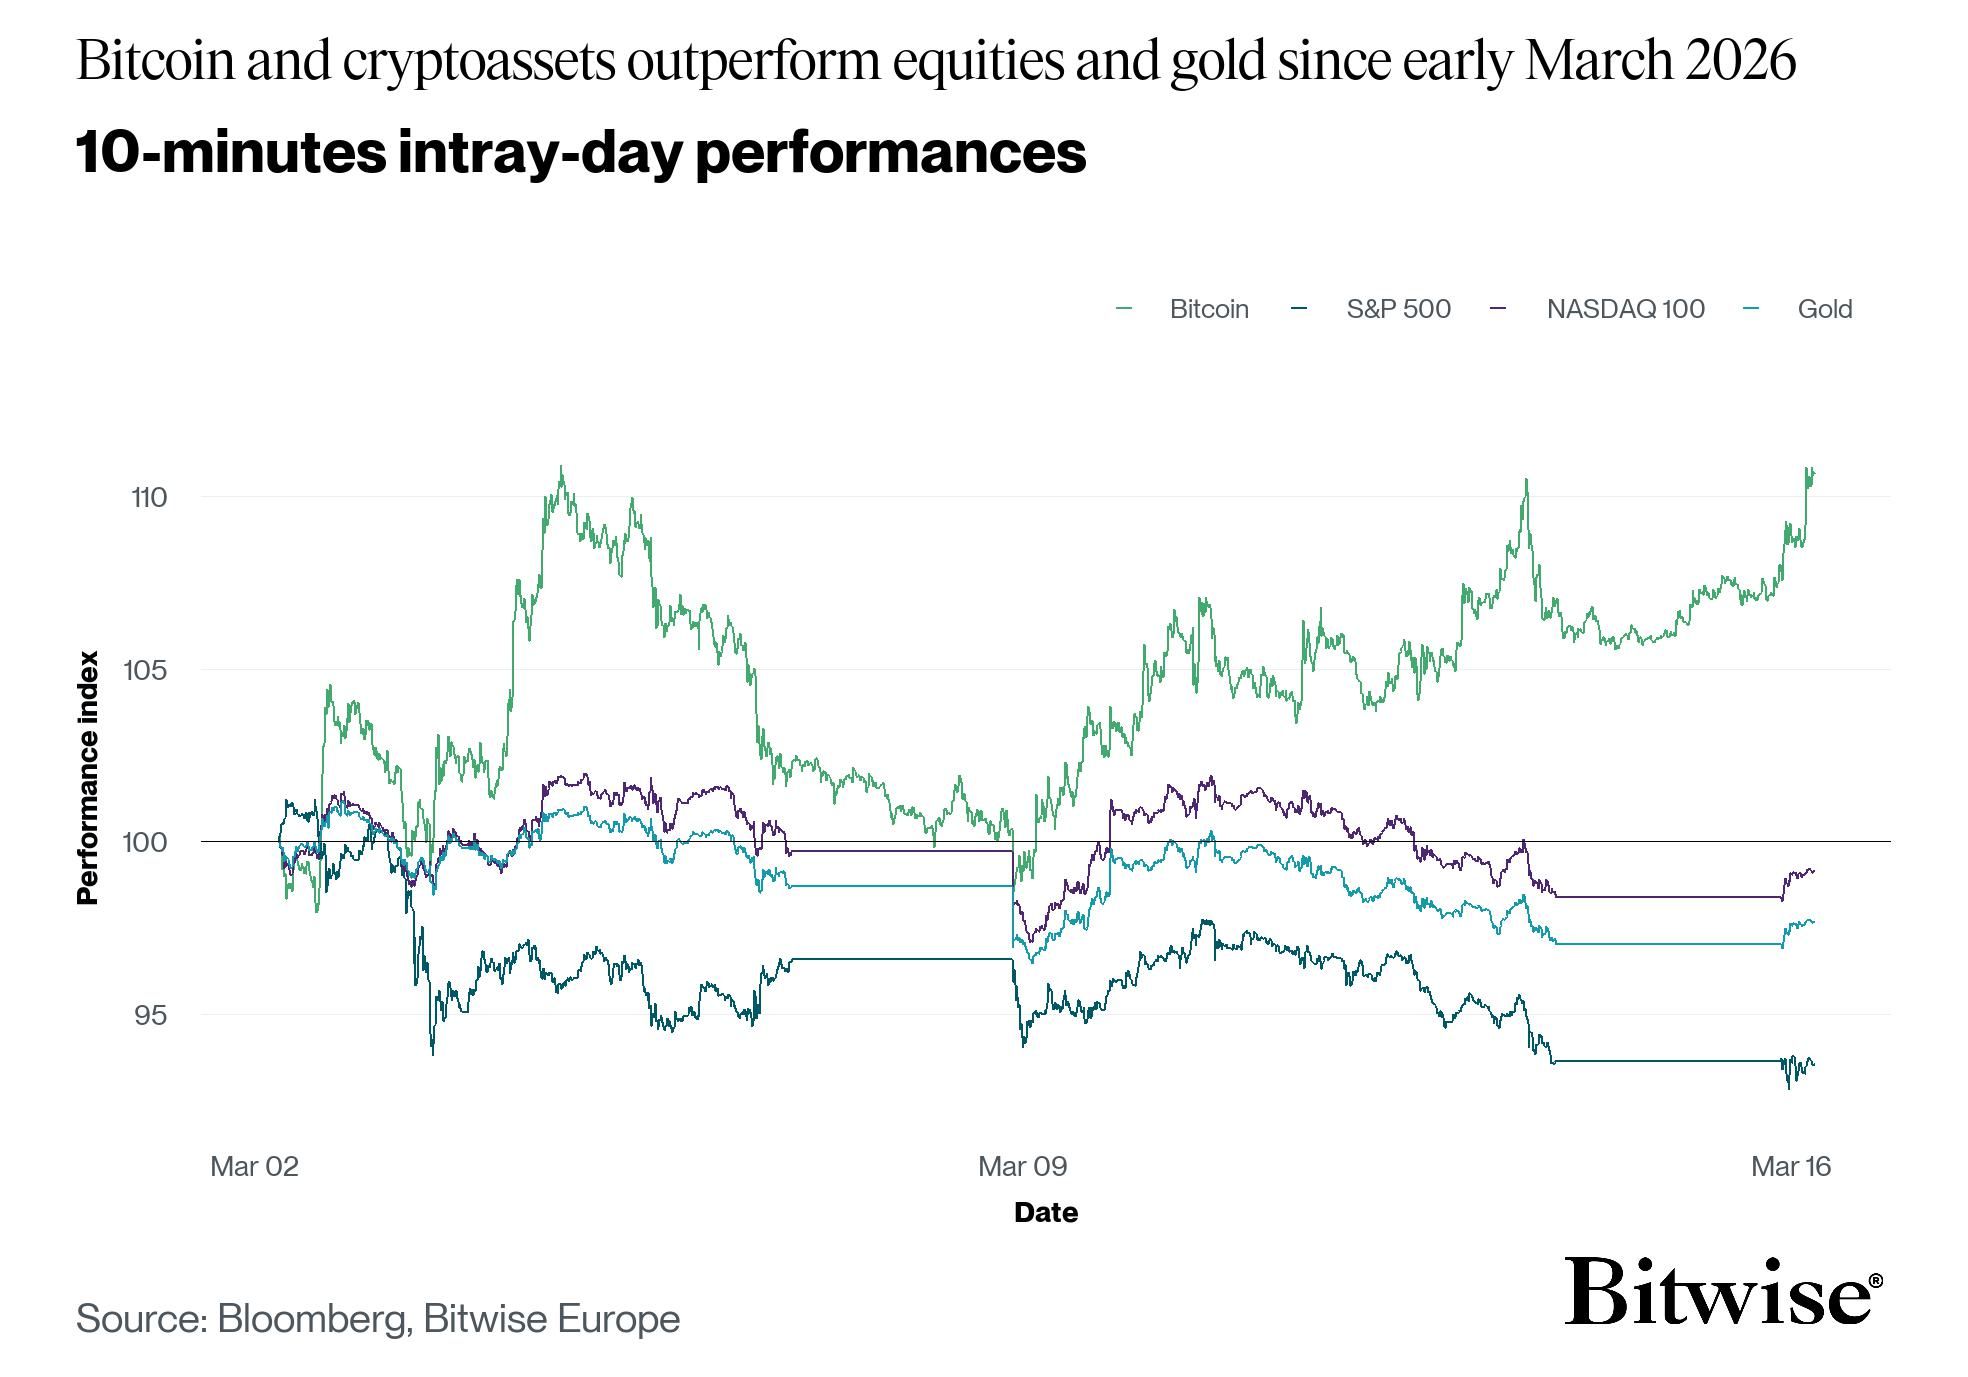
Market data shows that since early March, Bitcoin has outperformed both gold and US stocks. This trend has emerged even as tensions in the Middle East escalate.
The combination of geopolitical conditions and Bitcoin’s price behavior leads analysts to argue that Bitcoin is fulfilling its core role.
At the same time, internal market signals suggest that the recovery in March may have only just begun.
Bitcoin Outperforms Gold Amid Military Conflict
André Dragosch, an analyst at Bitwise, noted that Bitcoin has been outperforming US equities and gold since the beginning of March.
Since early March, after Israel launched attacks on Iran, gold prices have fallen from $5,400 to nearly $5,000. Meanwhile, Bitcoin has recovered from $65,000 to $75,000.
Investors remain cautious due to geopolitical and macroeconomic uncertainty. However, Bitwise’s latest report suggests that this shift could signal the early stage of capital rotation.
“This could signal the early stages of a rotation from stretched safe-haven assets into risk assets like $BTC,” André Dragosch predicted.
Bitwise also noted that gold’s performance usually leads Bitcoin by about four to seven months. This pattern suggests that if gold has already reached its peak, Bitcoin’s rally may continue for several more months before forming its own top.
Following this logic, further escalation in military conflict could push Bitcoin’s price even higher. Several analysts have supported this speculation.
“Maybe it takes a physical conflict to realise Bitcoin remains the most portable (cross-border), digital and liquid asset with no counter-party risks,” said Bernstein analyst Gautam Chhugani.
Bitcoin’s Internal Market Signals Improve in March
Meanwhile, internal indicators in the Bitcoin market are improving, creating a more supportive environment for price growth.
Bitcoin’s Inter-Exchange Flow Pulse (IFP) has moved above its 90-day moving average and turned bullish. This signal suggests that liquidity flows are becoming structurally more positive.
The IFP measures the intensity of $BTC transfers between centralized exchanges. It reflects how liquidity moves and is distributed across the market. Historically, strong growth phases often begin after the IFP climbs back above its 90-day average.
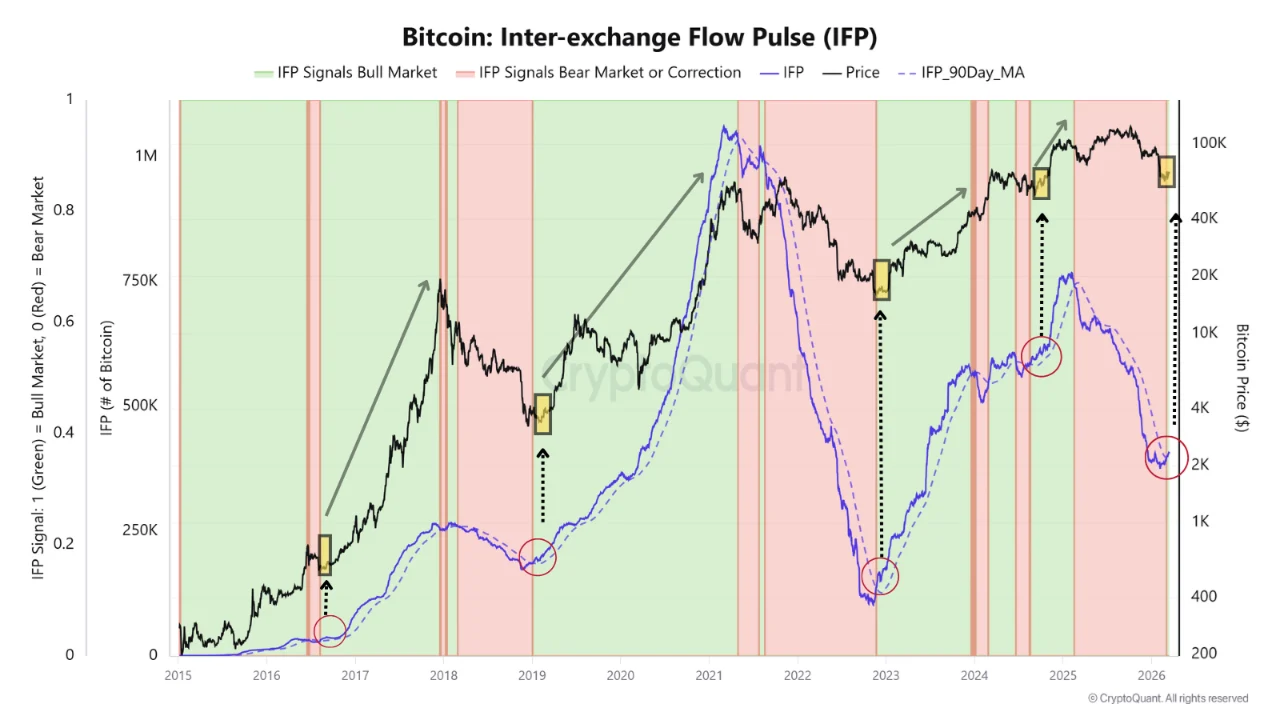
The latest signal indicates that liquidity flows between exchanges are returning. This development often appears during the early stage of a Bitcoin market expansion cycle.
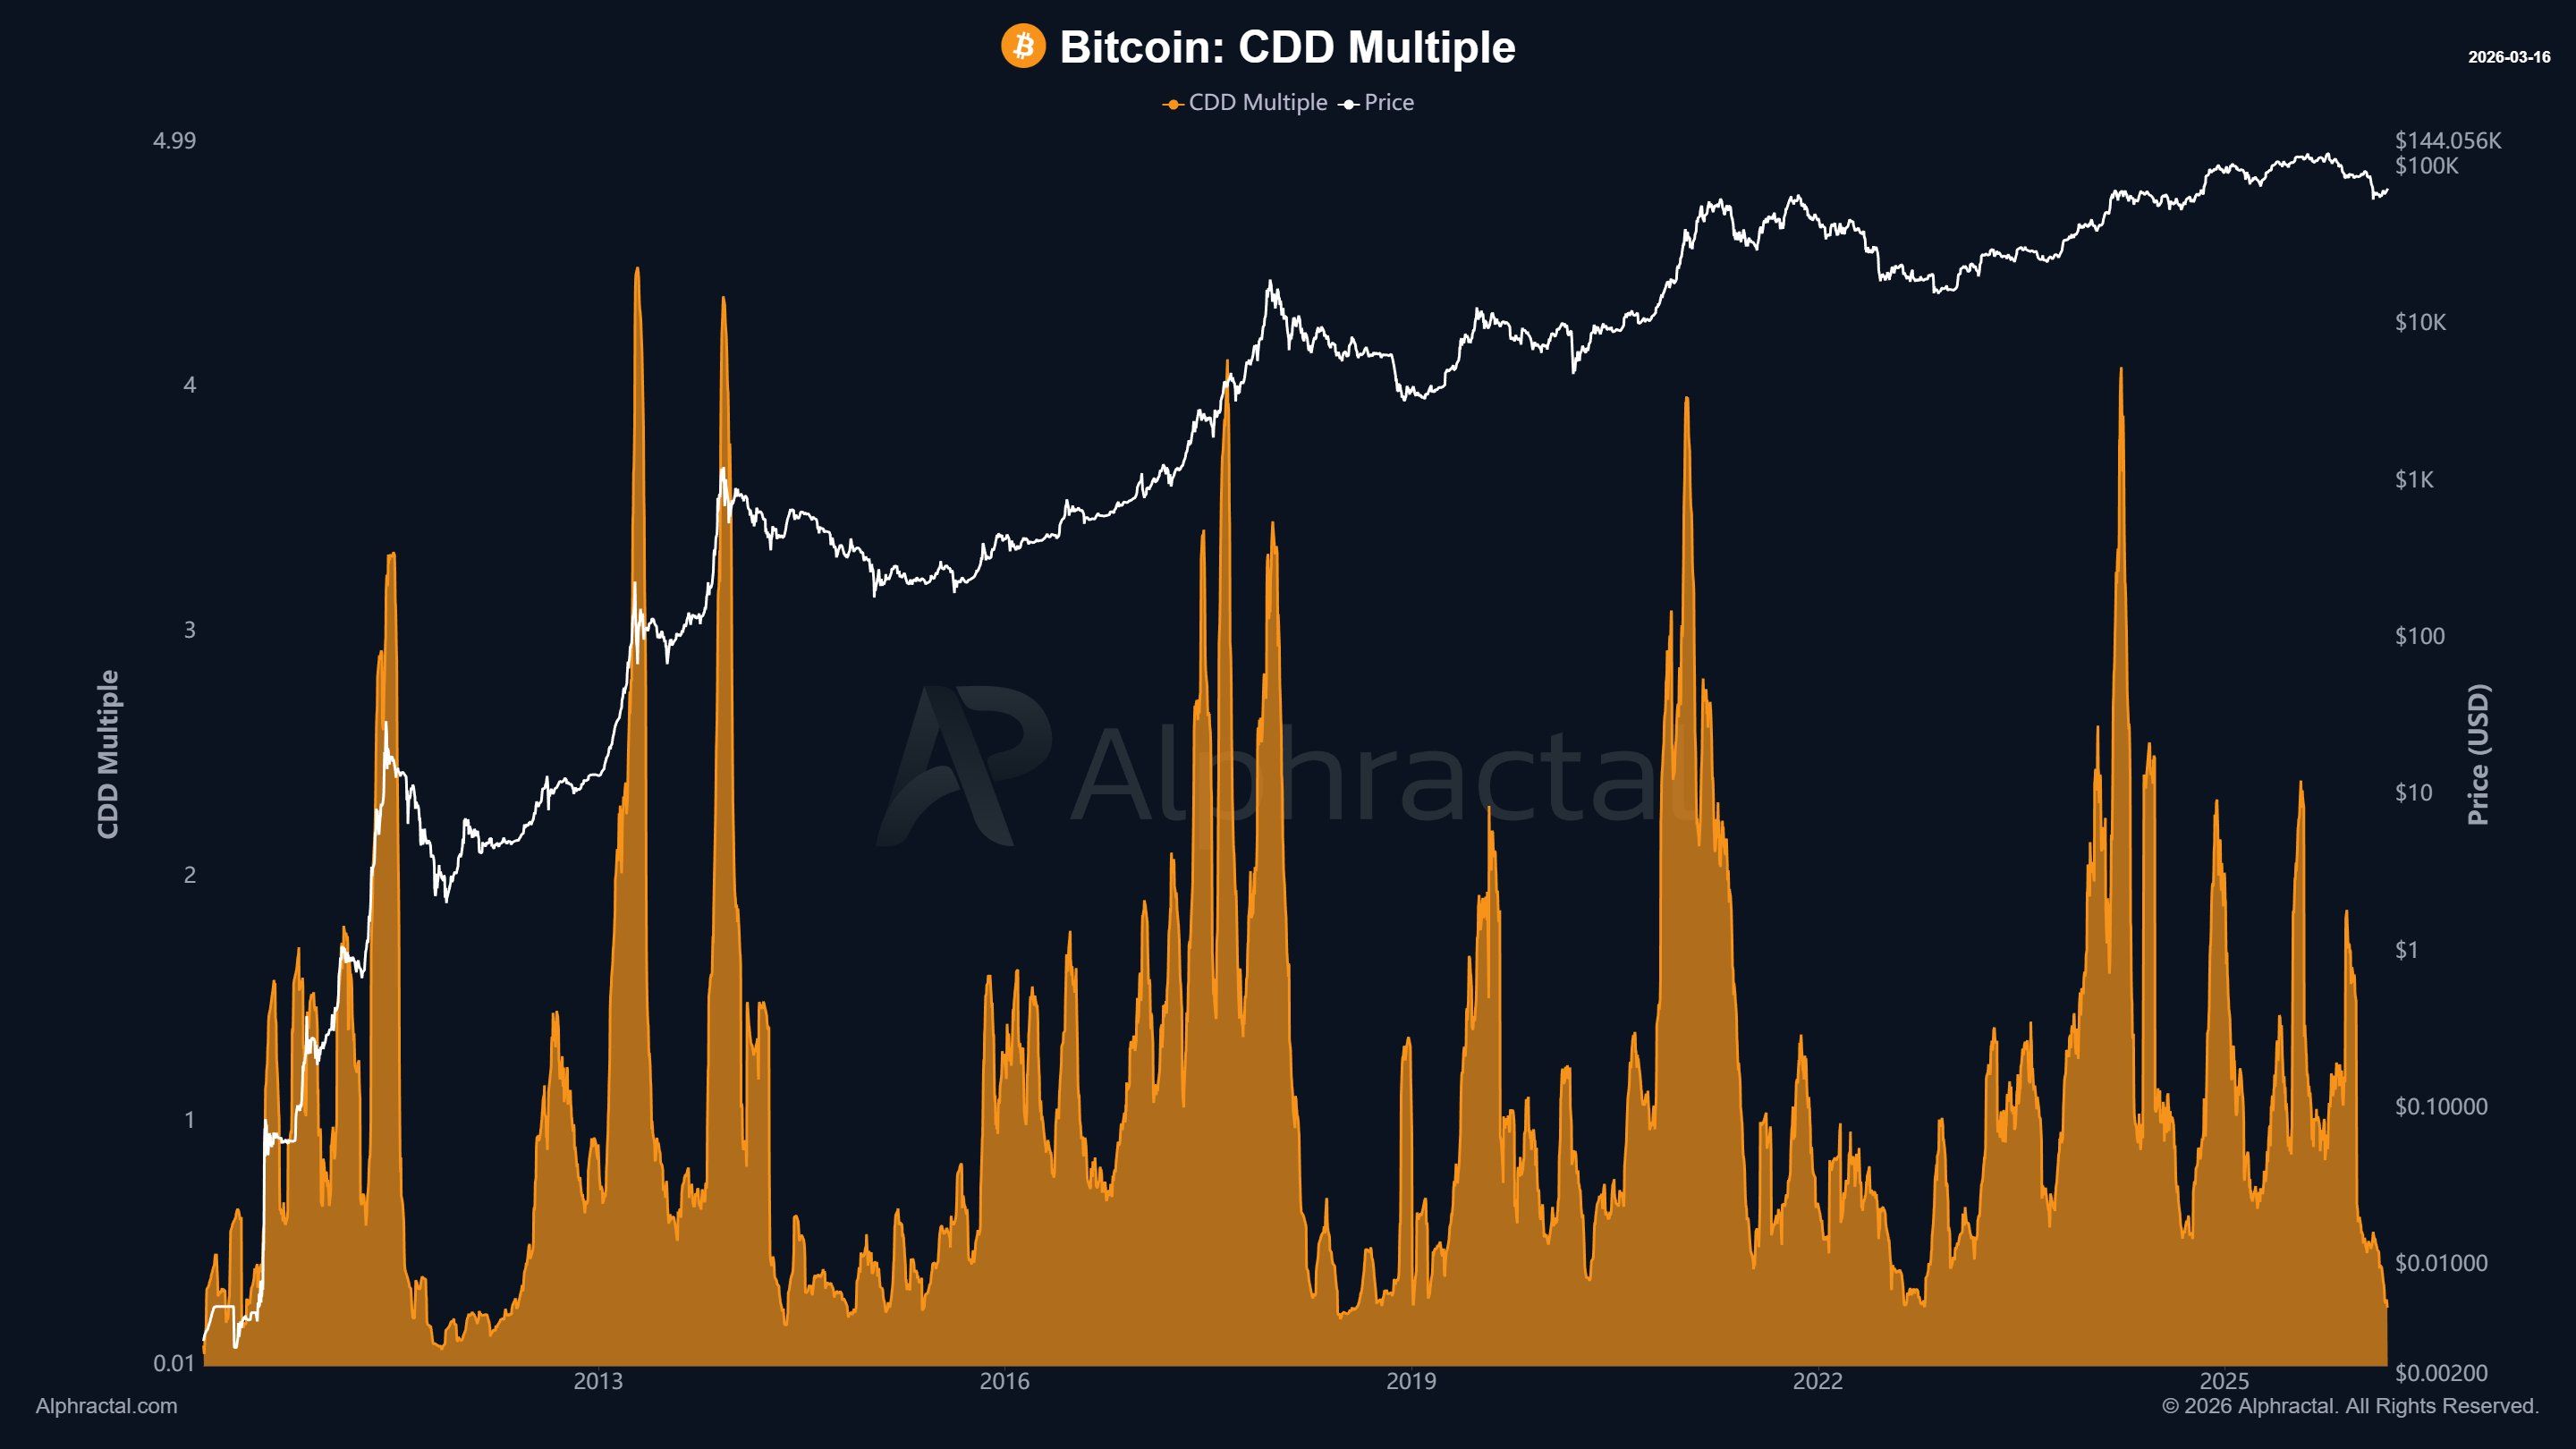
At the same time, the CDD Multiple (Coin Days Destroyed Multiple) has dropped to its lowest level since 2022. This trend shows that long-term holders (LTHs) are holding older coins tightly and reducing selling pressure from long-dormant supply.
“CDD Multiple signals strong long-term holder conviction… Historically, these periods often happen during consolidation phases before the next major move,” Alphractal commented.
Overall, the combination of improving internal dynamics and Bitcoin’s strong performance during geopolitical instability strengthens the hypothesis that Bitcoin is benefiting from a shift in capital flows.
History is placing Bitcoin in a rare test of resilience during political turmoil. In 2026, Bitcoin may face a unique opportunity to demonstrate its ability to store value—an issue that has remained widely debated throughout Bitcoin’s history.
The post Bitcoin Outperforms Gold and Stocks: Is Capital Rotating? appeared first on BeInCrypto.
