


 7
7
Bitcoin rebounds after recent weakness, with improving momentum, and an analyst predicting a potential breakout.
The daily chart shows Bitcoin ($BTC) trading around $69,188, posting a 1.9% gain over the past 24 hours after recovering from an earlier dip near $66,300. The price initially declined during the session but quickly stabilized as buyers stepped in, creating a steady upward move. This recovery pushed $BTC back toward the upper end of the daily range, briefly approaching the $69,700 resistance.
The data also highlights Bitcoin’s strong market position, with a market cap of about $1.38 trillion and 24-hour trading volume exceeding $57 billion. Price action currently sits within a $66,000–$69,700 range, where the lower zone acts as support while the $69,500–$70,000 area remains immediate resistance. Sustained strength above $68,000 could support another test of the $70,000 level, while rejection may lead to continued consolidation.
Can Bitcoin Test $70,000
The daily chart shows Bitcoin attempting to reverse after a sharp correction that pushed the price briefly toward the $60,000–$62,000 region. Recent candles indicate a gradual recovery phase, with $BTC preparing to test the $70,000 area, suggesting improving short-term momentum. The Balance of Power indicator near 0.69 also signals that buyers currently hold a slight advantage, supporting the ongoing rebound.
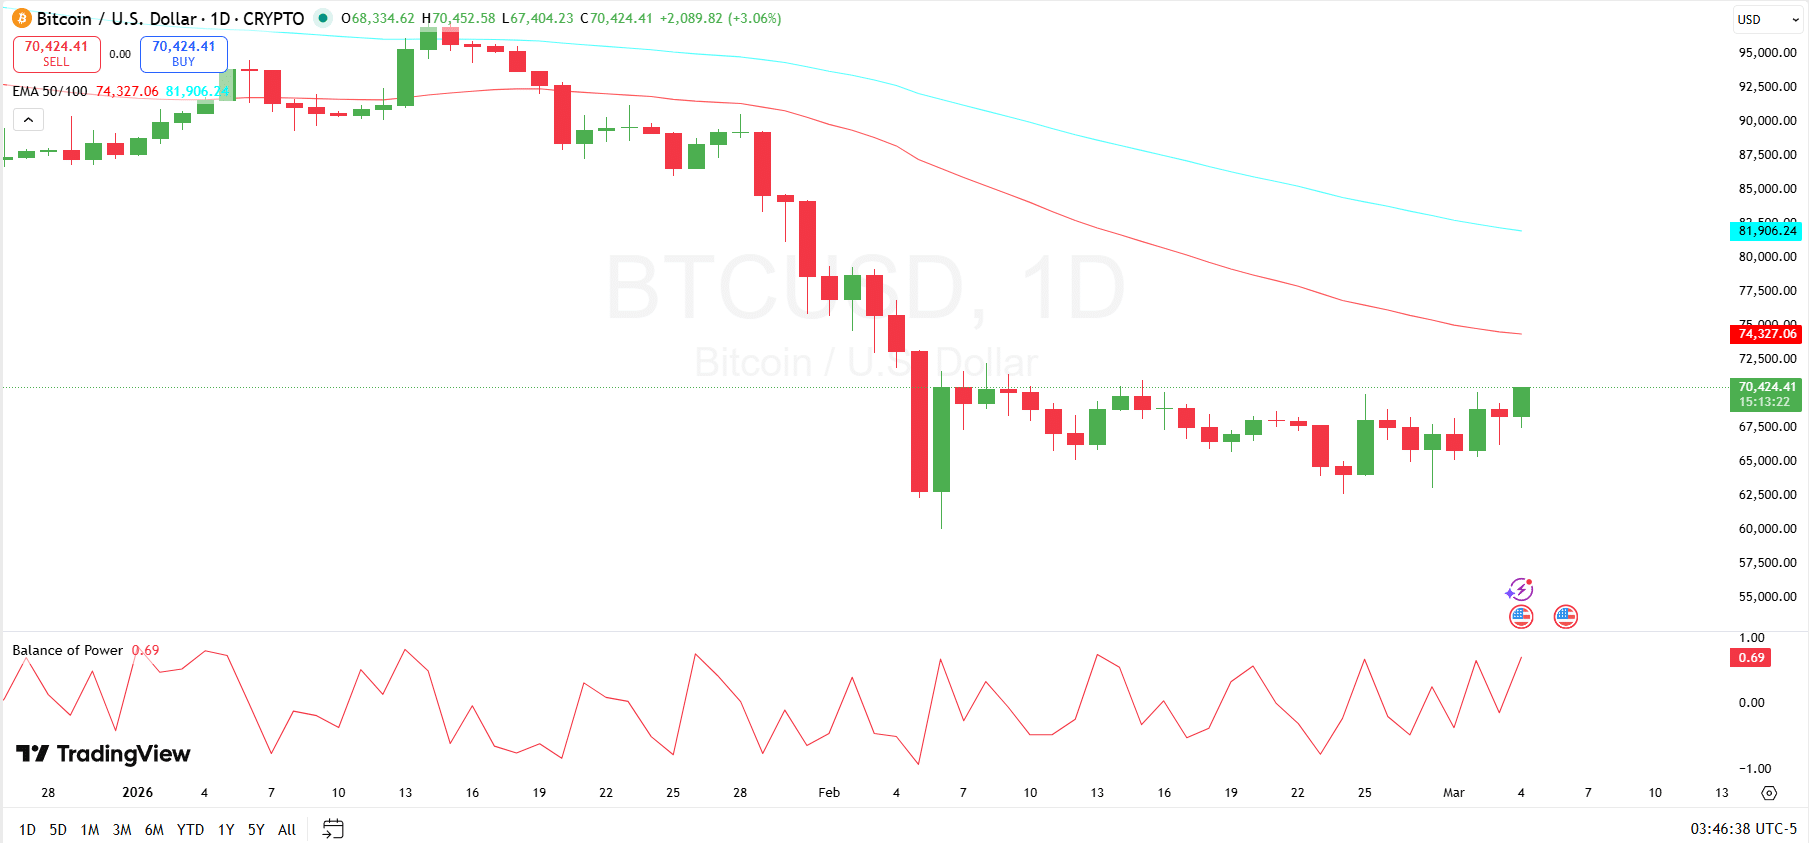
From a technical perspective, immediate support appears around $66,000–$67,000, a zone that held during the recent consolidation phase. A stronger support base sits near $62,000, which marked the lowest point of the recent selloff.
On the upside, resistance is emerging around $72,000, while stronger roadblock aligns with the 50-day EMA near $74,327. A sustained break above that level could shift momentum toward the $80,000 region, where the 200-day EMA around $81,900 represents the next major technical barrier.
Bitcoin Printing Today?
Elsewhere, crypto analyst Crypto Tony shared a bullish update on Bitcoin, noting that $BTC is “printing today” as the asset pushes higher on the hourly chart. The chart shows Bitcoin climbing after a strong impulsive move that broke above the $69,700 resistance zone, a level that previously capped several intraday attempts.

From a technical perspective, the $69,500–$69,700 area now acts as immediate support, with price potentially retesting this level before continuing upward. If Bitcoin holds above this zone, the next resistance target appears near $71,800–$72,000, as highlighted on the chart.