


 9
9
Bitcoin price retreated by over 2.50% on Tuesday, erasing some of the gains made on Monday. It dropped to $67,000, and could be at risk of falling to $50,000 as the US dollar and crude oil prices surge.
- Bitcoin price retreated by over 2.50% on Tuesday, erasing the gains made on Monday.
- The coin retreated as the US dollar and bond yields rose.
- Crude oil prices continued rising as the war in Ukraine continued.
US dollar and crude oil surge amid risks of a prolonged war
Bitcoin ($BTC) price has sunk into a technical bear market, a trend that may continue in the foreseeable future. The US Dollar Index jumped to $99.38, its highest level since January this year. It has soared by over 3.8% from its lowest level in January.
Crude oil prices have continued rising, with Brent jumping to $84 and the West Texas Intermediate hitting $76. Oil was trading at $55 earlier this year, and analysts believe that the uptrend will continue as the war in Iran accelerates.
Therefore, the implication is that the Federal Reserve will find it difficult to cut interest rates as inflation continues rising. A report released last week showed that the Producer Price Index held steady in February, a trend that may continue this year.
The bond market is sending signals that the Fed may hold rates steady. For example, the 10-year yield rose by 1.33% to 4.105%, while the 30-year jumped to 4.70%. This mirrors the performance in key prediction markets, with most traders expecting it to cut rates two times this year.
Bitcoin price often retreats when the US dollar index is in a strong uptrend and when the Fed is embracing a more hawkish tone.
Meanwhile, data compiled by CoinGlass shows that the futures open interest dropped to over $43 billion, down sharply from last year’s high of over $95 billion.
Bitcoin price prediction: technical analysis
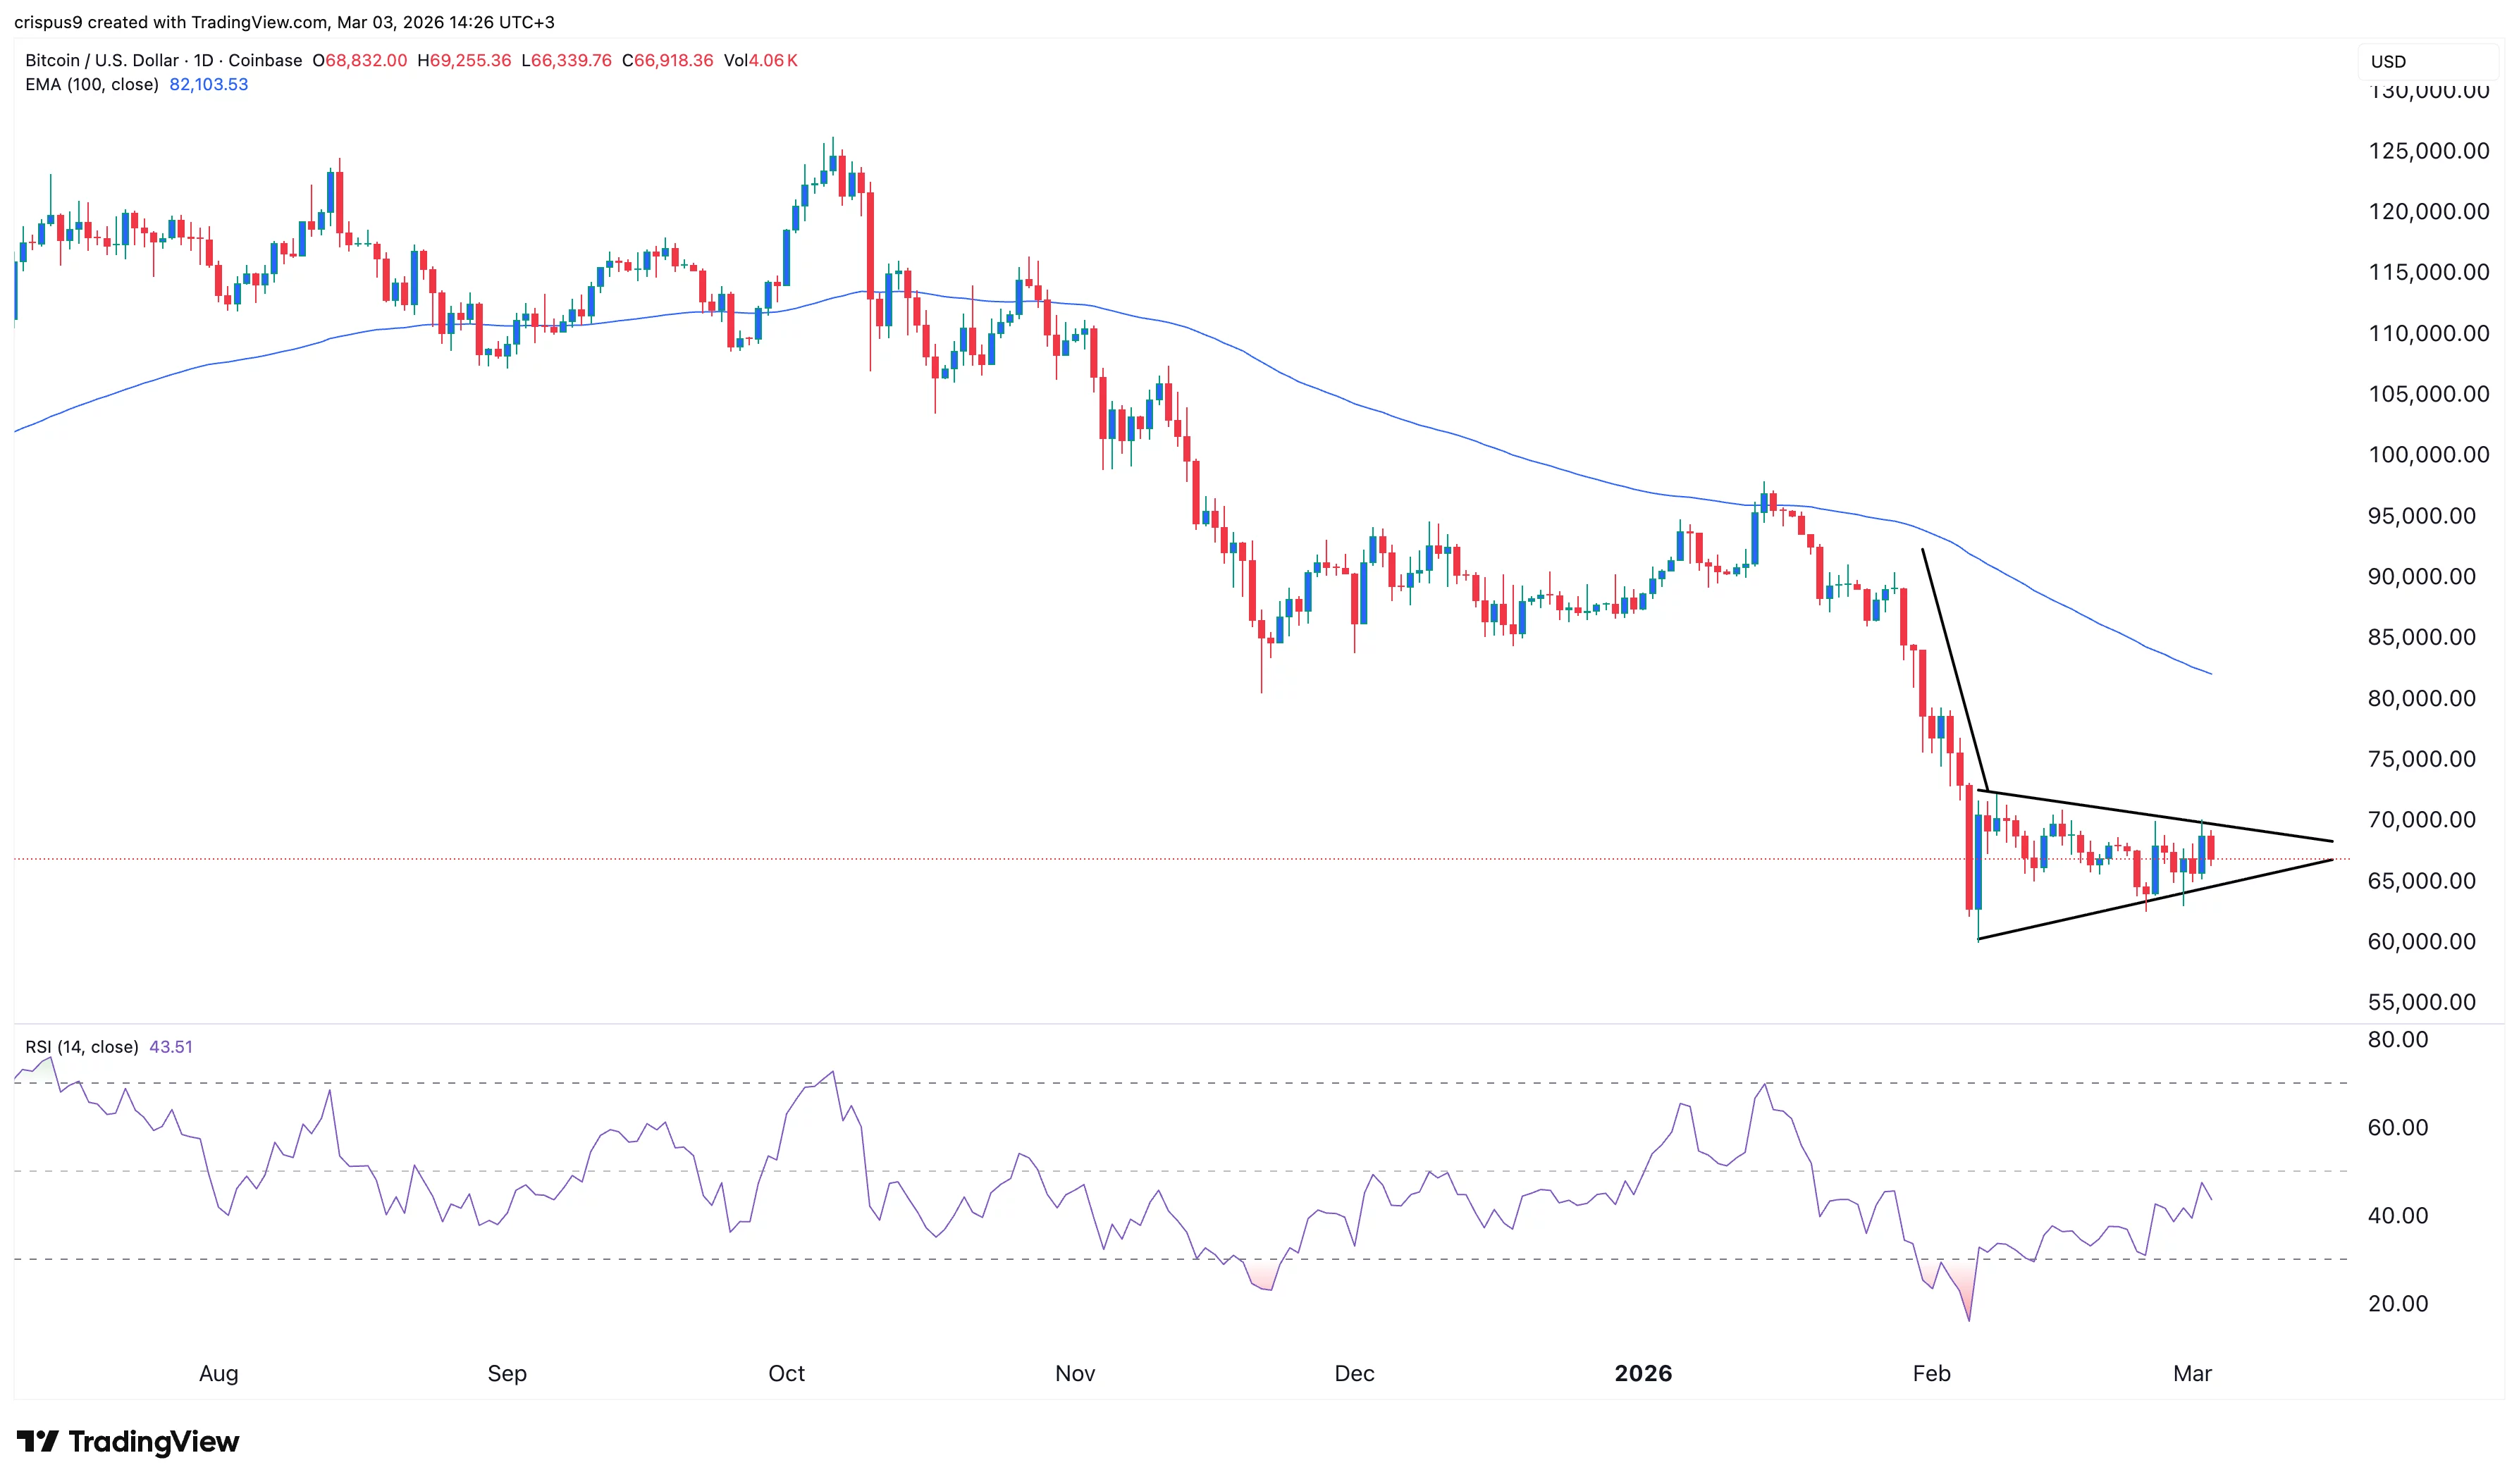
The daily chart reveals that the $BTC price has sold off since October last year. It has stayed below the 50-day moving average and the Supertrend indicators. That is a sign that bears remain in control.
The coin has also formed a bearish pennant pattern, which normally leads to more downside, potentially to the year-to-date low of $60,000. A drop below that level will signal more downside to the psychological level at $50,000.
On the positive side, the reversal may happen soon if there are signs of a ceasefire happening in the Middle East.
