


 7
7
Bitcoin ($BTC) is currently trading near $66,425, reflecting a market in post-impulse consolidation. The cryptocurrency recently surged from $62,500 to test $70,000 before entering a range-bound phase.
Traders are closely monitoring the $66,200 pivot, as holding this level maintains short-term bullish potential. Meanwhile, failure to sustain above it could lead to deeper retracements toward $65,400 or lower. This phase indicates the market is digesting recent gains while participants assess momentum direction.
Key Levels Shape Short-Term Outlook
Immediate resistance sits at $67,450–$67,500, a level that has seen multiple rejections. Beyond that, the $68,400–$68,500 range aligns with the 0.786 Fibonacci level, offering the next potential hurdle. A clean break above $70,000 would confirm renewed bullish momentum and broader trend continuation.
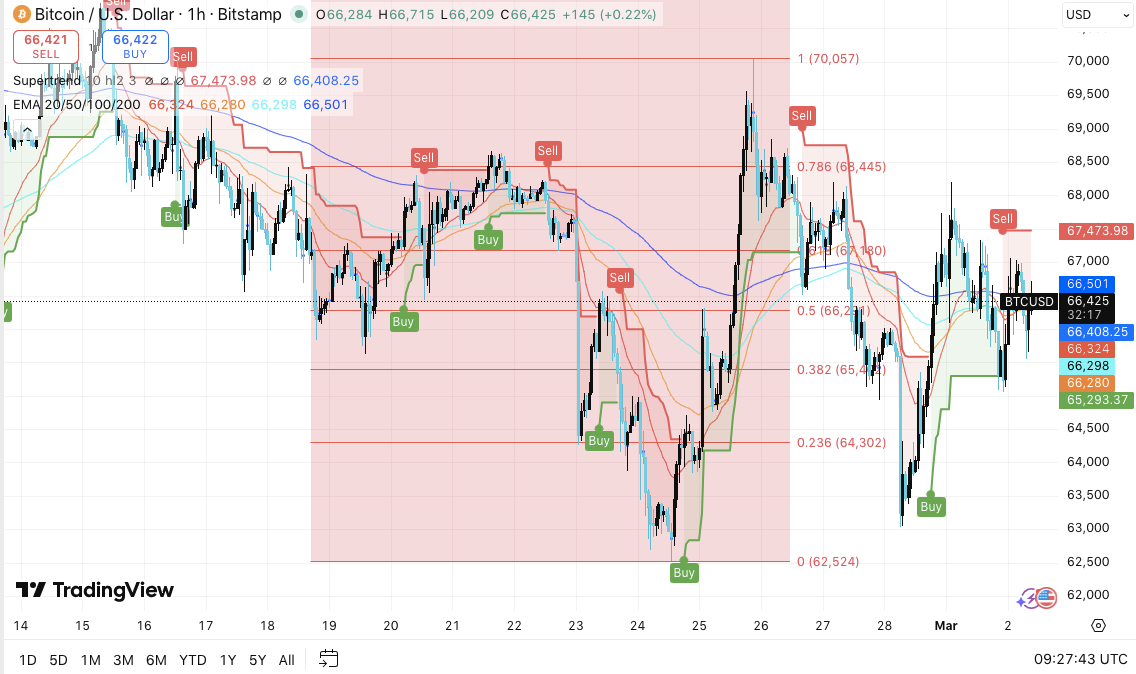
On the downside, support is layered. The $66,200–$66,300 range combines the 0.5 Fibonacci retracement with the 200 EMA, creating a critical pivot zone.
Related: Ethereum Price Prediction: ETH Enters Compression Phase While Open Interest Stabilizes
Further support lies at $65,400–$65,500 and $64,300, with the recent swing low near $62,500 acting as major defense. Price behavior around these levels will likely dictate the next directional bias.
Market Metrics Highlight Speculative Activity
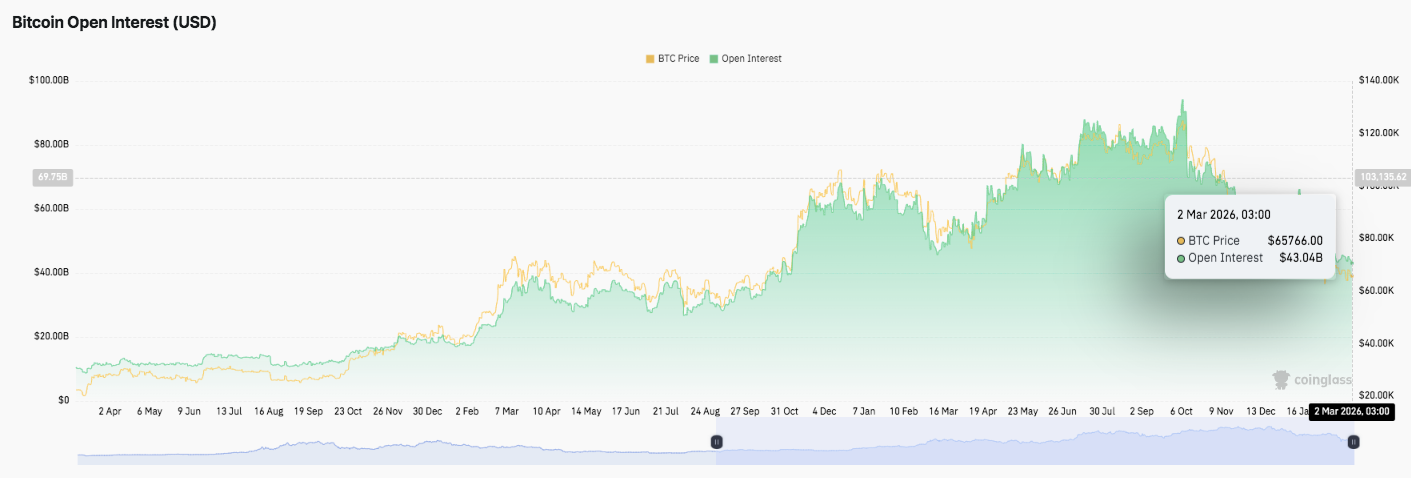
Bitcoin derivatives show increasing open interest, particularly during strong upward moves. Open interest initially grew gradually, reflecting cautious leveraged activity.
However, as price rallied, speculative positions expanded sharply, peaking near record highs. Recent price consolidation prompted partial unwinding, dropping open interest to around $43 billion, though levels remain structurally elevated compared to earlier cycles.
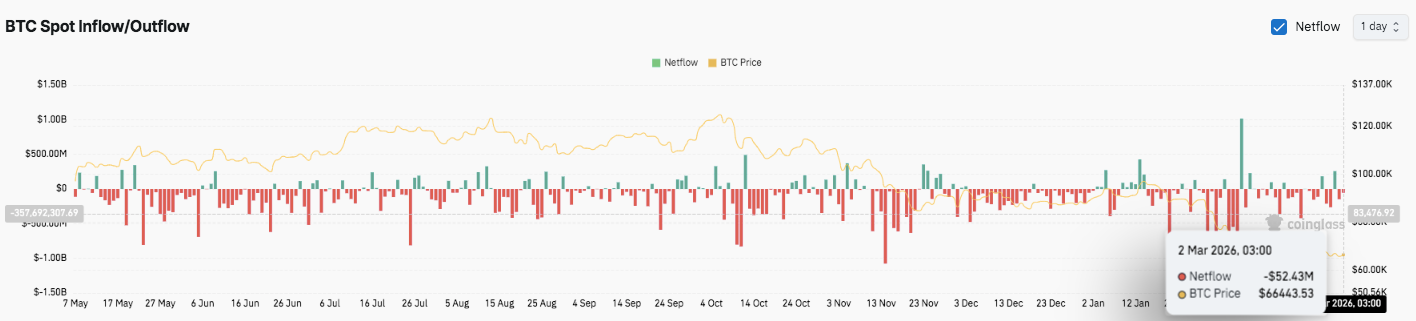
Spot flows reinforce this narrative. $BTC netflows have stayed predominantly negative from May through early March, highlighting sustained withdrawals from exchanges.
Related: XRP Price Prediction: March Averages Negative – Can Bulls Defy The Pattern?
Periodic inflows, noted in July, October, November, and January, were minor compared to larger outflow clusters. These movements suggest ongoing accumulation and reduced circulating supply despite short-term volatility.
Technical Outlook for Bitcoin Price
Key levels remain well-defined heading into March:
Upside levels: $67,450–$67,500, $68,400–$68,500, and $69,500–$70,000 act as immediate resistance zones. A decisive break above $67,500 could trigger momentum expansion toward $68,500, while surpassing $70,000 would confirm a broader bullish trend.
Downside levels: $66,200–$66,300 (0.5 Fib + EMA cluster) serves as the primary support. Additional supports are $65,400–$65,500 and $64,300, with $62,500 marking a major swing low. A loss of $66,200 risks exposing $BTC to deeper corrective moves.
Resistance ceiling: $70,000 is the key level to flip for medium-term bullish conviction. Until this level is cleared, $BTC remains range-bound between $65,400 and $67,500.
The technical picture suggests $BTC is compressing after a strong impulsive rally from $62,500 to $70,000. The market is currently in post-impulse consolidation, forming a neutral-to-slightly-bullish pattern near mid-range Fibonacci levels. Momentum has slowed, while multiple recent sell signals around $67,450 confirm short-term supply pressure.
Will Bitcoin Move Higher?
Bitcoin’s near-term trajectory depends on whether buyers can defend $66,200 to maintain a constructive structure. Holding this pivot could lead to a breakout attempt toward $67,500–$68,500. Stronger inflows and derivative activity may support higher levels, potentially targeting $69,500–$70,000.
However, failure to defend $66,200 could break the consolidation base, increasing the probability of a pullback toward $65,400 or $64,300. Exchange outflows and open interest trends indicate that while speculative positioning remains elevated, recent deleveraging could temper short-term upside.
For now, $BTC sits in a critical zone, balancing between range-bound consolidation and the next leg higher. Market conviction, inflows, and the response at key resistance levels will ultimately determine whether the cryptocurrency resumes its bullish trend or extends corrective pressure.
Related: Hyperliquid Price Prediction: Can HYPE Reclaim $32.73 After Trend Slowdown?
Disclaimer: The information presented in this article is for informational and educational purposes only. The article does not constitute financial advice or advice of any kind. Coin Edition is not responsible for any losses incurred as a result of the utilization of content, products, or services mentioned. Readers are advised to exercise caution before taking any action related to the company.

