


 7
7
Bitcoin continues to struggle to push decisively above the $66,000 level as persistent selling pressure weighs on sentiment across the crypto market. Despite intermittent rebound attempts, momentum remains weak, with buyers showing limited conviction while volatility stays elevated. The broader environment — shaped by cautious liquidity conditions, macro uncertainty, and restrained risk appetite — has kept Bitcoin locked in a consolidation phase rather than a sustained recovery trend.
Increasingly, Bitcoin is not behaving like “digital gold,” a narrative that dominated market discourse for years. Instead of acting as a defensive asset during periods of economic stress, Bitcoin has recently traded in closer alignment with equity markets, particularly technology stocks. This correlation suggests that capital is treating Bitcoin more as a high-beta risk asset than as a store of value comparable to precious metals.
This shift challenges a long-standing thesis within the crypto ecosystem. While the digital gold narrative remains influential, current price behavior indicates that liquidity cycles, institutional positioning, and broader macro risk dynamics are exerting stronger short-term influence. Whether Bitcoin eventually reclaims its perceived safe-haven role or continues behaving like a risk asset will likely depend on evolving macro conditions and investor positioning.
Correlation With Nasdaq Highlights Structural Shift
According to On-Chain Mind, Bitcoin’s correlation with the Nasdaq has structurally tightened since 2020, marking a significant shift in how capital allocates to the asset. While earlier cycles showed more episodic alignment, recent data reveals that $BTC now frequently trades in tandem with technology equities. Notably, the sharpest correlation spikes have tended to coincide with broader market drawdowns, particularly during bear market phases.
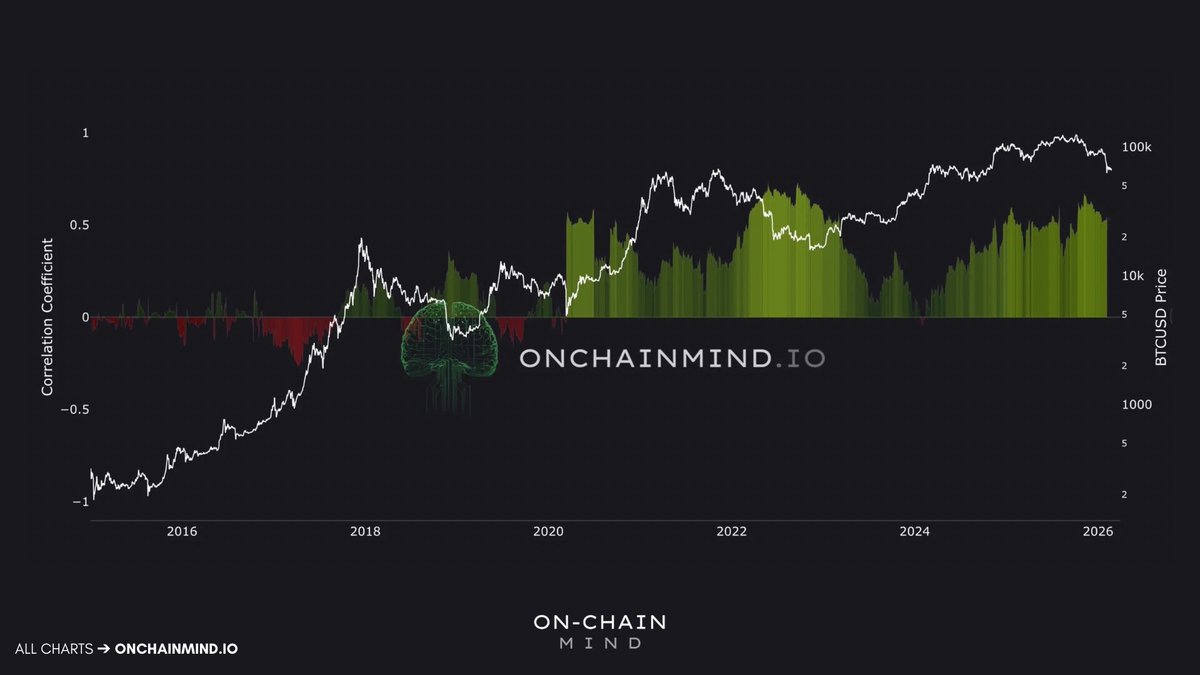
This pattern is critical. In theory, an asset positioned as “digital gold” would be expected to decorrelate from risk assets during periods of stress. Instead, the data suggests the opposite: when liquidity contracts and equities sell off, Bitcoin often follows. These synchronized declines indicate that institutional capital increasingly treats $BTC as part of the broader risk complex rather than as an independent hedge.
Whether this development aligns with ideological expectations is secondary. The reality is that capital flows, portfolio construction frameworks, and macro-driven positioning now play a dominant role in Bitcoin’s price formation. Large allocators appear to manage $BTC exposure alongside growth equities, responding to the same liquidity signals, rate expectations, and volatility regimes.
Until correlation regimes shift meaningfully, Bitcoin’s behavior is likely to remain closely tied to macro risk cycles rather than to traditional safe-haven dynamics.
Bitcoin Price Structure Shows Persistent Downtrend Pressure
Bitcoin continues to trade under clear technical pressure, with price action struggling to reclaim the $66,000–$67,000 zone after a sharp corrective move from late-2025 highs. The weekly chart shows a decisive break below the 50-week moving average, followed by rejection near that level, which now acts as dynamic resistance rather than support. This shift typically reflects weakening medium-term momentum.
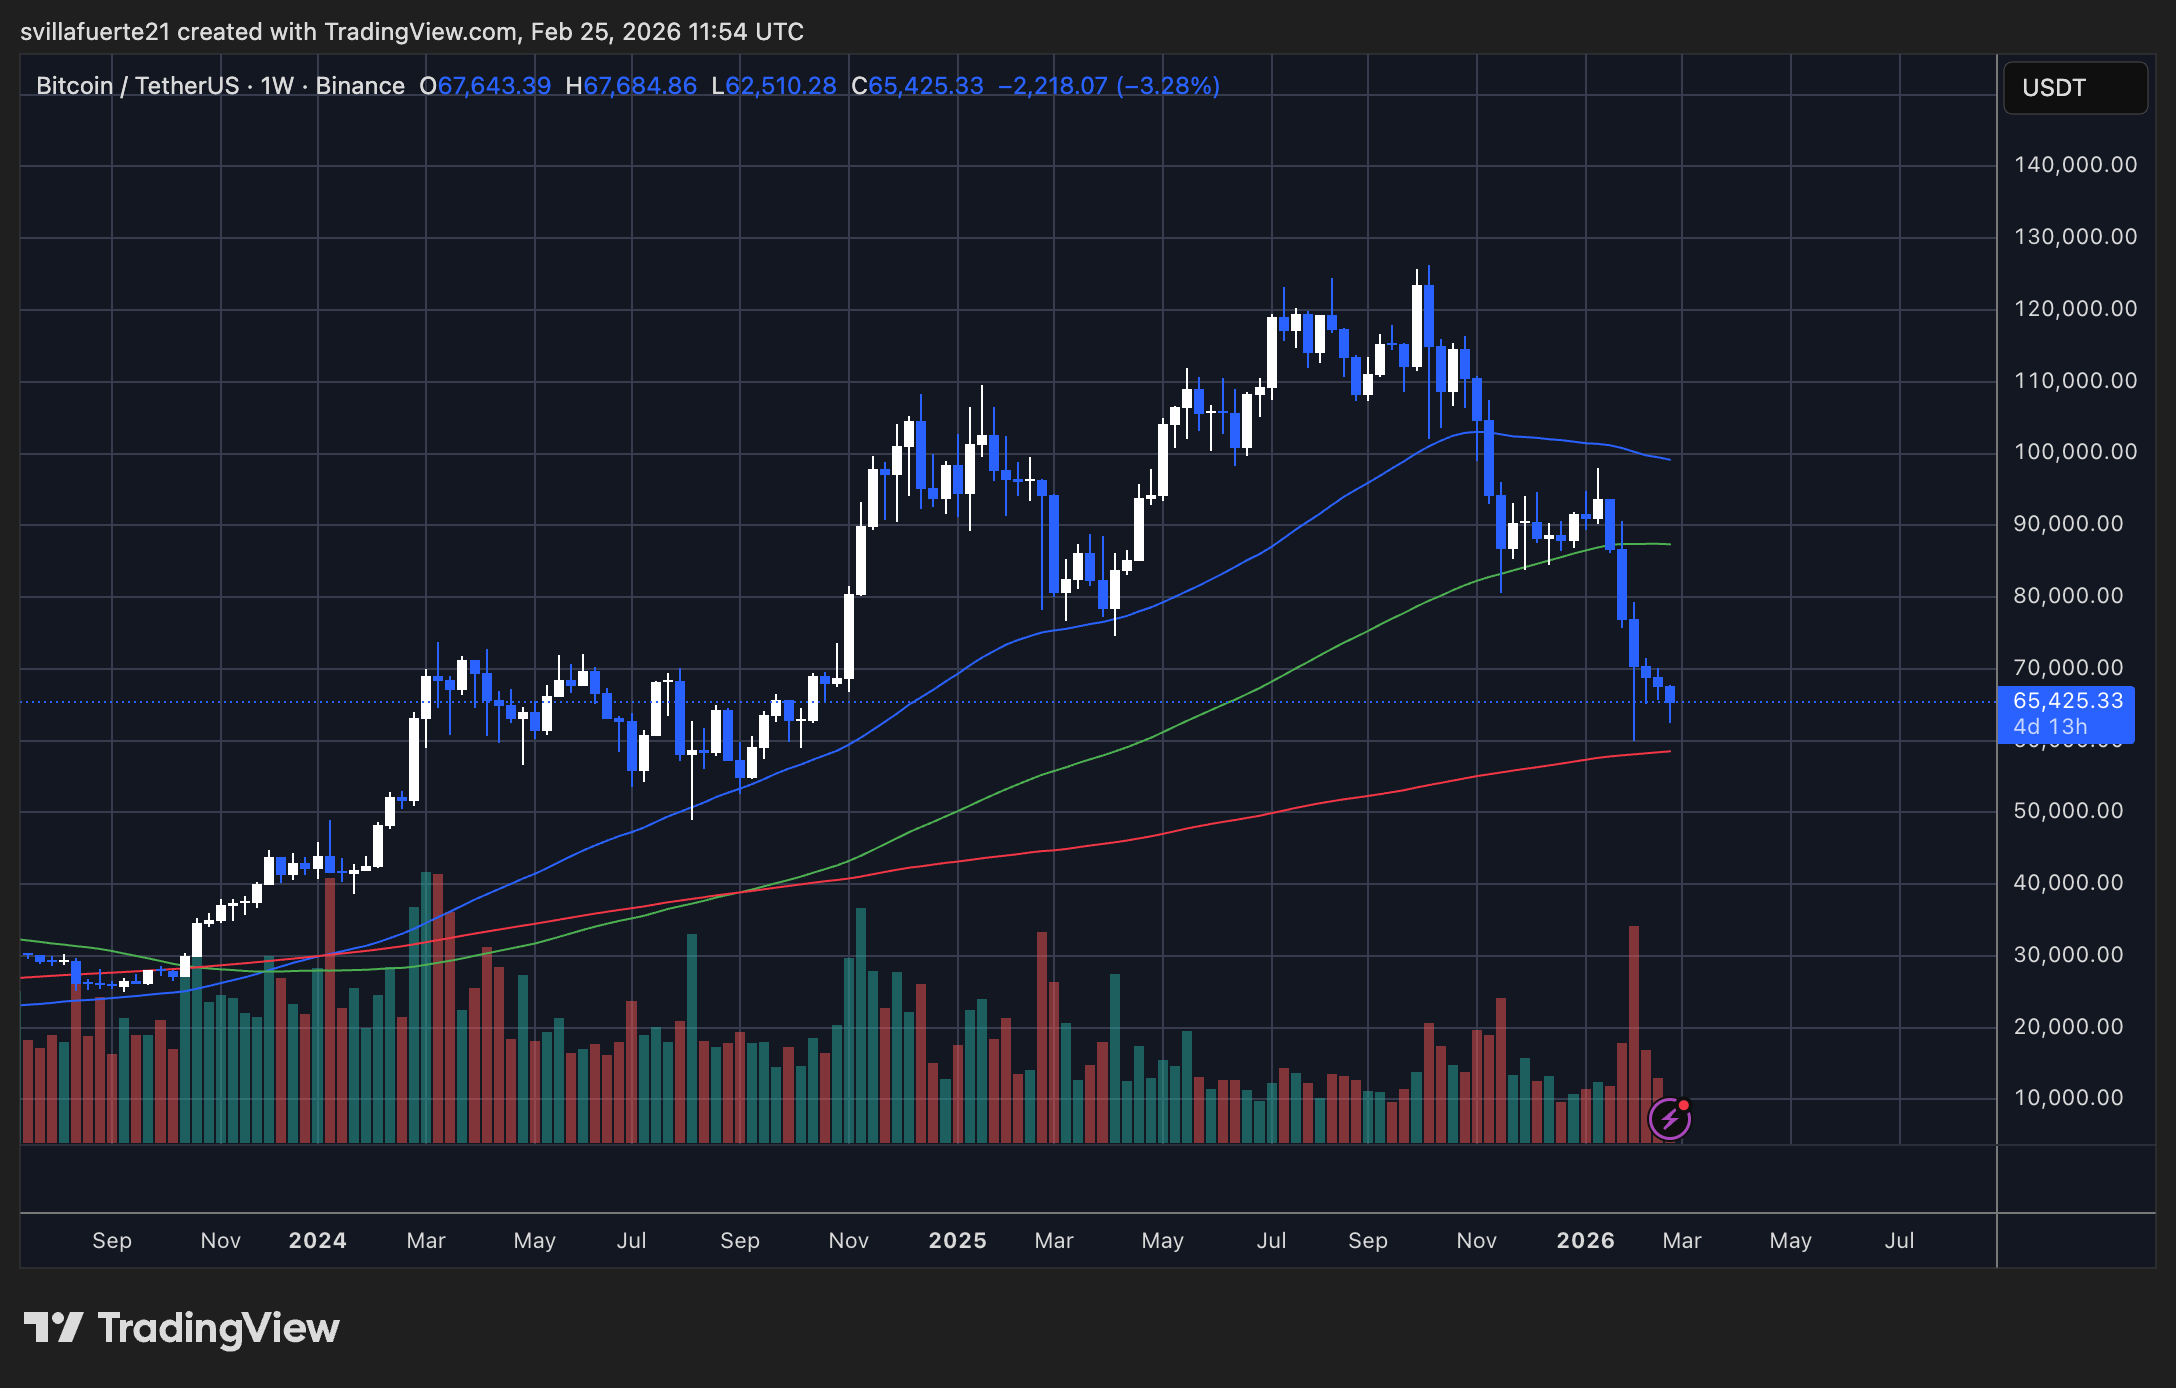
Price is currently hovering just above the 200-week moving average, a level historically associated with major cycle support. While this area often attracts strategic buyers, repeated tests without strong rebounds can weaken its effectiveness. Volume spikes during recent downside moves suggest distribution rather than accumulation, although confirmation would require sustained follow-through.
Market structure also shows a sequence of lower highs since the peak near the $120K region, indicating that bullish continuation has stalled. Until Bitcoin reclaims the mid-$70K range and stabilizes above key moving averages, rallies may remain corrective rather than trend-reversing.
That said, proximity to long-term support means volatility could increase. Either a structural rebound or a deeper capitulation phase remains possible, depending largely on liquidity conditions, macro sentiment, and institutional positioning in the coming weeks.
Featured image from ChatGPT, chart from TradingView.com