


 4
4
Bitcoin trades near $65,500 as traders assess whether the recent rebound marks stability or another pause before decline. The cryptocurrency remains under pressure after a sharp rejection near $90,000 triggered a broad corrective phase.
Price action on the four-hour chart shows consolidation rather than recovery. Consequently, market participants now focus on whether Bitcoin can defend its recent base above $60,000.
Technical Structure Signals Compression
Bitcoin rebounded from the $60,100 macro swing low and formed a short-term base. However, upside momentum remains limited below key retracement levels.
The 0.236 and 0.382 Fibonacci zones continue to cap bullish attempts. Besides, the Donchian Channel has flattened, which signals volatility compression.
ADX readings hover near 20, confirming a weak trend environment. This setup reflects indecision rather than strong accumulation.
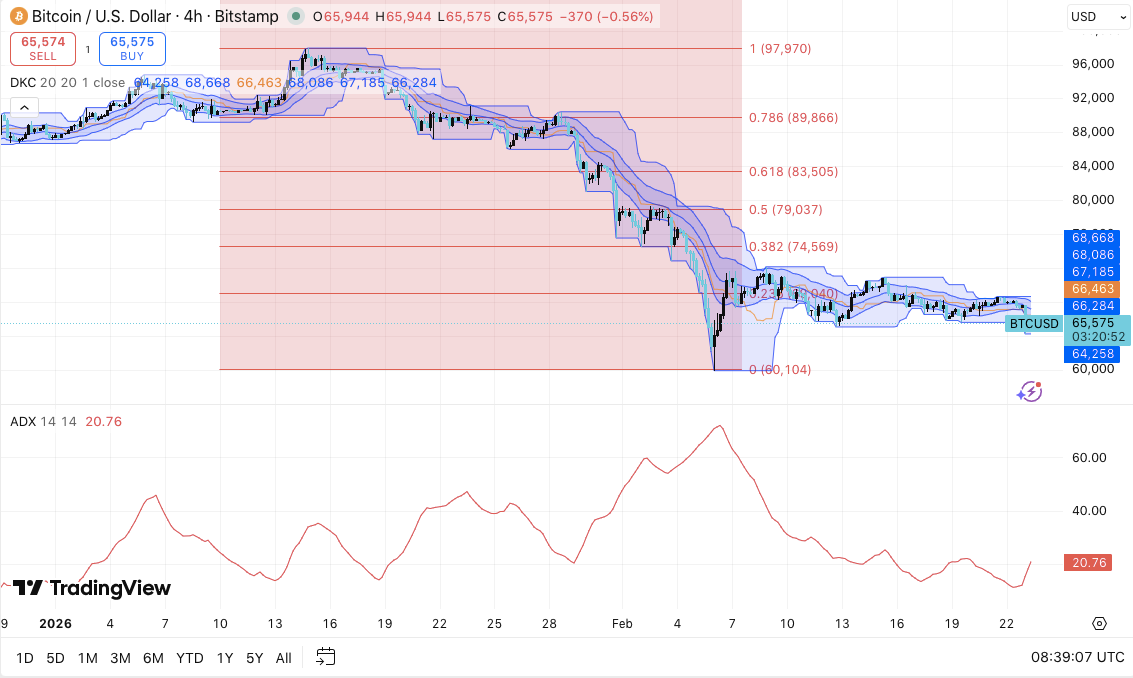
Additionally, Bitcoin trades below the $66,400–$68,600 resistance cluster. That range aligns with the Donchian mid and upper bands. A sustained move above $68,600 could open room toward $70,400.
Related: Ethereum Price Prediction: ETH Range Tightens After $60B Flush
However, failure to hold $64,200 would likely expose $62,000 support. If selling intensifies, price could revisit the $60,100 macro low. Consequently, Bitcoin remains range-bound within a broader retracement unless it reclaims $70,400 decisively.
Derivatives Market Shows Deleveraging
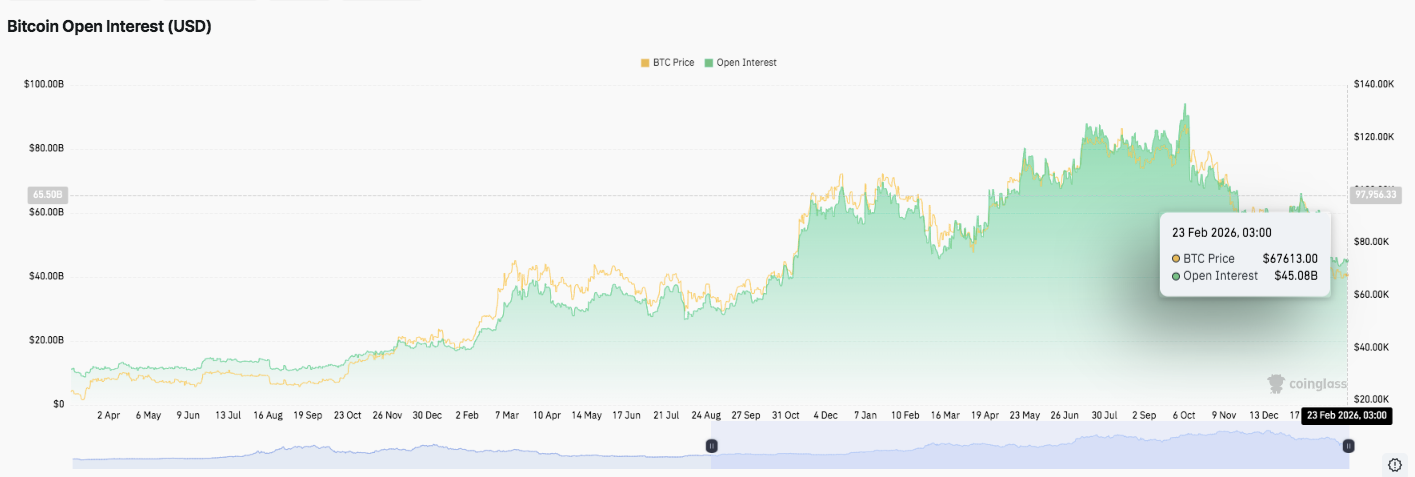
Open interest data highlights a clear shift in derivatives positioning. During Bitcoin’s rally toward six figures, open interest surged from below $15 billion to nearly $90 billion. Each breakout coincided with aggressive leveraged long exposure.
Significantly, recent figures show a contraction toward the $45 billion region. This decline reflects position unwinding and liquidations as price retraced into the mid-$60,000 zone. Moreover, the drop in open interest suggests traders now reduce speculative risk. The cooling derivatives market contrasts sharply with the prior leverage-driven expansion.
Spot Flows Reveal Distribution Bias
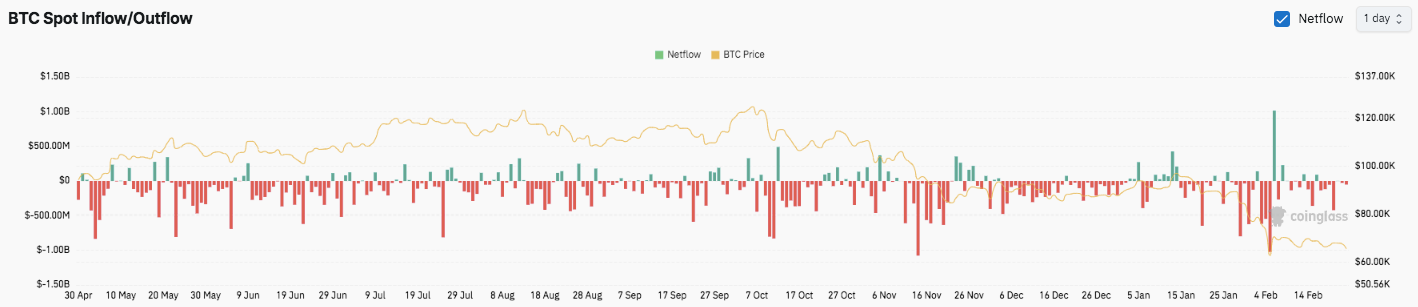
Spot exchange data reinforces caution. Persistent net outflows dominated from May through November. Several sessions recorded exchange deposits exceeding negative $800 million. Such flows often align with heightened sell-side activity.
Although short-lived inflow spikes appeared in late October and early January, they failed to reverse the broader trend. Additionally, early February showed a brief $1 billion positive spike. That move suggested temporary accumulation or repositioning. However, outflows resumed quickly afterward.
Related: XRP Price Prediction: Bulls Eye $1.47 Reclaim After Historic Loss Spike
Hence, distribution phases continue to outweigh sustained accumulation. Volatility clusters closely match major price swings. Overall, Bitcoin trades within a compressed range as derivatives exposure declines and spot flows reflect caution.
Technical Outlook For Bitcoin Price
Key levels remain clearly defined as Bitcoin consolidates near the mid-$60,000 region.
- Upside levels: $66,400–$68,600 stands as the first resistance cluster. A clean breakout above this range could open a move toward $70,400. Above that, $74,500 acts as the next major barrier aligned with the 0.382 Fibonacci retracement.
- Downside levels: $64,200 remains immediate range support. Below that, $62,000 offers minor horizontal demand. The macro swing low at $60,100 continues to serve as the structural floor.
- Resistance ceiling: $70,400 is the key level to reclaim for medium-term bullish momentum. A decisive move above this zone would weaken the broader corrective structure and shift sentiment.
The technical picture shows Bitcoin compressing within a tightening range after rejecting from the $89,800–$90,000 region. Donchian Channel flattening signals volatility contraction, while ADX near 20 reflects weak trend strength. This structure often precedes expansion.
Will Bitcoin Go Up?
Bitcoin’s next directional move depends on whether buyers can defend $64,200 long enough to challenge the $68,600–$70,400 resistance band. Sustained strength above $70,400 could extend the recovery toward $74,500 and potentially higher liquidity zones.
However, failure to hold $64,200 would increase downside risk toward $62,000. A break below $60,100 would confirm continuation of the broader bearish retracement.
For now, Bitcoin remains in a pivotal compression phase. Momentum confirmation and volume expansion will determine the next leg.
Related: PIPPIN Price Prediction: Bulls Defend $0.64 as Open Interest Rebuilds
Disclaimer: The information presented in this article is for informational and educational purposes only. The article does not constitute financial advice or advice of any kind. Coin Edition is not responsible for any losses incurred as a result of the utilization of content, products, or services mentioned. Readers are advised to exercise caution before taking any action related to the company.