


 4
4
Bitcoin is trading at $67,411 on Feb. 20, 2026, at 8 a.m. EST, consolidating after a sharp recovery from its recent capitulation low. The broader structure remains corrective, and the burden of proof still rests on bulls to reclaim higher ground.
Bitcoin Chart Outlook
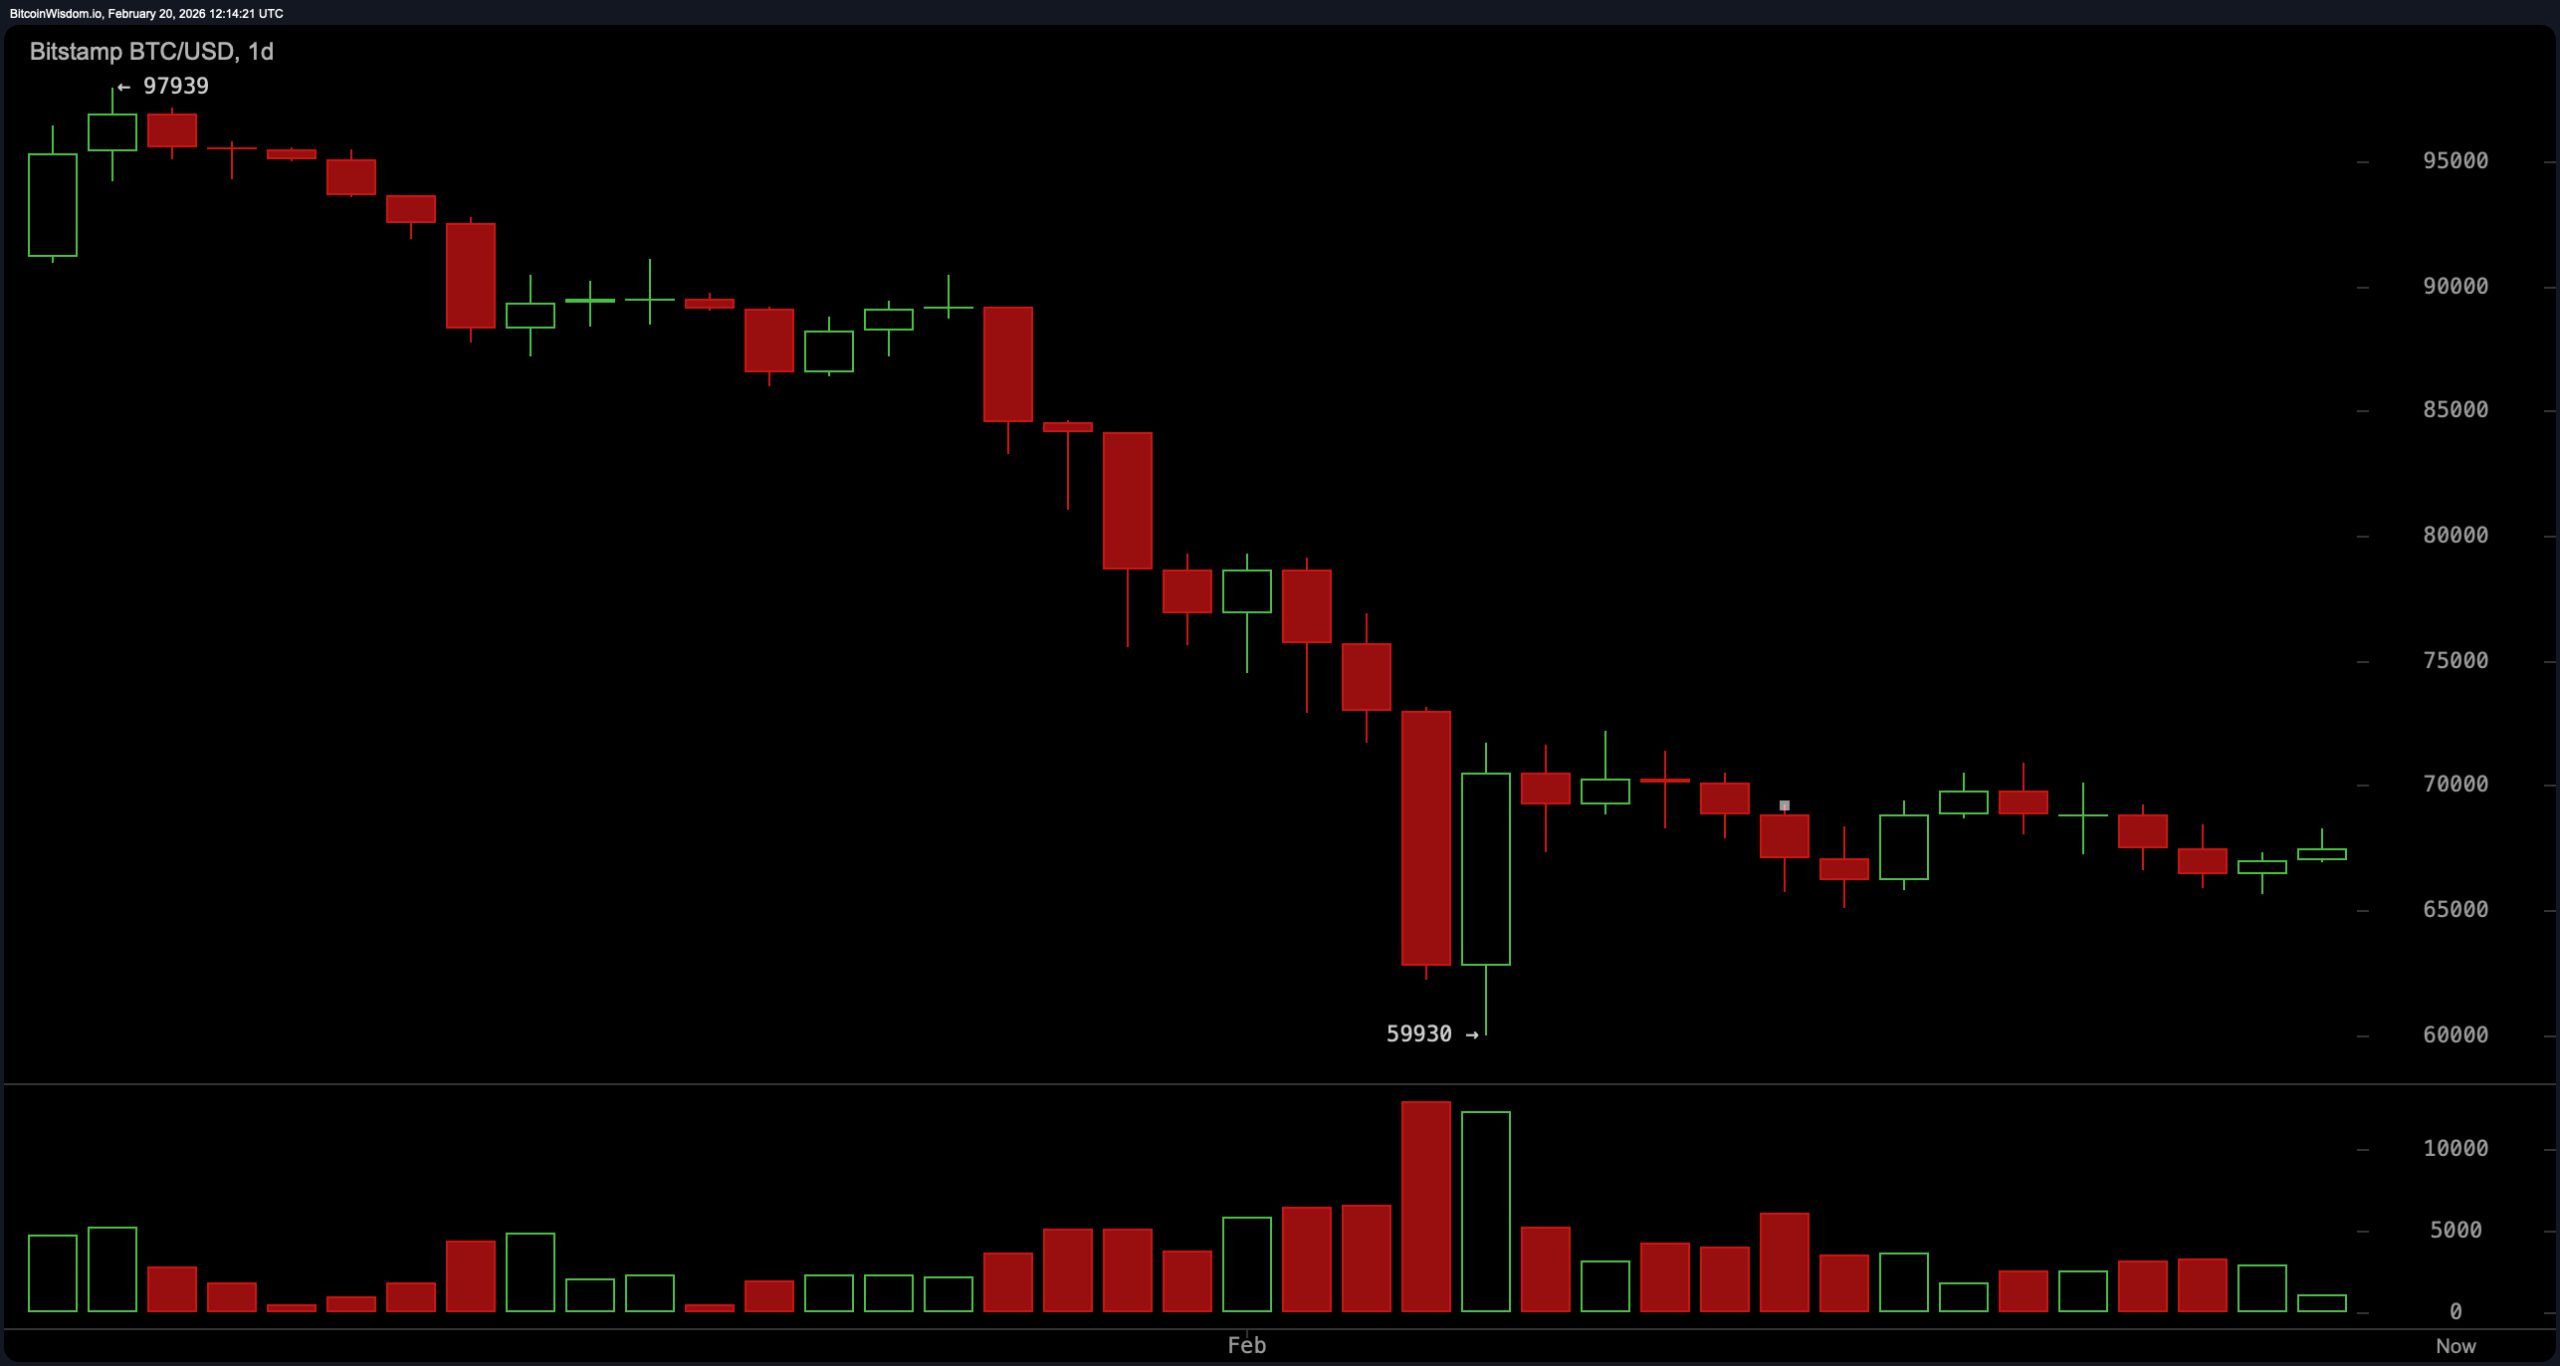
The daily chart tells a disciplined but unforgiving story. Bitcoin remains in a clear downtrend from the roughly $97,000 high to the $59,930 swing low, followed by a sharp bounce on heavy volume into the current $65,000 to $70,000 consolidation band.
Price is pressing against daily resistance between $70,000 and $72,000, while key daily support remains $59,930, with interim footing near $64,000 to $65,000. Structurally, the pattern of lower highs is intact, keeping the higher timeframe bias neutral to bearish unless $72,000 is reclaimed with authority and volume expansion. This is not trend reversal territory — yet.
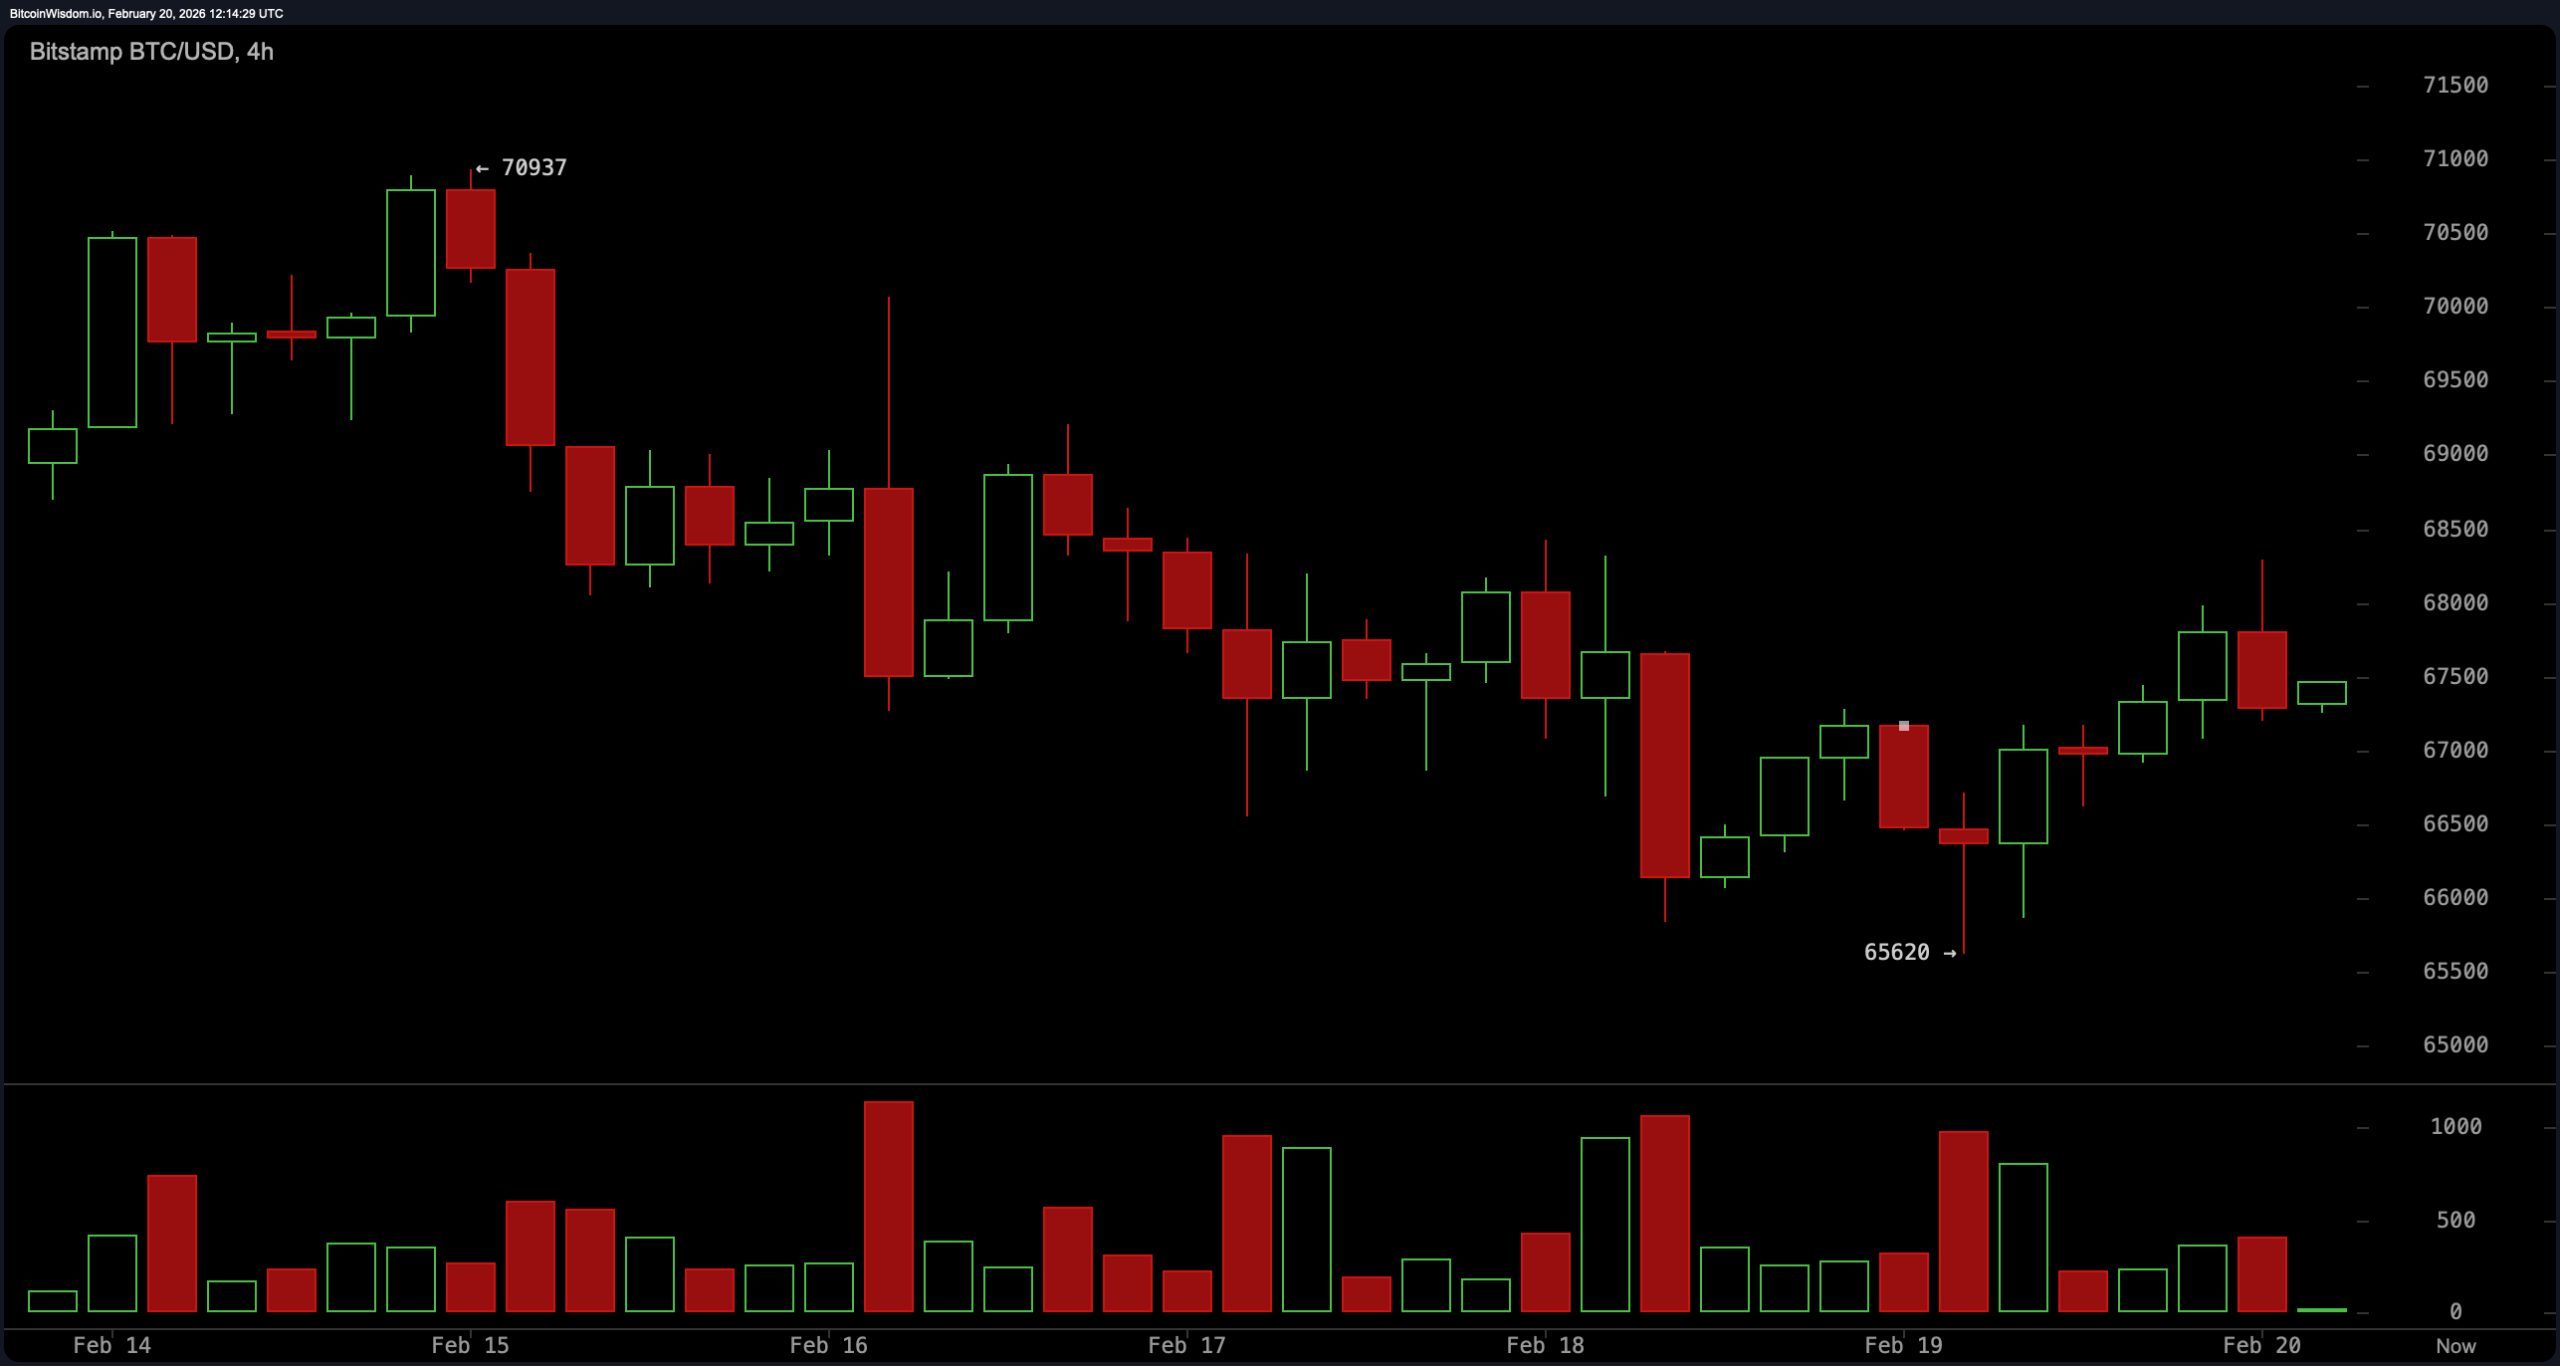
On the four-hour chart, bitcoin is compressing within a tightening range after forming a local bottom at $65,620. Price has carved slightly higher lows but faced rejection at $70,937 and again in the $68,500 to $69,500 zone. Current support sits between $65,500 and $66,000, while resistance is layered between $68,500 and $69,500. This type of compression, following a bounce, often precedes expansion. Whether that expansion resolves higher toward $70,937 and $72,000, or rotates lower toward $63,000 and potentially $59,930, will depend on momentum and participation. For now, the range rules the tape.
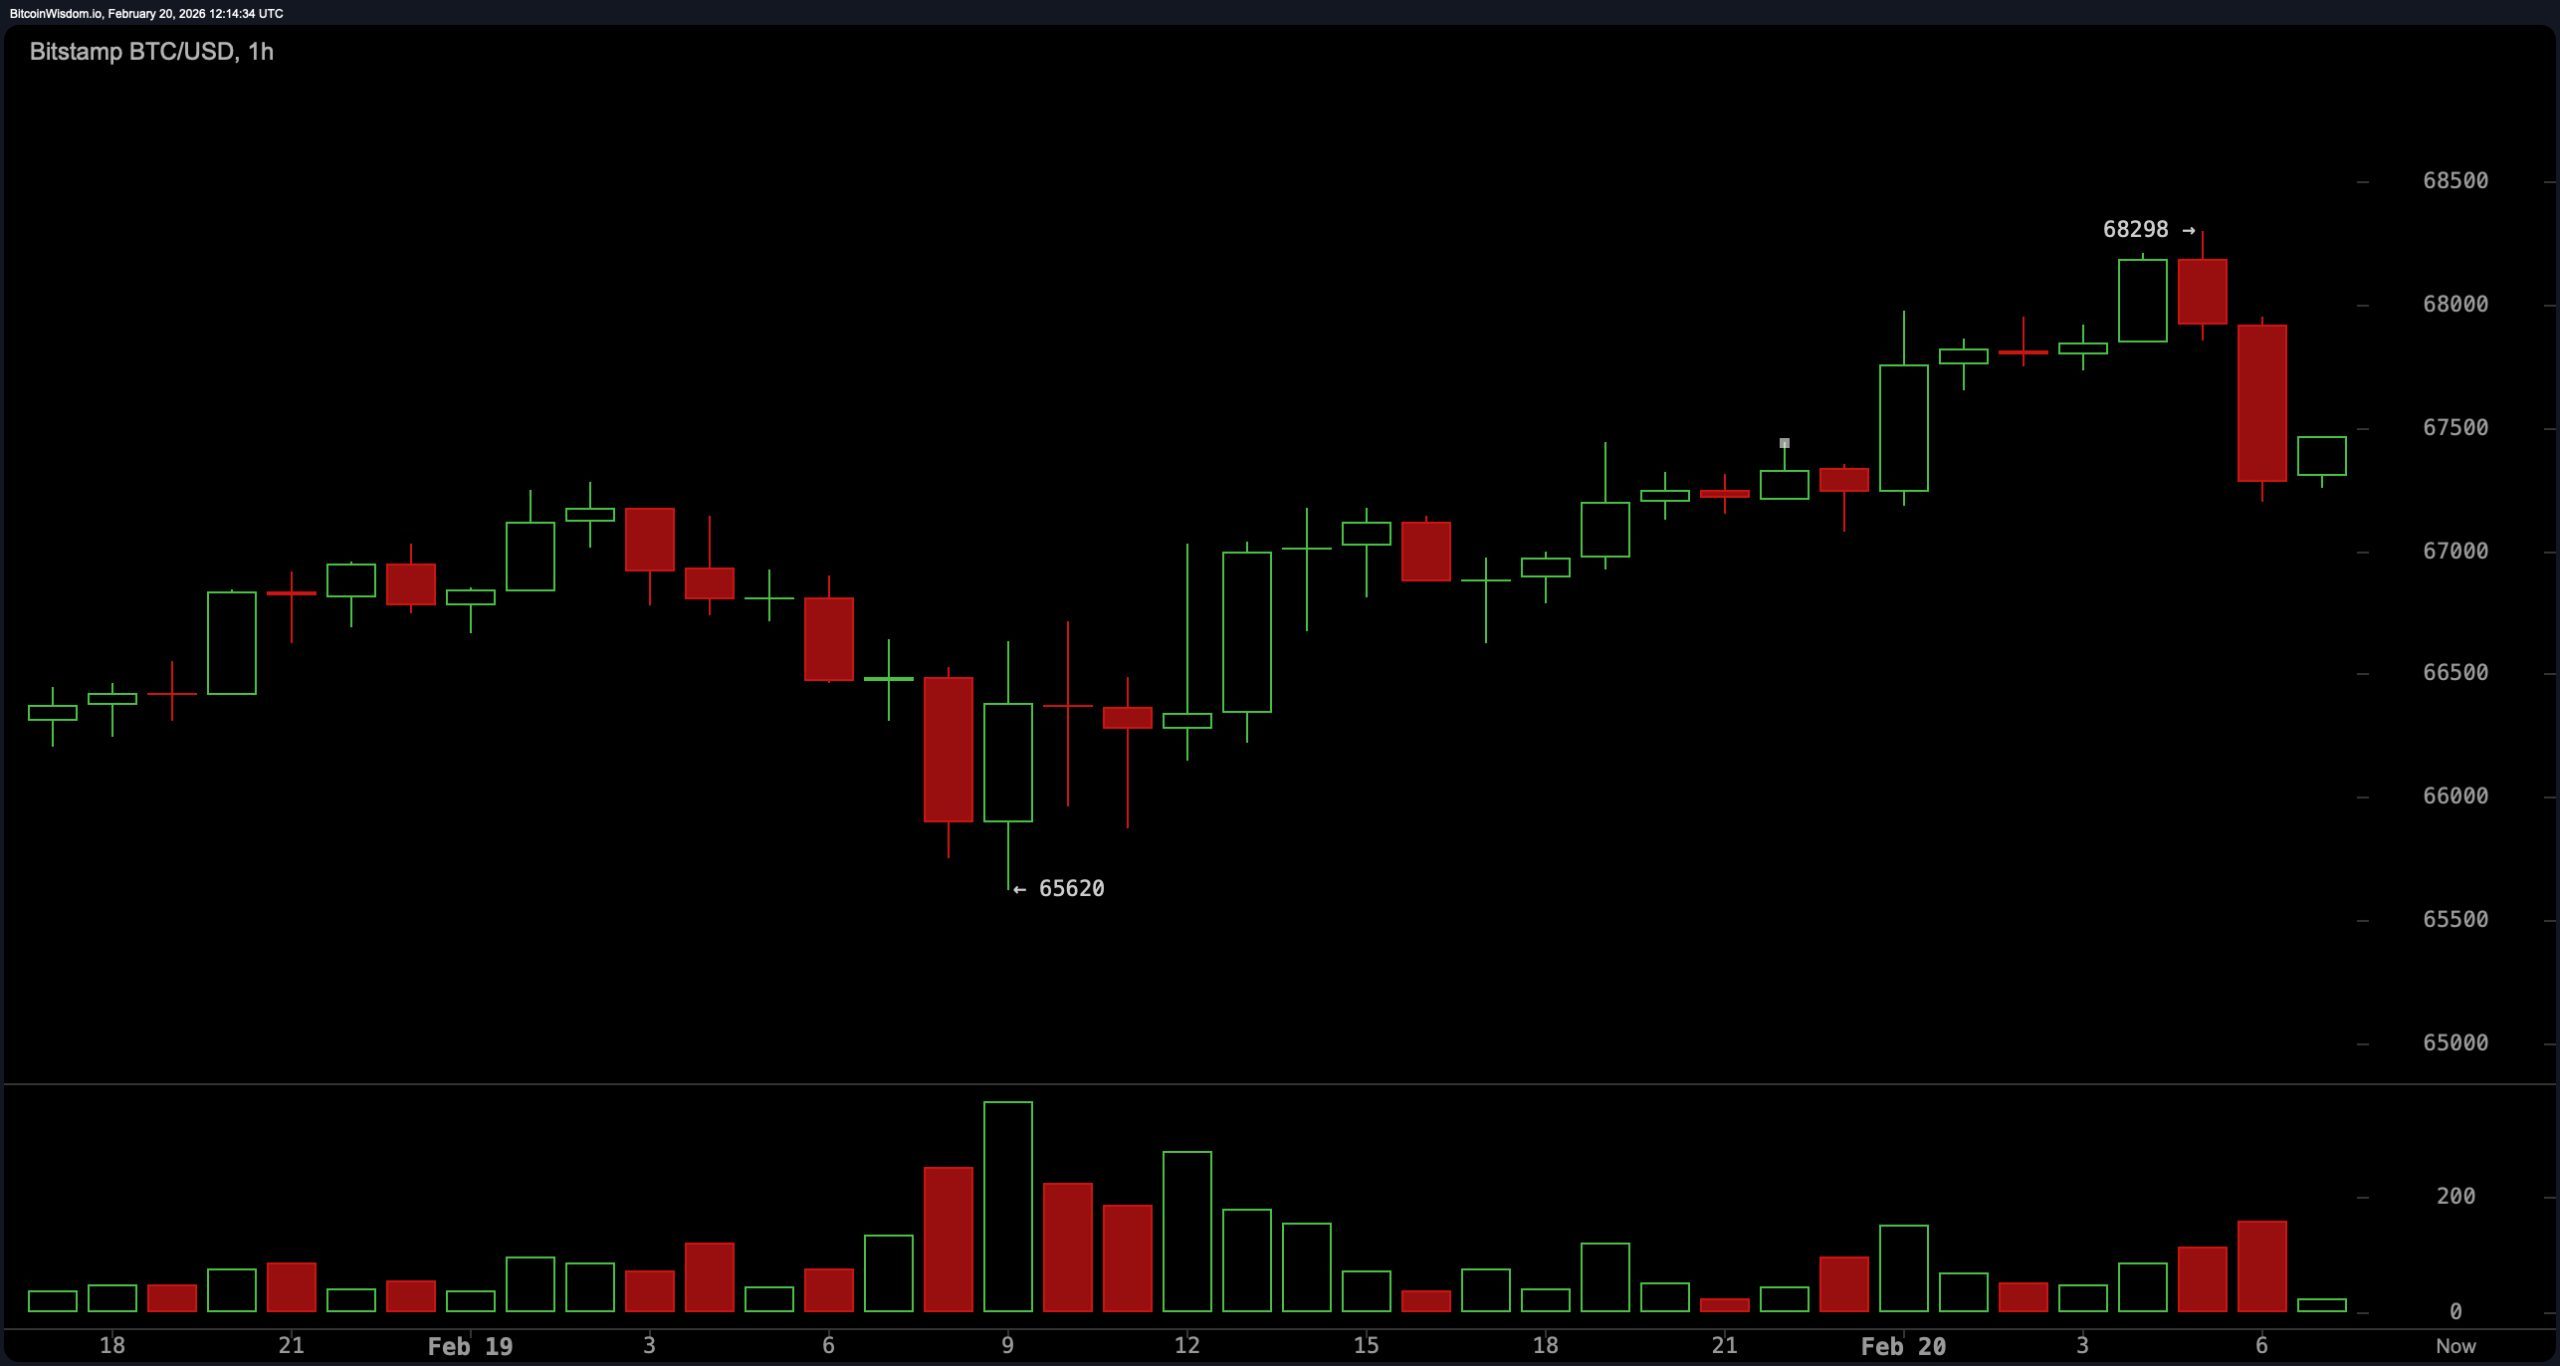
The one-hour chart shows a short-term uptrend from $65,600 to $68,300, followed by a clear rejection near $68,300. A pullback candle signals slowing momentum, and volume does not reflect aggressive breakout conviction. In other words, the market tested the ceiling and found it sturdier than expected. Without a decisive close above the $69,000 to $69,500 region on a strong four-hour structure, upside attempts risk fading back into the mid-range. Intraday traders may enjoy the volatility, but breakout traders are still waiting for confirmation that has yet to arrive.
Oscillators paint a nuanced picture. The relative strength index ( RSI) reads 36, neutral and not yet in oversold territory. The Stochastic oscillator stands at 46, also neutral. The commodity channel index (CCI) registers −56, maintaining a neutral posture, while the average directional index (ADX) at 58 suggests trend strength but without directional clarity in this context.
The Awesome oscillator prints −9,884, neutral, and momentum shows −1,392 with upside bias. The moving average convergence divergence ( MACD) level at −4,308 reflects upward crossover momentum within a broader corrective environment. Oscillators, in short, are not panicking — but they are not celebrating either.
Moving averages, however, remain firmly overhead. The exponential moving average (EMA) and simple moving average (SMA) (10) sit at $68,247 and $67,769, respectively, both above the price. The EMA and SMA (20) stand at $71,201 and $69,683, reinforcing near-term resistance. Higher still, the EMA and SMA (30) at $74,176 and $75,404 extend the ceiling, followed by the EMA and SMA (50) at $78,637 and $82,188. The EMA and SMA (100) at $85,870 and $85,876, along with the EMA and SMA (200) at $92,807 and $99,393, point to the broader downtrend. Until price begins reclaiming these dynamic levels, rallies risk looking more like relief than reversal.
Bull Verdict:
Bitcoin must decisively clear $69,500 on a strong four-hour close and reclaim $70,937, with expanding volume, to build momentum toward the $72,000 daily structure break. A confirmed move through $72,000 would invalidate the series of lower highs on the daily chart and shift the higher timeframe bias away from neutral-to- bearish, opening the door for a broader structural recovery rather than another short-lived relief bounce.
Bear Verdict:
Failure to hold the $65,500 to $66,000 support zone would expose $63,000 as the first downside objective, with a high-probability retest of the $59,930 major swing low if momentum accelerates. With price still trading below all key exponential moving averages (EMA) and simple moving averages (SMA) from the 10-period through the 200-period, and daily structure defined by lower highs, the macro posture continues to favor downside risk unless proven otherwise.
FAQ ❓
- What is bitcoin’s price on Feb. 20, 2026? Bitcoin is trading at $67,411, consolidating within a $65,000 to $70,000 range after a sharp bounce from $59,930.
- What are the key resistance levels for bitcoin right now? Immediate resistance sits between $68,500 and $69,500, with major daily resistance at $70,937 and $72,000.
- What are the critical support levels for bitcoin? Strong support is located between $65,500 and $66,000, with major downside risk toward $59,930 if that zone fails.
- Is bitcoin in a bullish or bearish trend? The daily structure remains neutral-to- bearish, as price trades below key exponential moving averages (EMA) and simple moving averages (SMA) despite short-term momentum stabilization.
