


 8
8
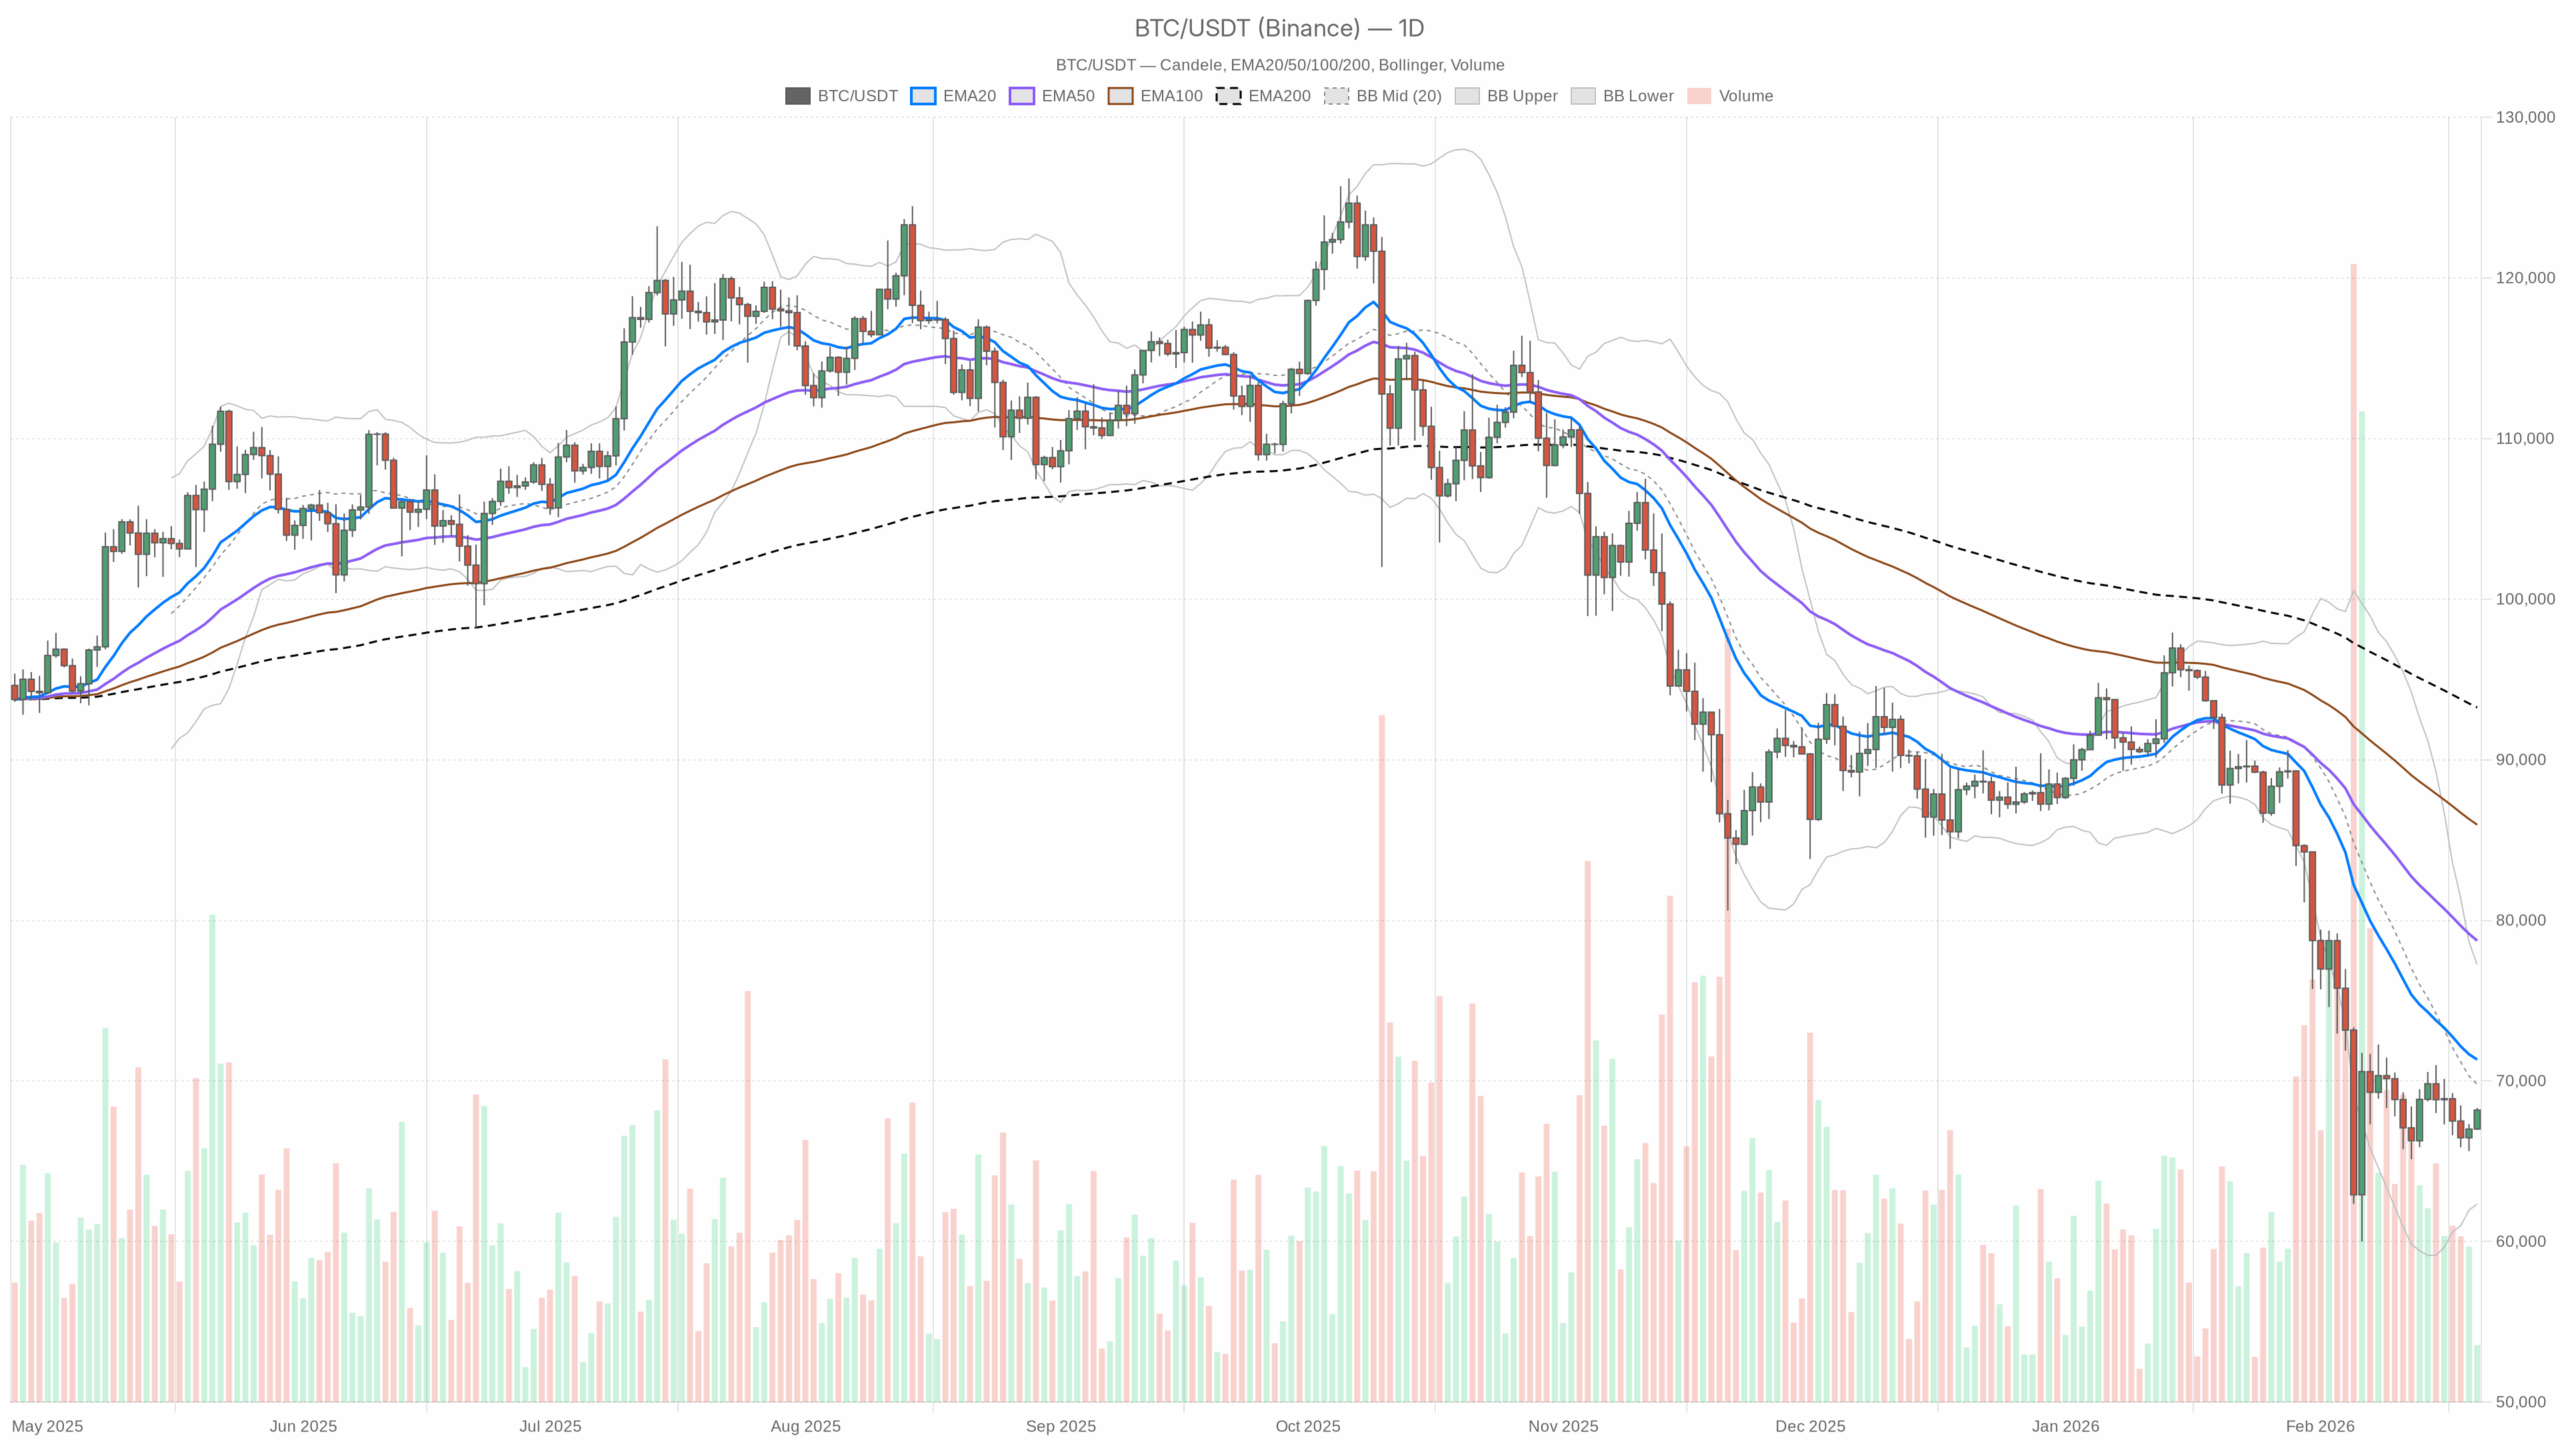
Traders are navigating a tactically bullish tape against a structurally weak backdrop, as Bitcoin price today attempts a recovery within a still-damaged broader trend.
Summary
Core Bias by Timeframe
Daily (D1) – Main Scenario: Bearish
The daily trend is clearly down. Price is trading below all key EMAs, MACD is negative, and RSI sits in the low 40s. That keeps the main scenario bearish until proven otherwise.
1H – Countertrend Recovery
On the hourly chart, Bitcoin has pushed back above short-term EMAs with a strong, overbought RSI. That is a classic recipe for a countertrend rally inside a larger down move – strong enough to hurt late shorts, but not yet strong enough to flip the macro trend.
15m – Local Upswing, Momentum Fading
The 15-minute structure is bullish but already losing momentum. This is more execution context than a signal: the short-term push is maturing right at resistance bands.
Daily Chart (D1): Structure Still Points Down
Trend & EMAs (Daily)
Data:
Price: $68,180.76
EMA 20: $71,329.06
EMA 50: $78,730.88
EMA 200: $93,253.97
Regime flag: bearish
Reading: Price is below the 20, 50, and 200-day EMAs, and the shorter EMAs (20/50) are well under the 200. That is a textbook bearish alignment and signals a dominant downtrend on the daily. The distance to the 200-day also tells you how far we have already slid from the prior cycle highs. This is not just a shallow pullback anymore; it is a proper trend deterioration.
In practical terms, rallies toward the 20-day EMA around $71k are, for now, more likely to be sold than chased unless we see a clean reclaim and hold above it.
RSI (Daily)
RSI 14 (D1): 37.76
This is weak but not yet oversold. The market is leaning bearish, but it has not washed out. There is still room for another leg lower before the kind of panic-driven capitulation that often marks durable bottoms. For swing traders, this means the downside is not exhausted yet, even if short-term bounces can occur.
MACD (Daily)
MACD line: -4,261.67
Signal line: -4,782.75
Histogram: +521.08
MACD is well below zero, confirming a bearish momentum backdrop. However, the line is slightly above the signal (positive histogram), which signals that the downside momentum is starting to cool off. In plain language: the downtrend is still the main story, but the aggressive phase of selling has eased. That is exactly the kind of backdrop where bear market rallies can be sharp and deceptive.
Bollinger Bands (Daily)
Middle band (20-day basis): $69,781.88
Upper band: $77,228.43
Lower band: $62,335.34
Close: $68,180.76
Price is hovering just below the middle band and well above the lower band. We have bounced off the lower-volatility edge and are now trying to stabilize in the lower half of the range. It is a consolidation inside a downtrend rather than a clean trend reversal. A decisive close back above the middle band (~$69.8k) would be an early sign that the market is trying to mean-revert higher toward the upper band in the coming sessions.
ATR (Daily)
ATR 14 (D1): 2,858.27
Daily volatility is elevated but not extreme by Bitcoin standards. A typical daily swing is roughly $2.8k, which means tests of nearby levels can be hit or missed very quickly. Position sizing and leverage need to respect the fact that a 4–5% day is normal here, not an outlier.
Daily Pivot Levels
Pivot Point (PP): $67,816.19
Resistance 1 (R1): $68,682.96
Support 1 (S1): $67,313.98
Close: $68,180.76
$BTC is trading above the daily pivot and closer to R1 than S1. Intraday buyers have the upper hand versus today's reference levels, but the upside is bumping into the first resistance band. The pivot structure matches the story: a bounce within a still-bearish higher timeframe.
Hourly Chart (H1): Countertrend Push, Short Squeeze Potential
Trend & EMAs (H1)
Price: $68,175
EMA 20: $67,439.14
EMA 50: $67,287.52
EMA 200: $67,937.79
Regime flag: neutral
On the hourly, price has reclaimed all the key EMAs. The 20 and 50 are now stacked under price and are close to crossing above the 200 again. That is what you usually see in a short-term recovery phase after an aggressive drop. It does not overturn the daily downtrend, but it does tell you that intraday sellers are losing control.
RSI (H1)
RSI 14 (H1): 69.94
Hourly RSI is flirting with overbought. The move up has been strong and fast, which fits the idea of a short-covering rally. Near-term, this makes chasing longs less attractive unless you see continued strength. It also means any pullback from here could be sharp as fast longs and late shorts rebalance.
MACD (H1)
MACD line: 316.64
Signal line: 195.69
Histogram: 120.95
MACD is above zero and widening away from the signal line. Momentum on this timeframe is clearly bullish. Buyers have taken intraday control and are still pressing, which supports the idea that dips on very short timeframes can be bought tactically, as long as the hourly structure holds above the EMAs.
Bollinger Bands (H1)
Middle band: $67,262.26
Upper band: $68,356.08
Lower band: $66,168.44
Close: $68,175
Price is riding the upper band on the hourly. That is what you see in a strong short-term impulse. As long as $BTC hugs or stays near the upper band, intraday bulls are in control. However, if price starts to slip back toward the middle band, it would signal that this thrust is cooling off and the market is moving back into consolidation mode.
ATR (H1)
ATR 14 (H1): 306.9
Average hourly swings are about $300. That is enough noise to run through tight stops repeatedly. For short-term strategies, entries too close to obvious intraday levels can easily be wicked out.
Hourly Pivot Levels
Pivot Point (PP): $68,198.81
R1: $68,294.58
S1: $68,079.23
Close: $68,175
Price is pinned almost exactly at the hourly pivot zone and just below R1. That shows a tug-of-war right at a key intraday decision area. A clean break and hold above R1 would open the door toward higher intraday resistance. Repeated failures or wicks above R1 that close back under PP would hint that the countertrend move is stalling.
15-Minute Chart (M15): Execution Context, Not a New Trend
Trend & EMAs (M15)
Price: $68,175
EMA 20: $67,887.16
EMA 50: $67,549.27
EMA 200: $67,228.78
Regime flag: bullish
The 15-minute chart is in a clean local uptrend. Price sits above all short-term EMAs, with a proper bullish stack (20 > 50 > 200). For execution, this means intraday pullbacks toward the 20/50 EMAs are the first zones where short-term traders are likely to probe longs, in line with the hourly push.
RSI (M15)
RSI 14 (M15): 66.68
RSI on this timeframe is elevated but not extreme. The immediate momentum is still up, but the easy part of the move is likely behind us. Short-term, this favors scaling into strength with caution rather than initiating fresh, aggressive longs at market.
MACD (M15)
MACD line: 205.62
Signal line: 190.08
Histogram: 15.54
MACD is positive but the histogram has shrunk. The trend is up, but the momentum burst is fading. On this timeframe, that often precedes either a sideways consolidation or a shallow pullback before the market decides on the next leg.
Bollinger Bands (M15)
Middle band: $67,901.91
Upper band: $68,280.81
Lower band: $67,523.01
Close: $68,175
Price is pressed against the upper band again. The short-term push is extended, so chasing up here carries a higher risk of buying into a local top. For scalpers, it is a spot to tighten risk, not relax it.
ATR (M15)
ATR 14 (M15): 145.52
Average 15-minute ranges are about $145. Micro-level stops inside that noise band will be tested frequently. This is a choppy environment for very tight risk parameters.
15-Minute Pivot Levels
(Same intraday pivot set as the hourly, given the provided data.)
PP: $68,198.81
R1: $68,294.58
S1: $68,079.23
On the 15-minute, price is oscillating right around the pivot. This reinforces the idea that the immediate battle is happening here; it is the intraday line between continuation higher and a fade back into the prior range.
Macro Context: Fear Is High, Bitcoin Still Dominates
Bitcoin is trading around $68,175 against $USDT, stuck in the lower half of its recent range but showing a sharp intraday rebound. The bigger picture is still a downtrend on the daily chart, while intraday timeframes are trying to squeeze higher. In other words, the market is tactically bid, but structurally damaged.
This moment matters because positioning is extremely cautious. The crypto fear & greed index is printing 7 – Extreme Fear while $BTC dominance sits near 56.6%. Capital is hiding in Bitcoin and stables, and yet price is pressing back toward short-term resistance. That combination of fearful sentiment, heavy $BTC dominance, and a short-term push higher is fertile ground for violent short-covering rallies inside a broader bearish regime.
The broader crypto market cap is about $2.41T, up roughly 1.45% over 24 hours, while $BTC dominance stands near 56.65%. That tells us two things:
First, capital is flowing into crypto cautiously, not in a euphoric rush. Second, the flow is concentrated in Bitcoin and stables, not in high-beta altcoins. This is classic defensive risk-on: participants want exposure to the space, but they are not ready to go far out the risk curve.
The Extreme Fear sentiment reading (7/100) lines up well with the technicals: a damaged higher timeframe trend, but with enough pessimism baked in that sharp squeezes are entirely on the table. Fearful markets do not move in straight lines; they spike both ways as positioning gets cleaned up.
Scenario Map: Bullish vs. Bearish Paths for Bitcoin
Bullish Scenario (Countertrend Rally Grows Legs)
For the bullish side to take control beyond a simple short squeeze, we would need:
1. Daily reclaim of the 20-day EMA (~$71,300) with a close above it.
2. Hourly structure holding above the 200 EMA (~$67,900), turning pullbacks into higher lows instead of lower highs.
3. RSI on the daily pushing back toward the mid-40s/50s without immediate rejection, confirming that sellers are losing dominance.
If those conditions play out, price could rotate toward the daily middle Bollinger band and upper band, that is roughly the $70k–$77k zone over the next leg. That would still be a move within a broader corrective structure, but it would be meaningful enough to punish late shorts and stabilize sentiment out of Extreme Fear.
What invalidates the bullish scenario?
A decisive rejection below the daily pivot and loss of the hourly 200 EMA, for example a clean break back under $67k that sticks, would show the bounce was just a one-off squeeze. If that happens while daily RSI remains sub-40, the path of least resistance opens again toward the lower Bollinger band near $62k.
Bearish Scenario (Downtrend Resumes)
The main daily bias is still bearish, so this remains the default until flipped. In the bearish continuation case:
1. Price fails to close above the $69.5k–$71k band (daily mid-band and 20 EMA).
2. Intraday momentum on H1 and M15 rolls over from overbought levels, with hourly RSI dropping back through 50 and MACD crossing down.
3. $BTC loses the $67k area and starts closing daily candles back toward the lower band.
In that environment, the market would be targeting a retest of the $62k–$63k region (daily lower Bollinger band) as the next logical demand zone. With daily ATR around $2.8k, that move could happen in only a couple of strong sessions once acceleration resumes.
What invalidates the bearish scenario?
A sustained daily close and follow-through above the 20-day EMA (~$71.3k), accompanied by a clear MACD upturn toward the zero line, would undermine the bear case. At that point, the downtrend would be transitioning into at least a medium-term range or early uptrend, and using rallies as short entries would become much more dangerous.
How to Think About Positioning Right Now
From a trading perspective, the key tension is straightforward:
– Daily: Downtrend, bearish regime, sentiment in extreme fear.
– Intraday (H1/M15): Strong countertrend bounce, overbought short-term, momentum still pointing up.
That mix usually favors tactical, short-term strategies over big directional bets. Swing traders looking for higher conviction will likely want to see either:
– A clean rejection of this bounce from the $69k–$71k region (for trend-following shorts), or
– A firm reclaim and hold above the 20-day EMA (for the first medium-term long bias in a while).
Volatility, as measured by ATR across timeframes, is high enough that intraday mis-timing can be expensive, especially with leverage. The current tape rewards patience and clear levels rather than constant reaction to every tick. Until the daily chart proves otherwise, Bitcoin price today is best viewed as a countertrend recovery within a larger corrective phase, not yet a fresh bull leg.