


 5
5
Bitcoin rebounded within its daily range and is testing Fibonacci resistance, with bulls needing stronger momentum to sustain the upswing.
Bitcoin ($BTC) is currently reflecting steady short-term recovery momentum, trading at $67,778.9, up 1.11% over the past 24 hours. Based on the 1-day chart, $BTC’s intraday price action has fluctuated between approximately $65,733 and $67,924, which signals moderate volatility.
Price initially dipped into the mid-$65K region before staging a consistent rebound, breaking back above the $67K level and pushing toward the upper boundary of the session range, where it is now consolidating.
Short-term performance shows gains across the 4-hour (+0.72%), 24-hour (+1.11%), and 7-day (+2.36%) timeframes, suggesting improving near-term sentiment. However, broader trends remain pressured, with declines of 23.26% over 30 days and 41.26% over 180 days, indicating the recent bounce is occurring within a larger corrective structure.
Notably, traders are now positioning for a continuation higher. With $BTC now near the upper end of its daily range, the next move will likely depend on whether buyers can push decisively above the session highs.
Bitcoin Price Prediction
On the 4-hour chart, Bitcoin has broken through the 0.382 Fibonacci retracement level at $67,661, which was acting as immediate resistance. Now, the focus shifts to the next resistance at the 0.5 Fibonacci level, priced at $68,287. The 0.5 level acts as a key pivot area, not as strong as the 0.618, but important in determining whether a move is corrective or the start of a broader reversal.
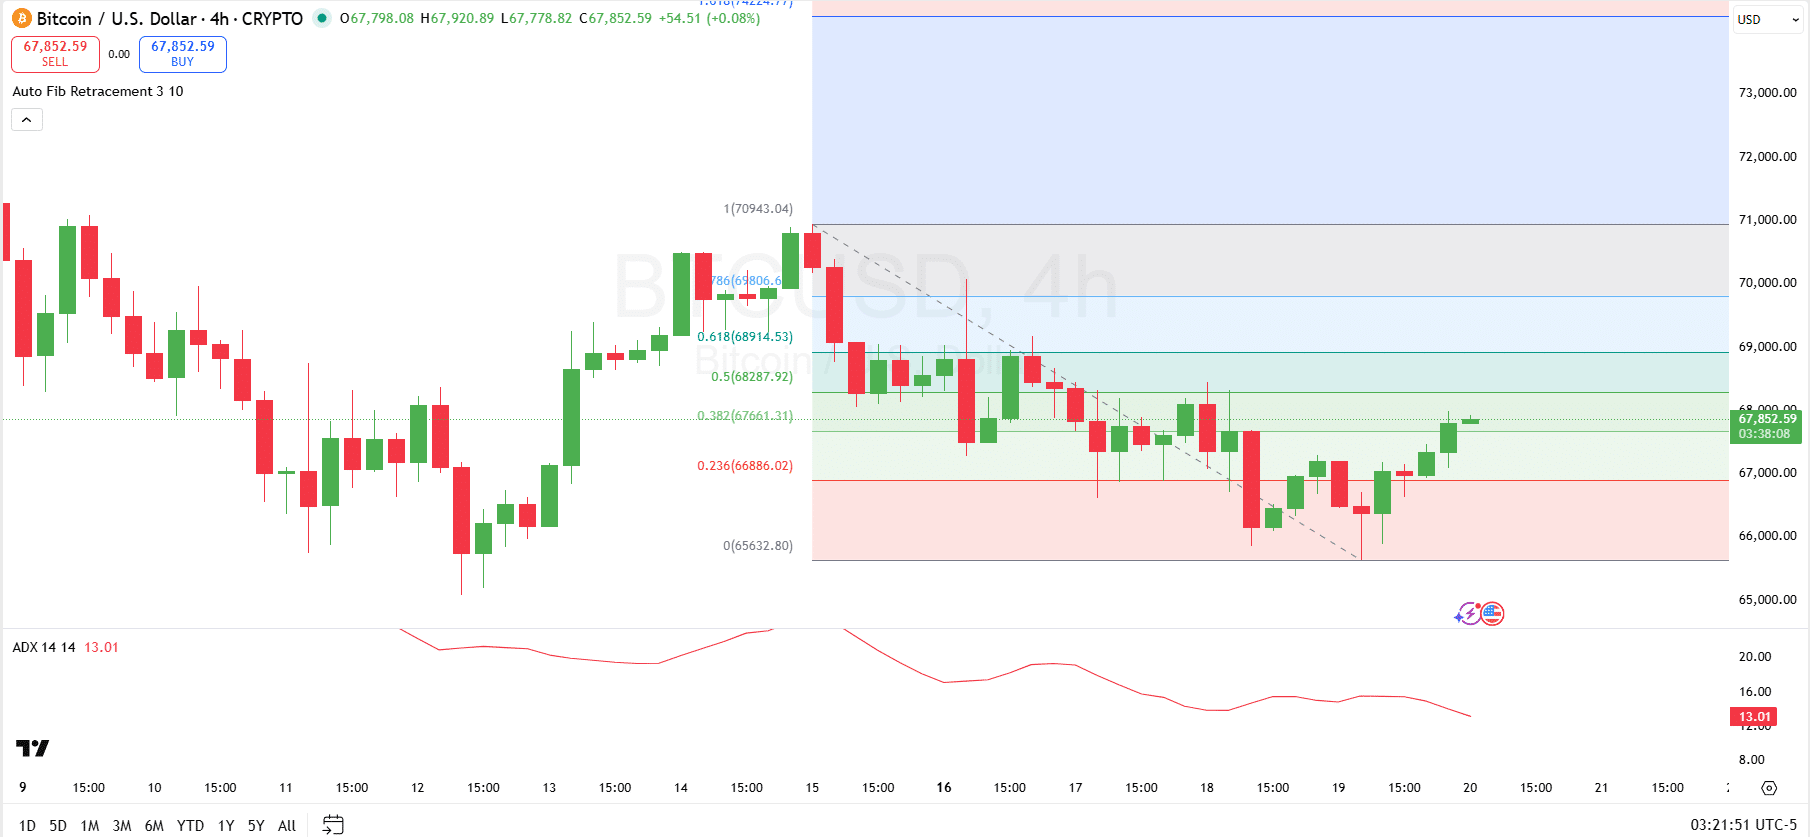
For $BTC to break further resistance at the 0.5 level, it would need a decisive 4H close above it, followed by continuation toward the 0.618 level near $68,914. However, the ADX reading around 13 suggests trend strength is currently weak, meaning the move lacks strong directional conviction. This increases the likelihood of consolidation or rejection unless volume expands and momentum strengthens.
If $BTC fails to close above the 0.5 level, it could rotate back toward the 0.382 retracement near $67,661 or even retest the 0.236 level around $66,886.
$68,900 up Next for Bitcoin?
Elsewhere, crypto analyst Ali Martinez notes that Bitcoin has successfully cleared the $67,400 level, signaling a bullish development in the short term. According to his view, with that resistance now broken, the next key upside target for $BTC sits at $68,900.

Further resistance and possible upside targets exist at $69,800, followed by the psychological $70,800 level. A sustained move above that zone could open the door toward the broader resistance area near $71,600, which marks the upper boundary of the recent trading structure.
