


 5
5
Gold has reclaimed the $5,000 per ounce threshold on the TVC chart by TradingView, and this time, the move is not just symbolic. As bullion pushes back into five-handle territory, Bitcoin is slipping in relative terms, with the $BTC/XAU ratio drifting lower across intraday and higher time frames.
On Feb. 18, spot gold traded around $5,005, extending a decisive advance that accelerated in the U.S. session. The five-minute chart shows a sequence of higher highs and firm closes above short-term moving averages, while momentum readings remain elevated without clear exhaustion. The technical posture supports continuation, at least while the price holds above the $4,980-$4,990 area.
Bitcoin-to-gold ratio hits weekly lows
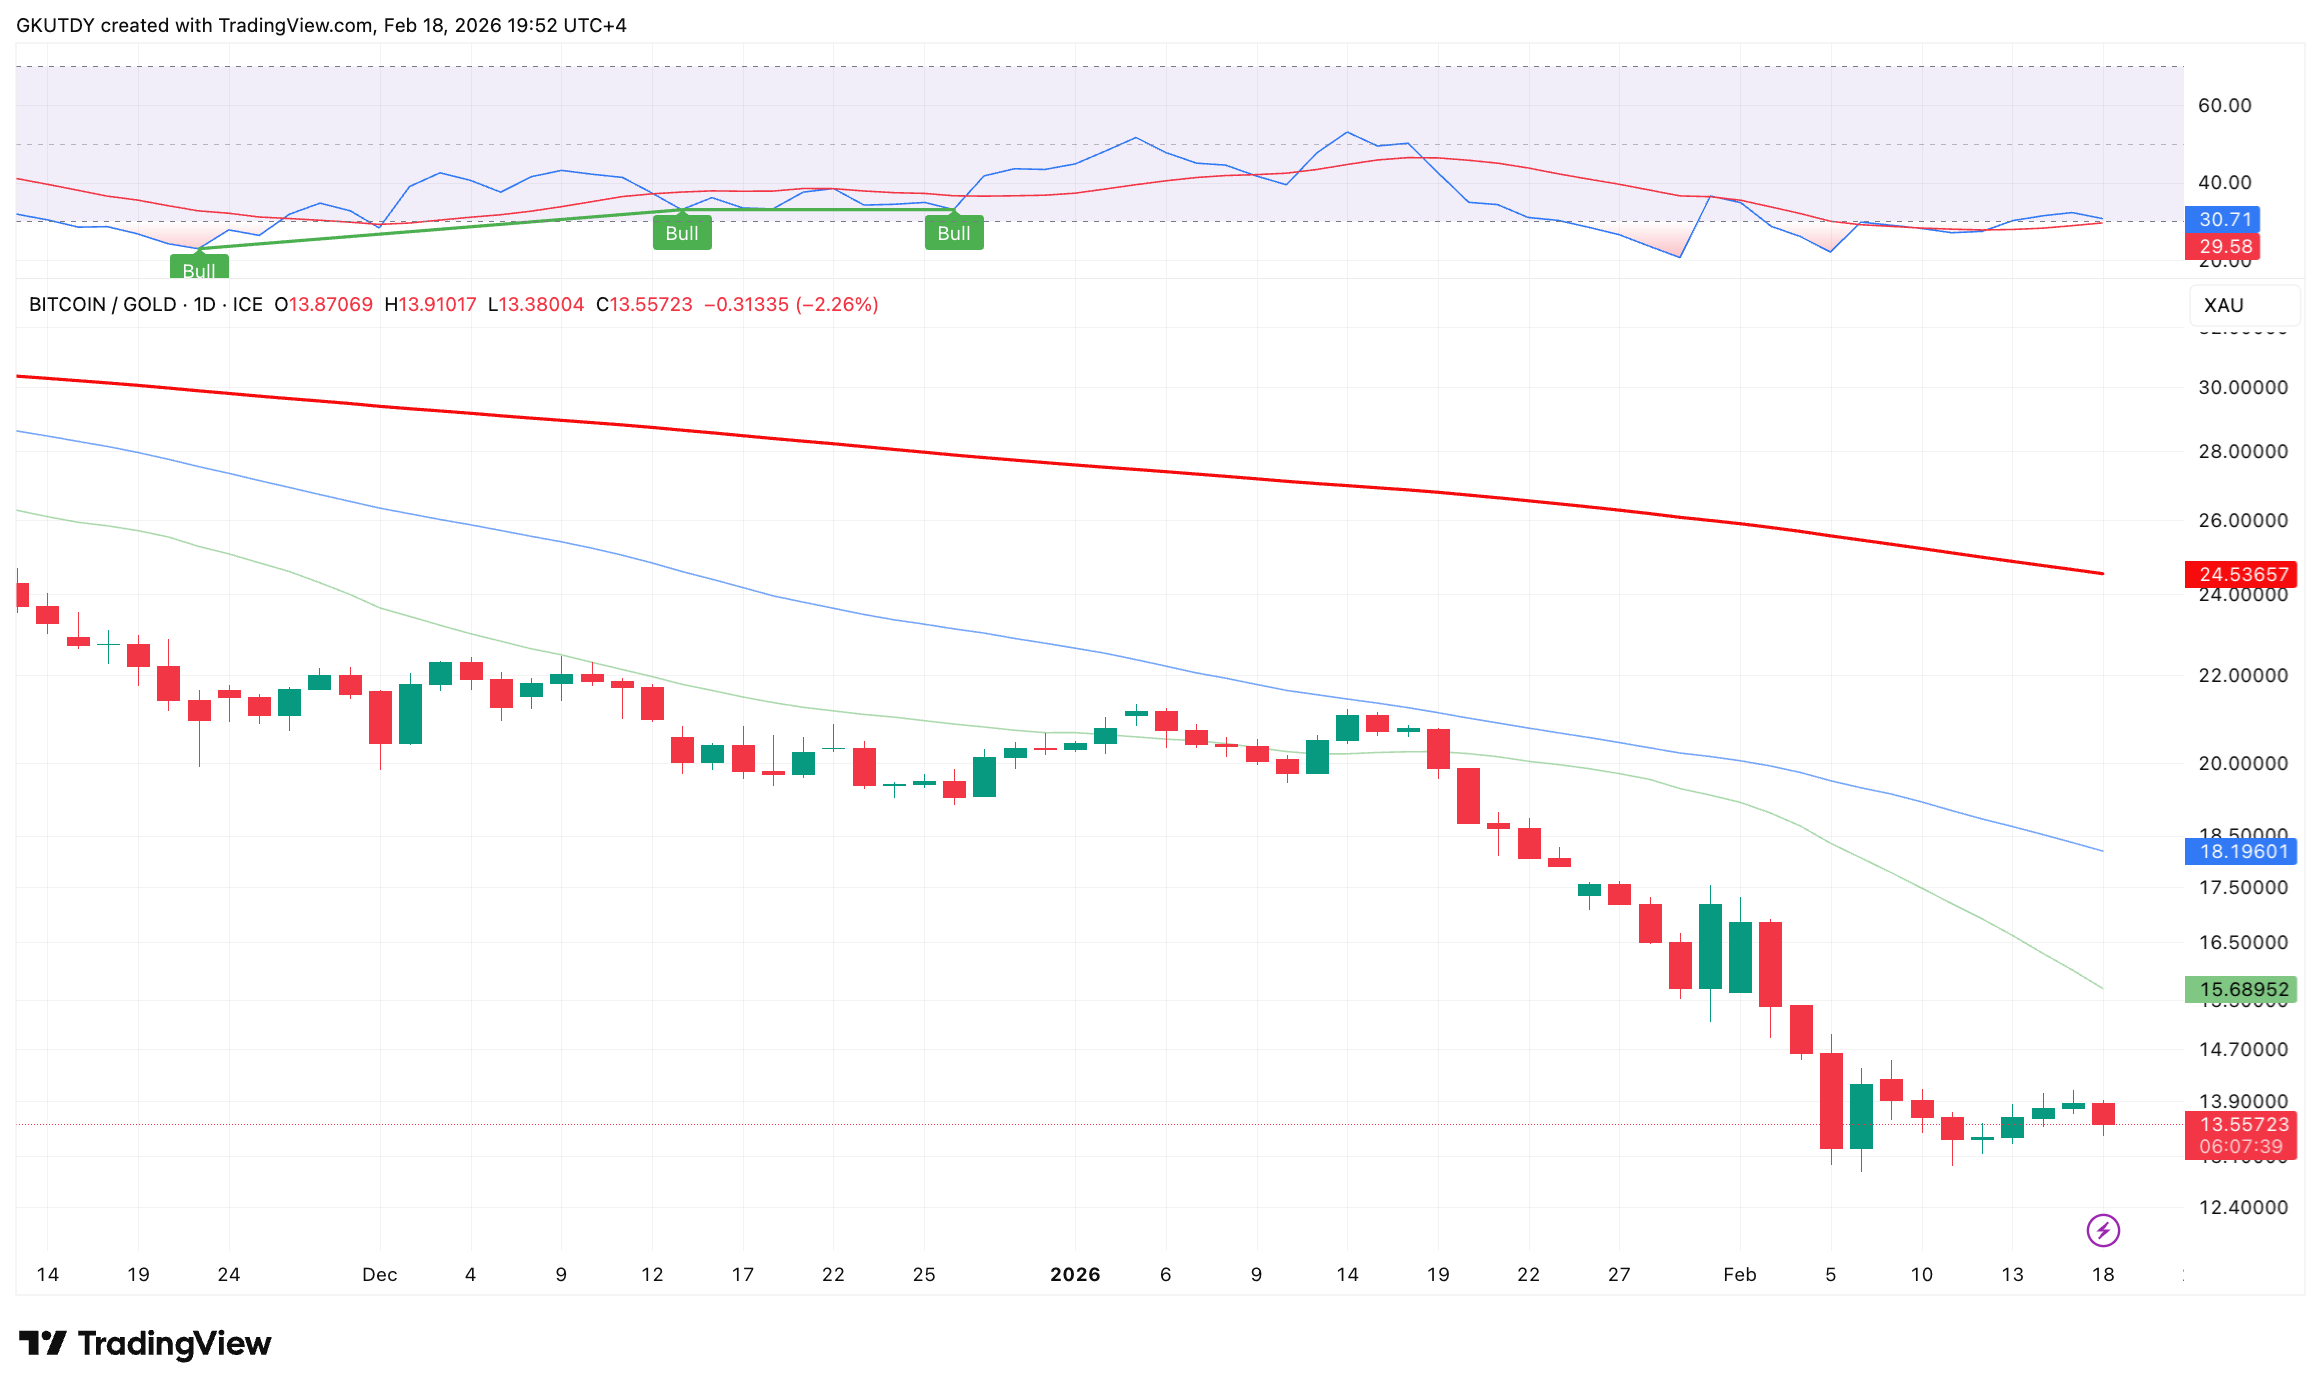
The Bitcoin-to-gold ratio fell toward 13.46, down from levels above 13.9 earlier in the week. That means one Bitcoin now buys fewer ounces of gold than it did just days ago.
On the daily chart of gold priced in Bitcoin, the structure favors bullion. The price remains above medium- and long-term moving averages, and pullbacks have been contained. Even if Bitcoin holds steady in dollar terms, its purchasing power relative to gold is contracting.
This divergence carries narrative weight. Bitcoin has long been framed as a digital alternative to gold, particularly during inflation concerns or geopolitical strain. When bullion strengthens while the $BTC/XAU ratio weakens, investors are effectively voting for the traditional hedge.
In the short term, a continuation in gold toward fresh highs would likely push the ratio into the 13.3-13.4 region unless Bitcoin accelerates sharply. A reversal would require either renewed crypto inflows or a cooling in gold’s bid.

