

 5
5
Bitcoin faces immediate resistance near the middle Bollinger Band, with the market watching if it can break higher or test support levels.
The Bitcoin ($BTC) market shows some interesting activity as of the latest data. Currently, Bitcoin is priced at $67,650.1, experiencing a 0.88% decline in the past 24 hours. The price has fluctuated between $66,724 and $68,425 within the 24-hour range.
Despite this decline in the past 24 hours, Bitcoin has shown resilience over a slightly longer time frame. On the 7-day chart, Bitcoin has dropped by 1.66%, which is relatively minimal, especially considering the more significant 30-day decline of 27.76% and a 1-year decrease of 29.36%.
The 24-hour trading volume of $5.17 billion in spot trading indicates active market participation. Meanwhile, the higher futures volume of $51.17 billion shows significant positioning in the derivatives market.
With Bitcoin still facing resistance and lacking any clear direction beyond its current price range, the market’s next key levels to watch will be the lower end of its daily range and its ability to reclaim higher levels above $68,000. Can $BTC breach resistance?
Can Bitcoin Breach Key Resistance?
On a daily chart, Bitcoin is currently facing resistance near the $71,179 level, as seen by the middle Bollinger Band. The upper Bollinger Band at $81,209 represents a stronger resistance, while the lower band at $61,148 serves as the key support level.
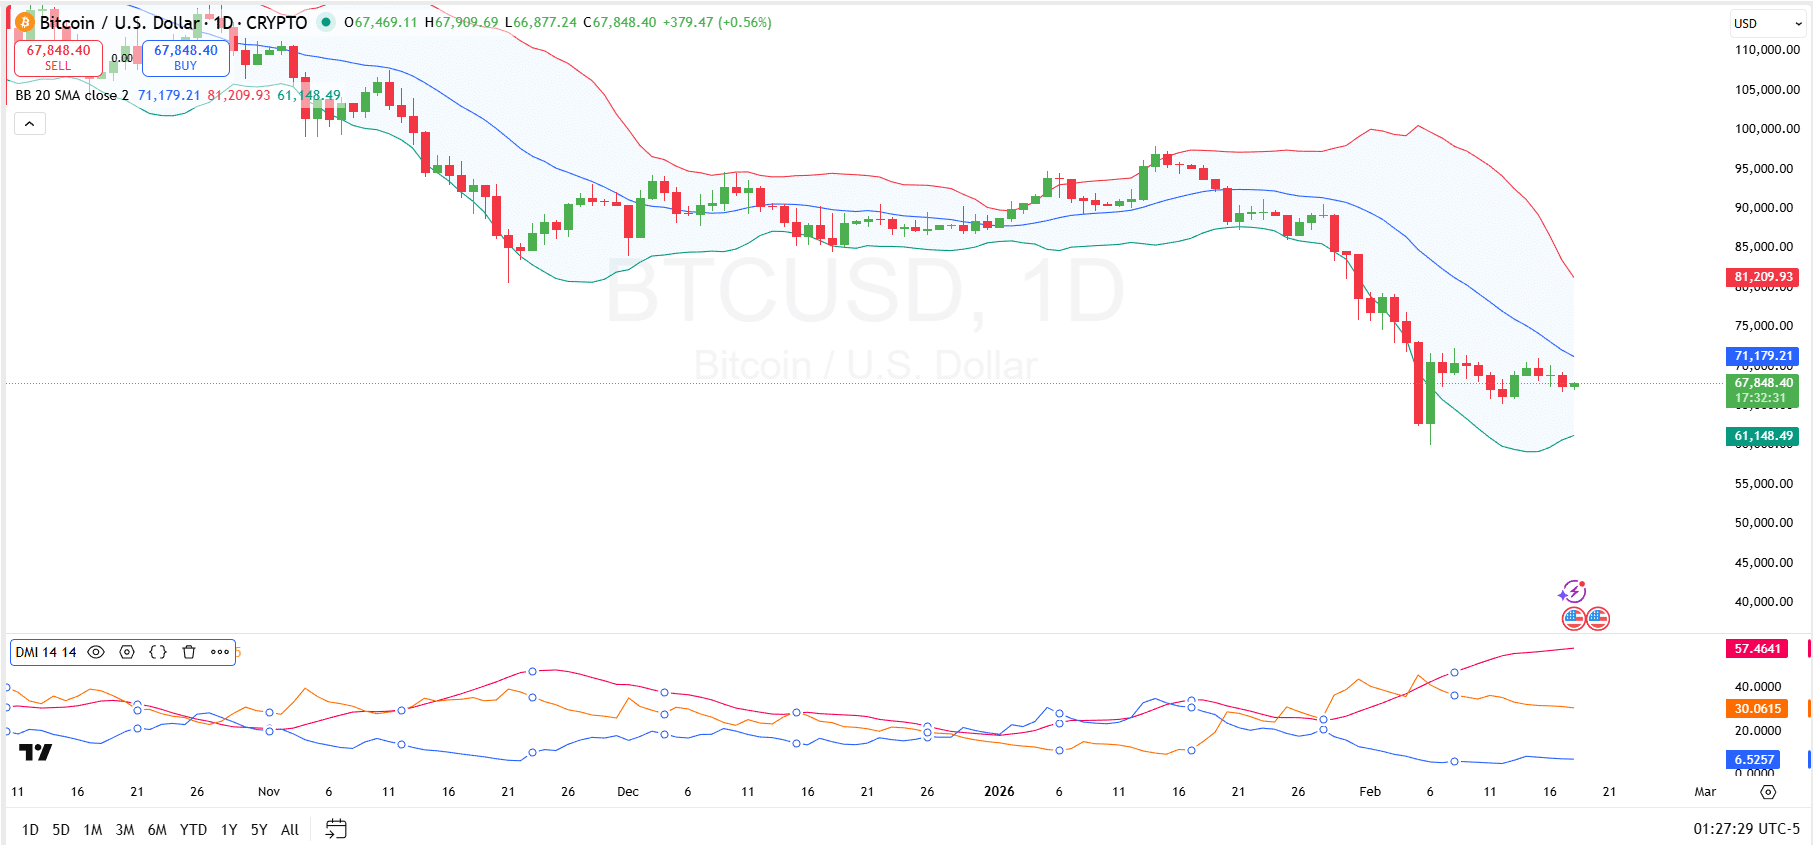
Currently, the price is slightly above the middle band, suggesting that Bitcoin may attempt to move towards the upper band if it can maintain its momentum. If Bitcoin breaks above the middle band and sustains that level, a move toward $81,209 could be possible. On the other hand, if the price fails to hold above the $71,179.21 resistance, it might test the lower Bollinger Band, reinforcing the bearish trend.
In terms of momentum, the Directional Movement Index shows that the -DI is currently higher than the +DI, signaling that bearish momentum is still dominant. The ADX value of 57.46 reflects a strong trend in the market, but it is slightly tilted toward bearish pressure, confirming that the selling strength is currently stronger than the buying strength. If the +DI crosses above the -DI, Bitcoin could enter a bullish phase, potentially paving the way for a breakout above the resistance levels.
$BTC OI-Weighted Funding Rate
Additional chart data shows Bitcoin’s price action alongside its OI-Weighted Funding Rate, with Bitcoin priced above $67,000 as of February 18, 2026. The funding rate has been fluctuating throughout January and February, moving between positive and negative values, which indicates changing market sentiment. The OI-Weighted Funding Rate peaked at around 0.01% in early January before dropping to -0.01% in early February.
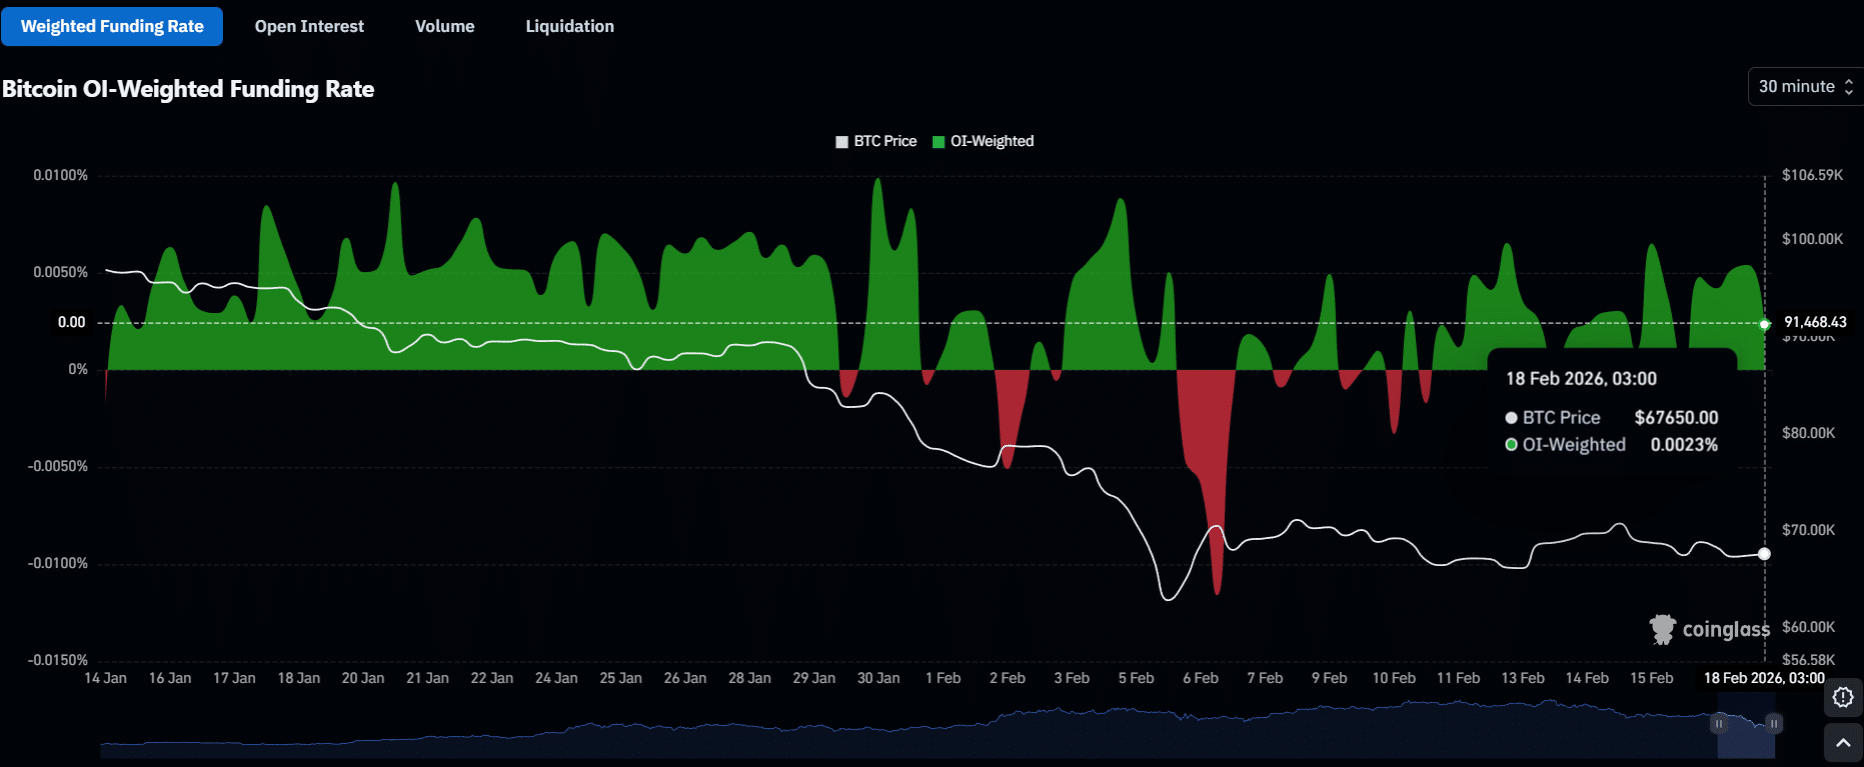
Notably, as Bitcoin’s price slumped, the funding rate became negative, signaling bearish sentiment and more short positions. Recently, the funding rate has been rising again, reaching 0.0065% before settling at 0.0023% today. Despite the recent decline, this suggests a potential shift towards more long positions. Traders will closely watch whether the funding rate continues to rise alongside Bitcoin’s price or if the market remains cautious.
