


 9
9
Bitcoin hovers near key support as bearish trend persists, with oversold RSI and liquidation skew raising odds of a volatile rebound attempt.
The Bitcoin ($BTC) market looks like it just took another sharp intraday punch. The first-born crypto currently trades for $66,381, down 1.7% over the last 24 hours. The 24-hour range sits between a low of $65,243.00 and a high of $68,308.51. That means the session included a meaningful swing: price reached into the upper $68K area before selling off hard to the mid–$65K area, then attempting to stabilize closer to the $66K handle.
On the shorter timeframes, momentum is still slightly negative: -0.5% over 1 hour and -1.8% over 24 hours, while 7 days is -0.6%, suggesting choppy weakness. The longer timeframes show declines at 20.5% over 14 days and 30.5% over 30 days. With the bearish momentum persisting in all timeframes, the next convincing break is likely to set the tone for the next headline move.
Where’s Bitcoin Headed?
Bitcoin’s daily TradingView chart still firmly remains bearish from a trend-perspective, with price trading just above $66,000 while both longer moving averages sit well above. The chart shows EMA 50 at 82,024.09 and EMA 100 at 88,526.85.
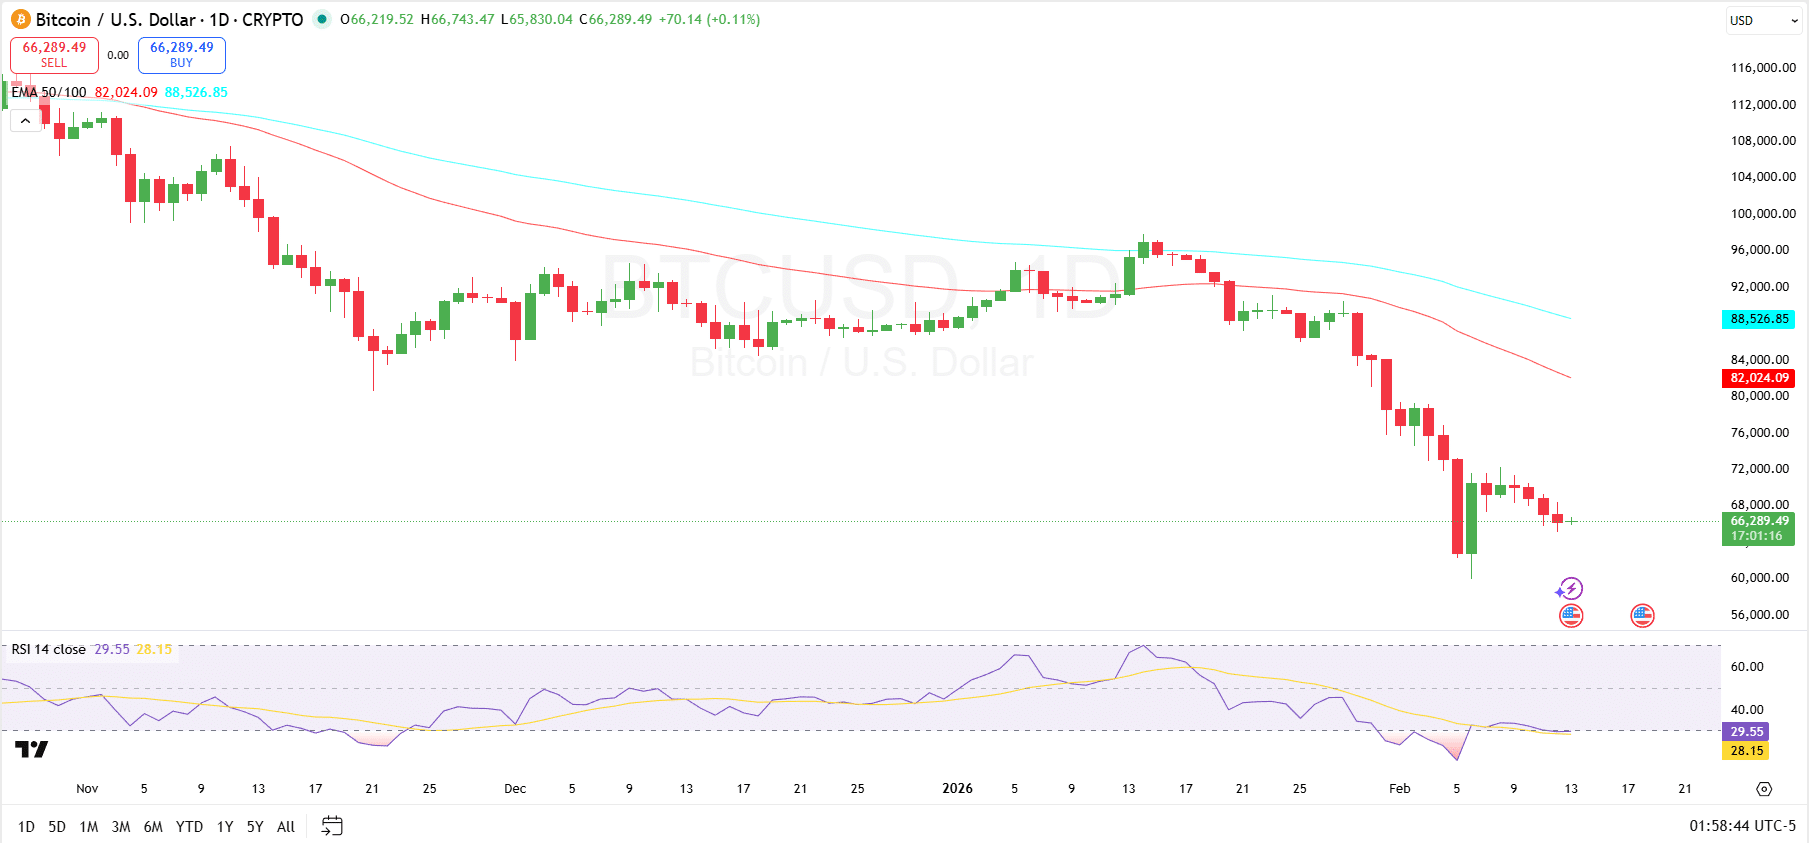
The distance between the current price and these EMAs highlights how far the market would need to recover to shift the broader trend. A run to $82,024 would need Bitcoin to surge about 23.6% from the current price of $66,381. Any other bounce would only represent a relief move unless price can reclaim and hold above those dynamic resistance levels.
Momentum indicators are also flashing weakness. The RSI sits at 29.55, below the 30 threshold that signals oversold conditions. Meanwhile, the RSI’s moving average line sits around 28.15. That combination often appears near exhaustion points, meaning downside pressure may be reversed, and bounces could happen.
Notably, the next move will likely depend on whether $BTC can stabilize and base near current levels or whether any rebound faces rejection under the EMA 50 as the dominant overhead resistance.
Bitcoin Liquidation Data
Over the short term, liquidations remain balanced but slightly short-heavy. In the 1h window, total “rekt” is $1.85M, split between $814.71K longs and $1.04M shorts. In the 4h window, the total rises to $2.92M, with $1.73M longs versus $1.19M shorts. This suggests that intraday weakness has been punishing late long entries more than shorts.
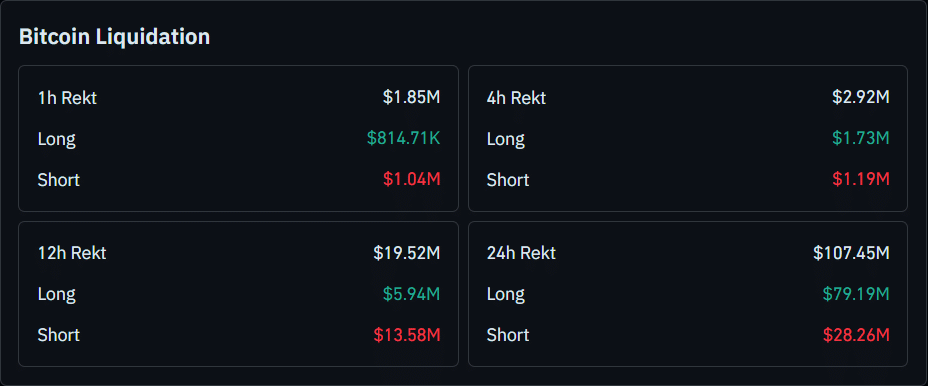
Zooming out, the liquidation picture becomes more decisive and helps explain the volatility. The 12h total is $19.52M, with $5.94M longs and $13.58M shorts, meaning shorts faced the bigger hit over that span (often consistent with sharp squeezes or failed breakdown attempts). However, the 24h total jumps to $107.45M, dominated by $79.19M in long liquidations versus $28.26M in shorts.

