


 11
11
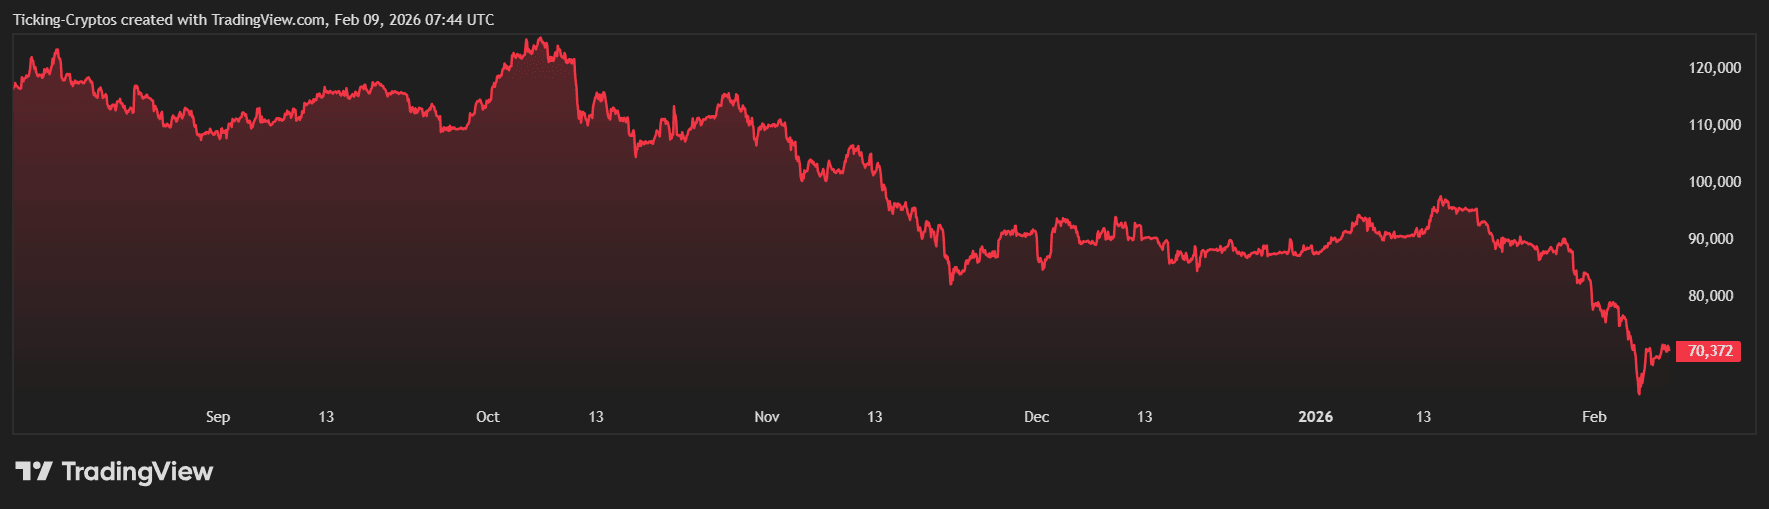
$Bitcoin has just witnessed one of its most turbulent weeks in recent history. After a brutal sell-off that saw the premier cryptocurrency plunge from the $80,000 range down to a terrifying low of $60,000, Bitcoin has staged a resilient comeback. As of today, February 9, 2026, Bitcoin is trading firmly above the $71,000 mark, signaling a potential stabilization phase.
Why is Bitcoin Price Moving Today?
The primary driver behind today's price action is a shift in market sentiment from "capitulation" to "accumulation." According to data from major financial outlets like Investopedia, institutional investors viewed the sub-$70,000 levels as a "second chance" to enter positions they missed during the 2025 rally to $126,000.
Key factors influencing the move include:
- Institutional Dip Buying: Large-scale buyers have stepped in to absorb the sell-side pressure from liquidated retail long positions.
- Macro Correlation: Bitcoin is recovering alongside the Dow Jones, which recently breached the 50,000 milestone, suggesting a return of risk-on appetite.
- ETF Inflows: Spot Bitcoin ETFs remain a cornerstone of support, with institutional holdings providing a floor against a total market collapse.
Bitcoin Technical Analysis: The Trader's View
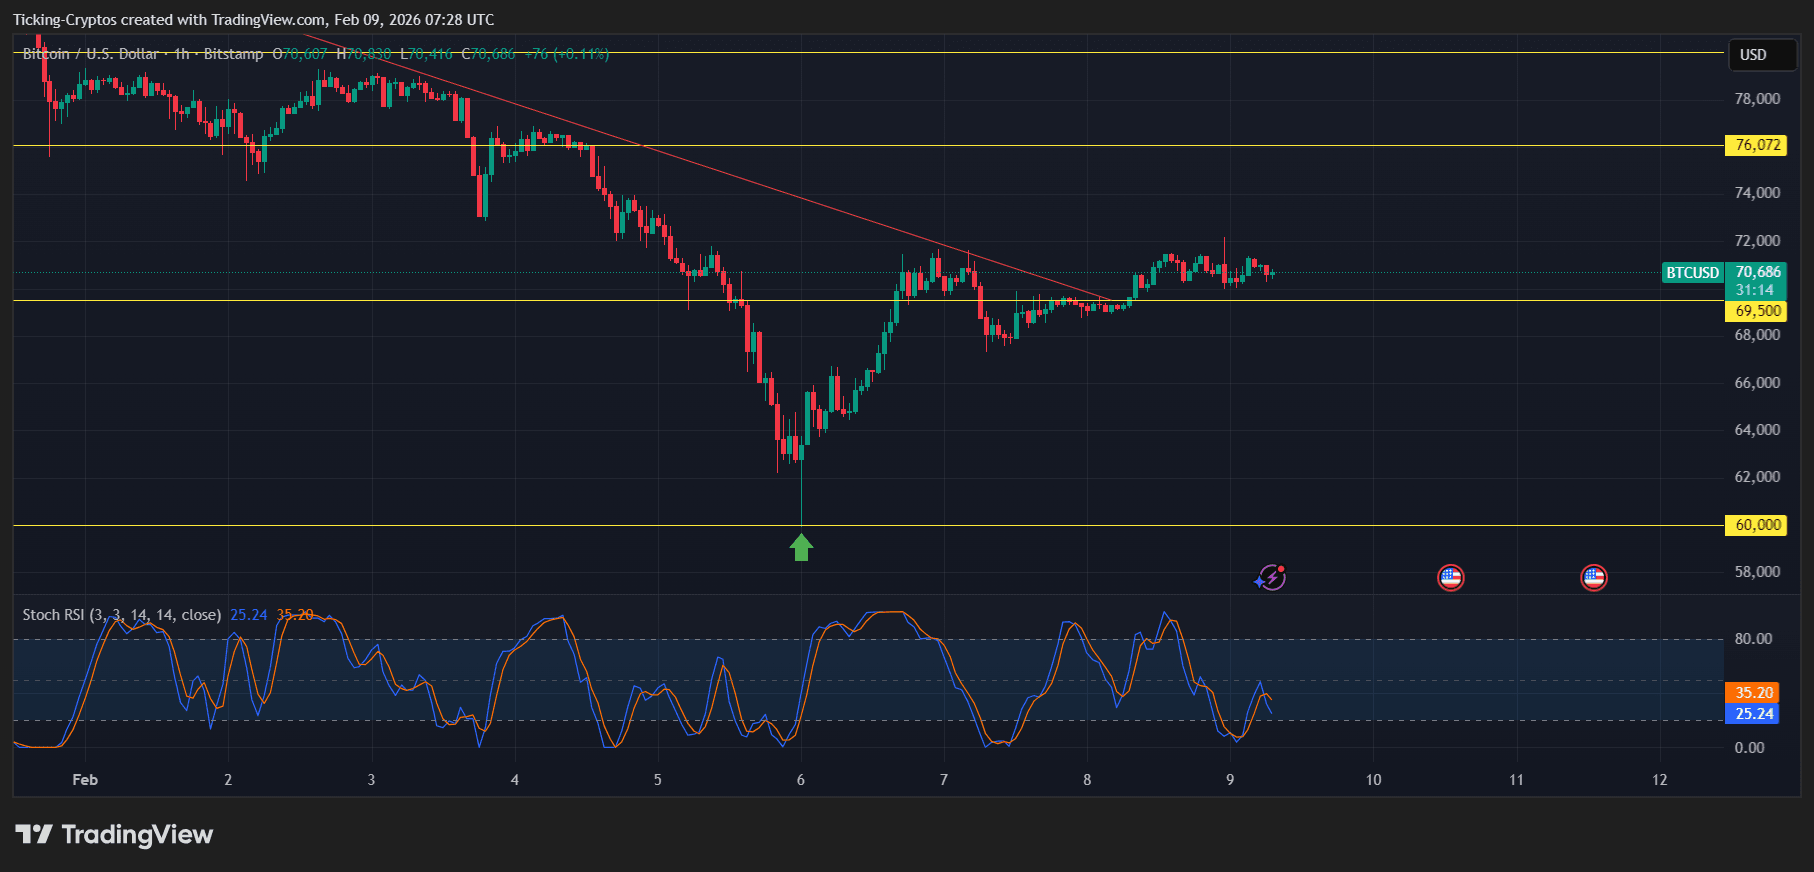
Looking at the current chart structure, Bitcoin is navigating a critical "recovery zone." After the flash crash on February 5th, the price created a sharp V-shaped recovery, a classic sign of aggressive buying at support.
Support and Resistance Levels
Based on the latest technical setup, traders should keep a close eye on these specific zones:
- Immediate Resistance ($74,000 - $75,000): This is the first major hurdle. A daily close above this level is required to invalidate the short-term bearish structure.
- Key Support ($67,000): This acted as a pivot point during the weekend. Staying above this level is crucial for maintaining the bullish momentum.
- The "Line in the Sand" ($60,000): This psychological and technical floor must hold. A break below this would likely trigger a deeper correction toward the 200-week moving average near $58,000.
Trader's Insight: The Relative Strength Index (RSI) recently bounced from oversold territory (under 30), which historically precedes a multi-week consolidation or a steady uptrend.
Suggested Trade Setups
For those looking to navigate this volatility, here are two potential scenarios based on current price action:
Scenario A: The Bullish Breakout (Long)
- Entry: $72,500 (Confirmation of support flip).
- Target: $79,000 - $81,000.
- Stop-Loss: Below $69,000.
- Rationale: This setup bets on the continuation of the institutional recovery and a return to the pre-crash range.
Scenario B: The Range Play (Scalp)
- Entry: Buy near $68,500 / Sell near $73,800.
- Rationale: If Bitcoin fails to break the $74k resistance, expect a sideways "crab" market as it builds liquidity for the next major move.
Should you Buy Bitcoin at $70K?
Bitcoin has survived a significant stress test. While the "flash crash" caused temporary panic, the underlying demand from institutional players remains intact. The coming days will be vital in determining if this is a "dead cat bounce" or the start of a journey back toward the $100,000 milestone.
