


 8
8
- The Bitcoin price shows a bullish rebound from $60,000 support to rebound bearish momentum before continuing the prevailing downtrend..
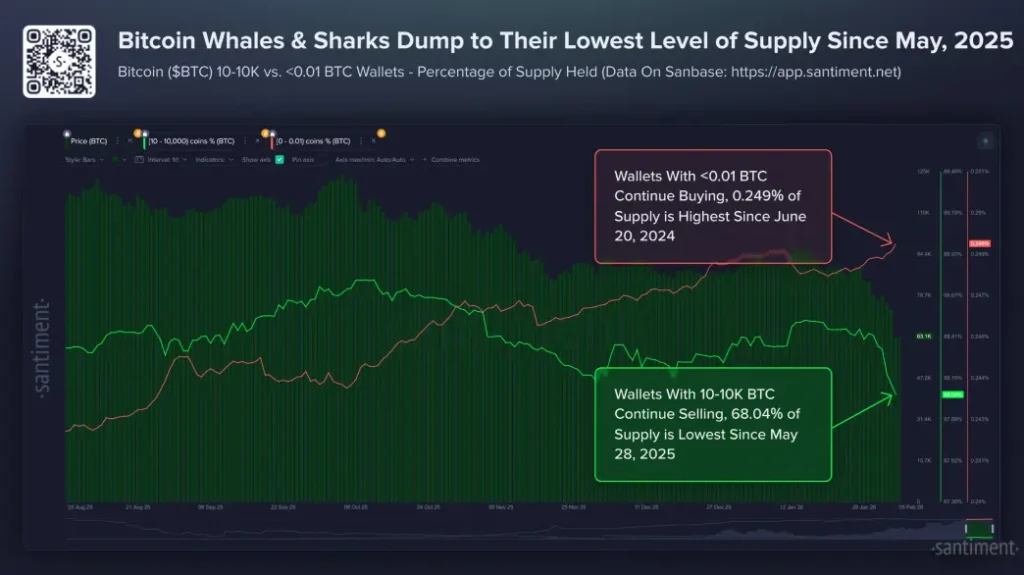
- Whale and shark wallets holding 10–10,000 $BTC now control 68.04% of supply, a nine-month low.
- Santiment analysis shows extreme bearish outlook as $BTC fear and greed index plunged to 9%.
The pioneer cryptocurrency Bitcoin jumps over 11.83% during Friday’s U.S. market hours to trade at $70,623. The buying pressure likely came as post-correction pullback, stabilizing the price action for after yesterday’s flash crash. Recent on-chain data shows that the retail investors continued to accumulate $BTC in this dip, but the large investors selling keep the risk of prolonged correction intact.
$BTC Crashes to Nine-Month Low Amid Whale Distribution
During the Asian market hours today, the Bitcoin price plunged to $60,000 mark, its lowest level since October 2024. The recent market correction, fueled by cascading liquidation and macroeconomic uncertainty, has lead to 50% loss in $BTC’s value since October 2025 peak of over $126,000.
In recent tweet, on-chain analytics platform Santiment highlights a definite change of holder behaviour behind part of the pressure. Wallets that have been identified as whales and sharks — wallets in possession of between 10 to 10,000 $BTC — have seen their collective control fall to 68.04% of the total supply, the lowest share in the last nine months.
This group unloaded about 81,000 $BTC in eight days up to the beginning of February, causing the increase in circulating supply and downward momentum. Recent snapshots reveal a mild lull in the aggressive selling, with the addition of only micronet amounts (3,800 $BTC in a day), but the overall trend is still one of distribution.
At the same time, smaller “shrimp” addresses (under 0.01 $BTC) have steadily grown to a 0.249% share of supply, which is the highest in around 20 months. This pattern reflects continued buying by retail participants in the dip despite the decline.
This redistribution (large holders divesting and smaller ones accumulating) is frequently consistent with prolonged periods of market softness in prior market cycles. Such dynamics can perpetuate weakness because concentrated entities have reduced exposure and wait for stronger signals to return. The divergence has coincided with factors such as deleveraging in the futures markets, outflows from institutional products and/or shifts to traditional safe-havens such as gold in the face of geopolitical and macroeconomic strains.
By February 6-7, Bitcoin achieved a volatile recovery, rising by more than 10% to trade in the area of $70,000 – $71,000, although still a long way down from the previous peaks, and with ongoing volatility.
Bitcoin Price Relief Rally May Reach $80,000 Before Next Leap
Following a temporary dip below $60,000, Bitcoin price witnessed a quick rebound of over 13.3% on Friday. With a significant spike in trading volume, the coin price managed to reclaim the $71,300 mark.
This uptick likely came as a post-correction relief rally as price tends to stabilize after an extreme move in a particular direction. The daily chart analysis of $BTC shows that the coin price could witness renewed selling pressure at $74,400, followed by $80,000.
The daily exponential moving averaged 20 and 50 could act a immediate pullback resistance against buyers.
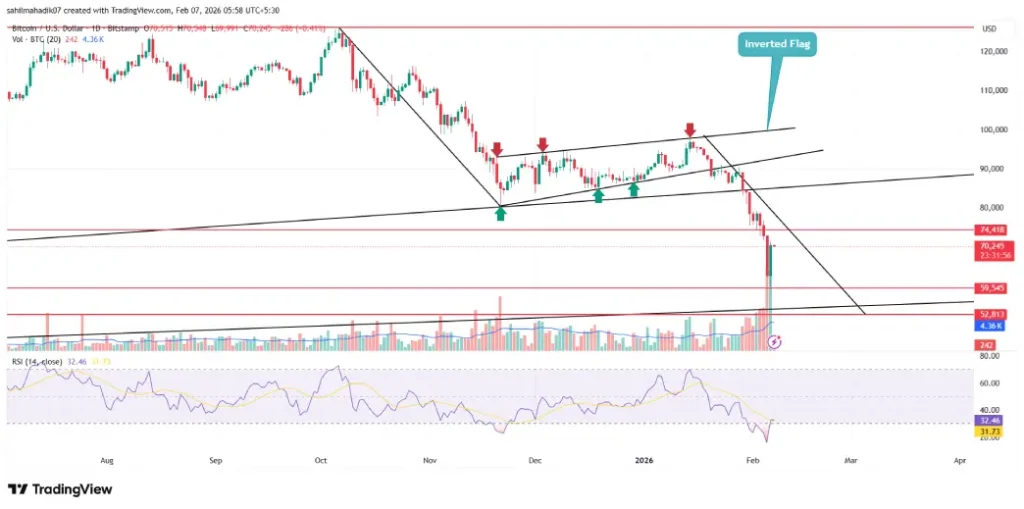
These overhead resistance could recoup the exhausted bearish momentum and set Bitcoin price for prolonged correction. The continued downtrend could rechallenge the $60,000 floor, and then $55,000.

