


 16
16
Bitcoin’s recent rebound has revived the buy-the-dip narrative, but the data tells a more complicated story. After falling nearly 15% and briefly touching the $60,000 zone, the Bitcoin price bounced more than 11%, drawing traders back into long positions.
At first glance, the bounce looks encouraging. However, bearish chart patterns, rising leverage, and fragile spot demand suggest the market may not be out of danger yet. With a potential 25% downside still in play, the latest bounce is now facing serious scrutiny.
Bear Flag, Rising Leverage, and Falling Exchange Supply Signal Risky Optimism
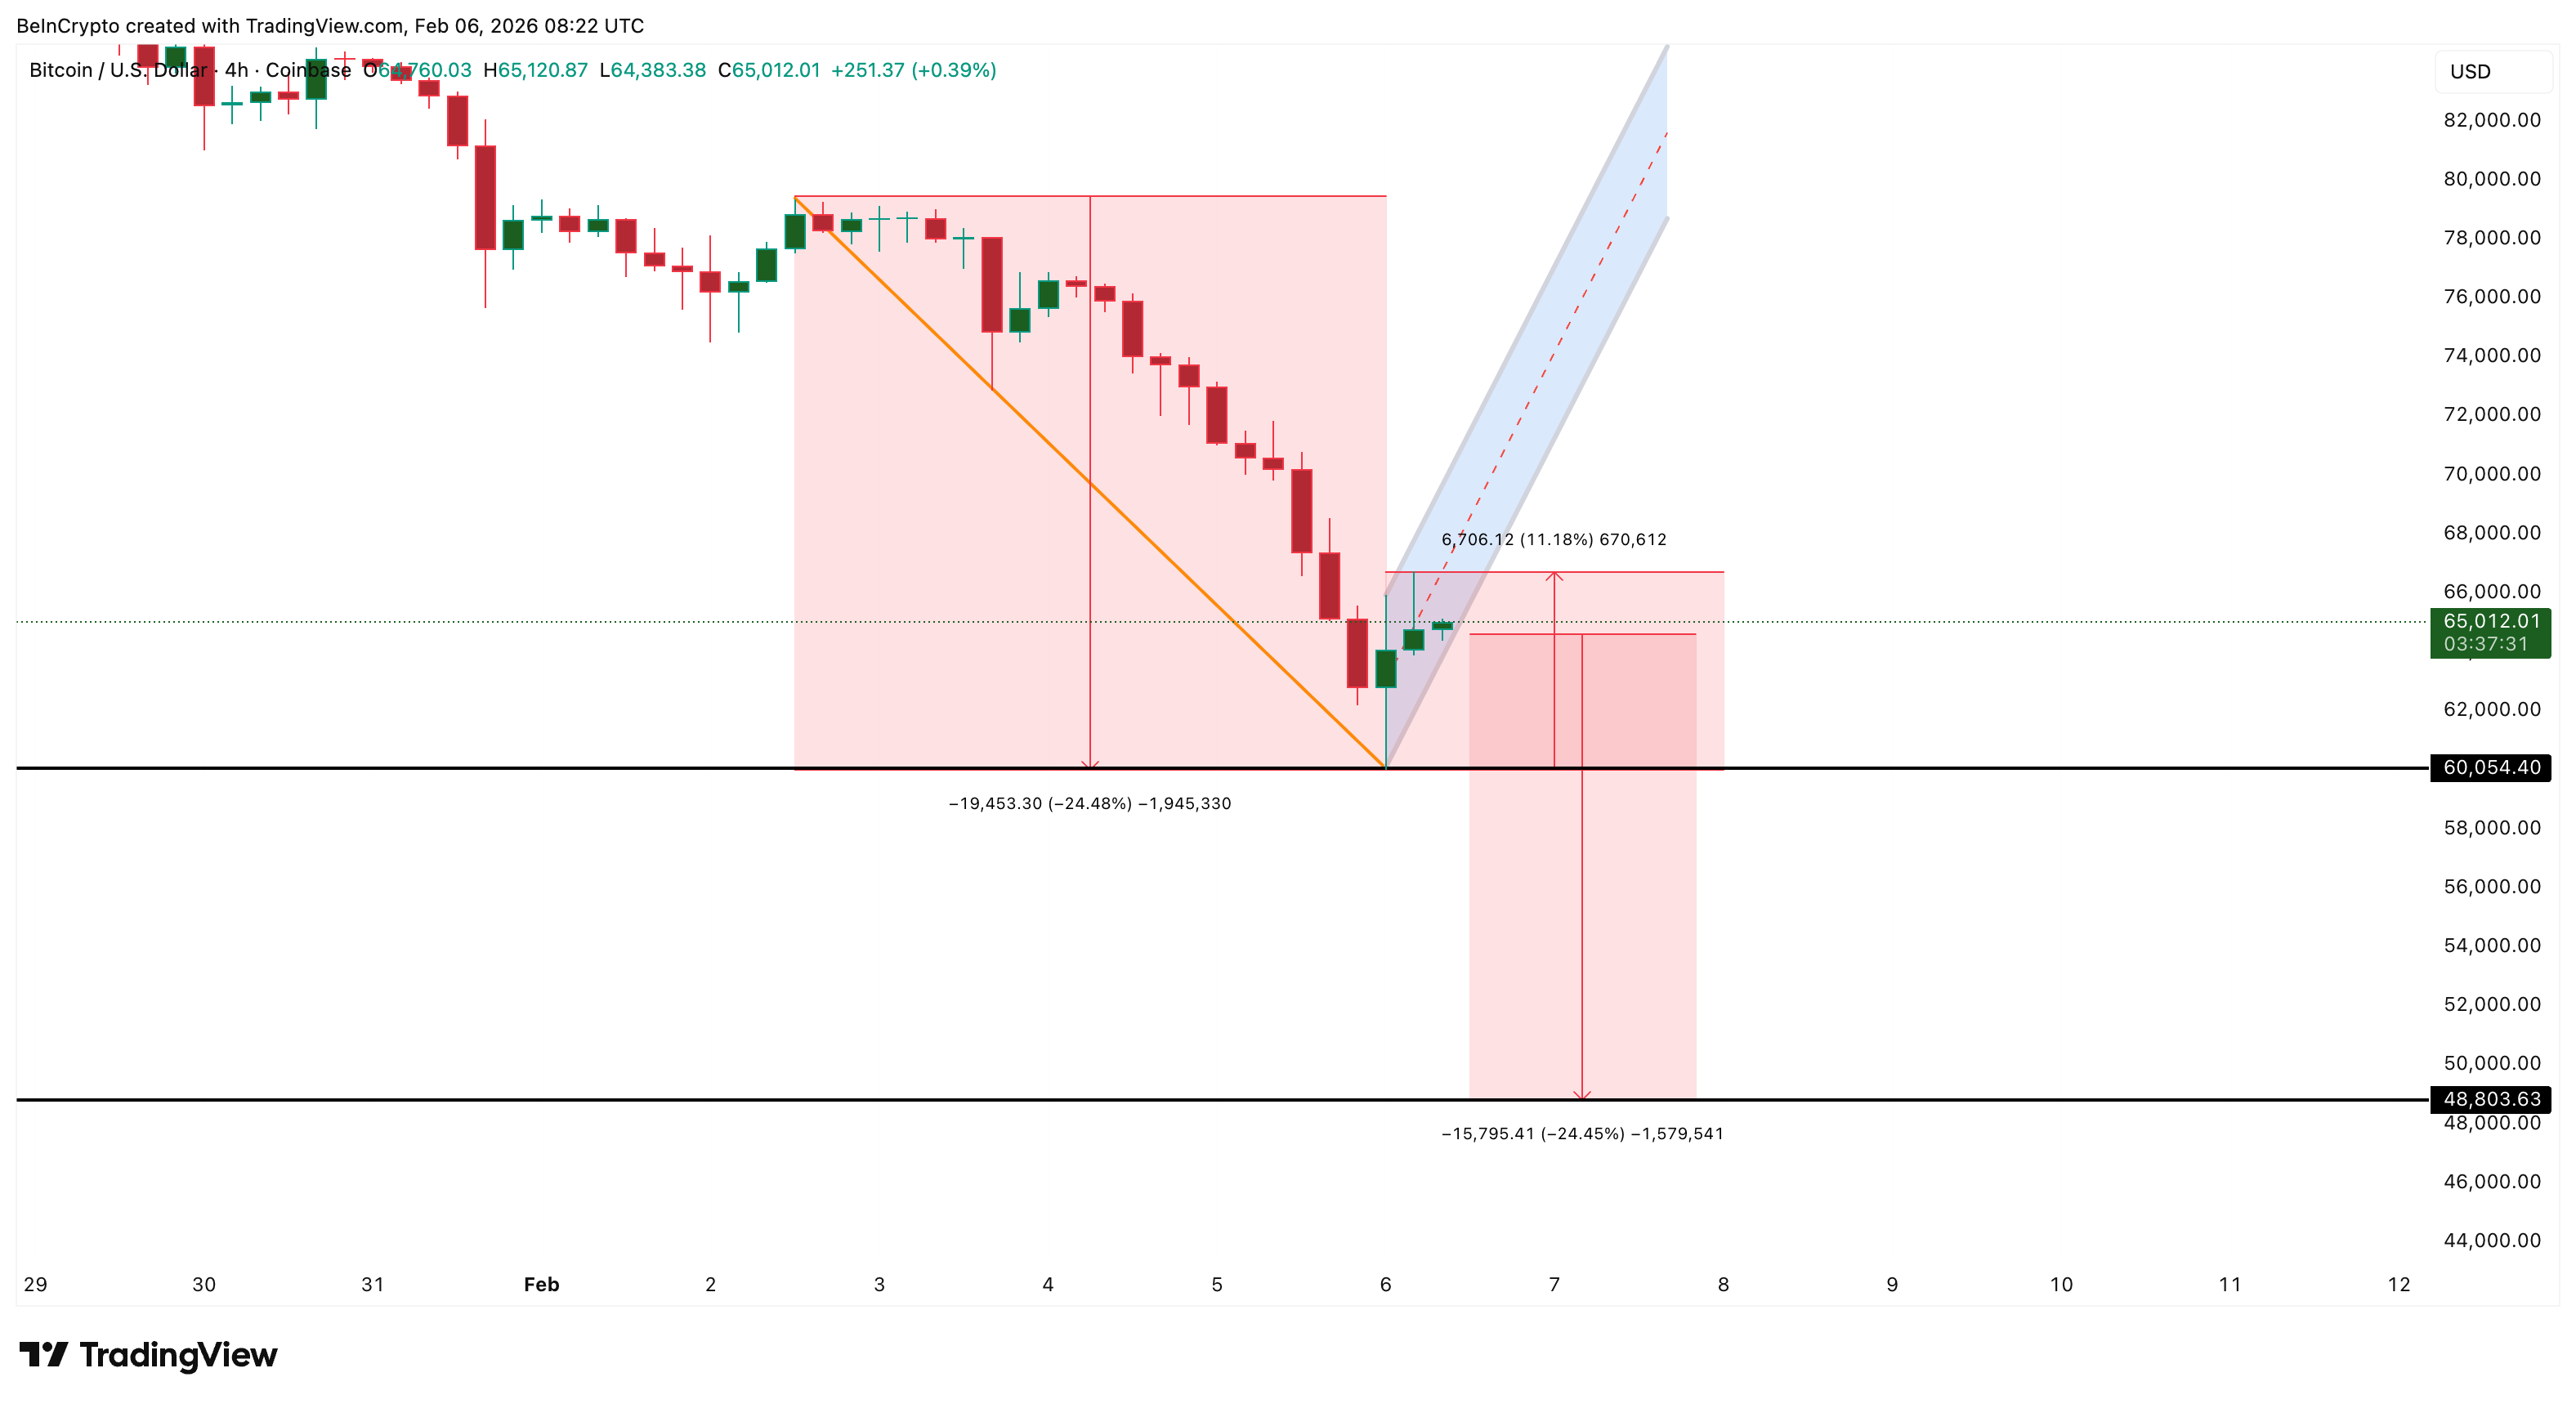
Bitcoin’s short-term risk is already visible on the 4-hour chart.
After the sharp sell-off toward $60,000, the Bitcoin price formed a rebound structure that now resembles a bear flag pattern. This setup typically appears when the price pauses after a strong drop before continuing lower. If the lower trendline breaks, the pattern points to a downside move of nearly 25%, targeting the $48,000–$49,000 zone.
Want more token insights like this? Sign up for Editor Harsh Notariya’s Daily Crypto Newsletter here.
 $BTC Structure">
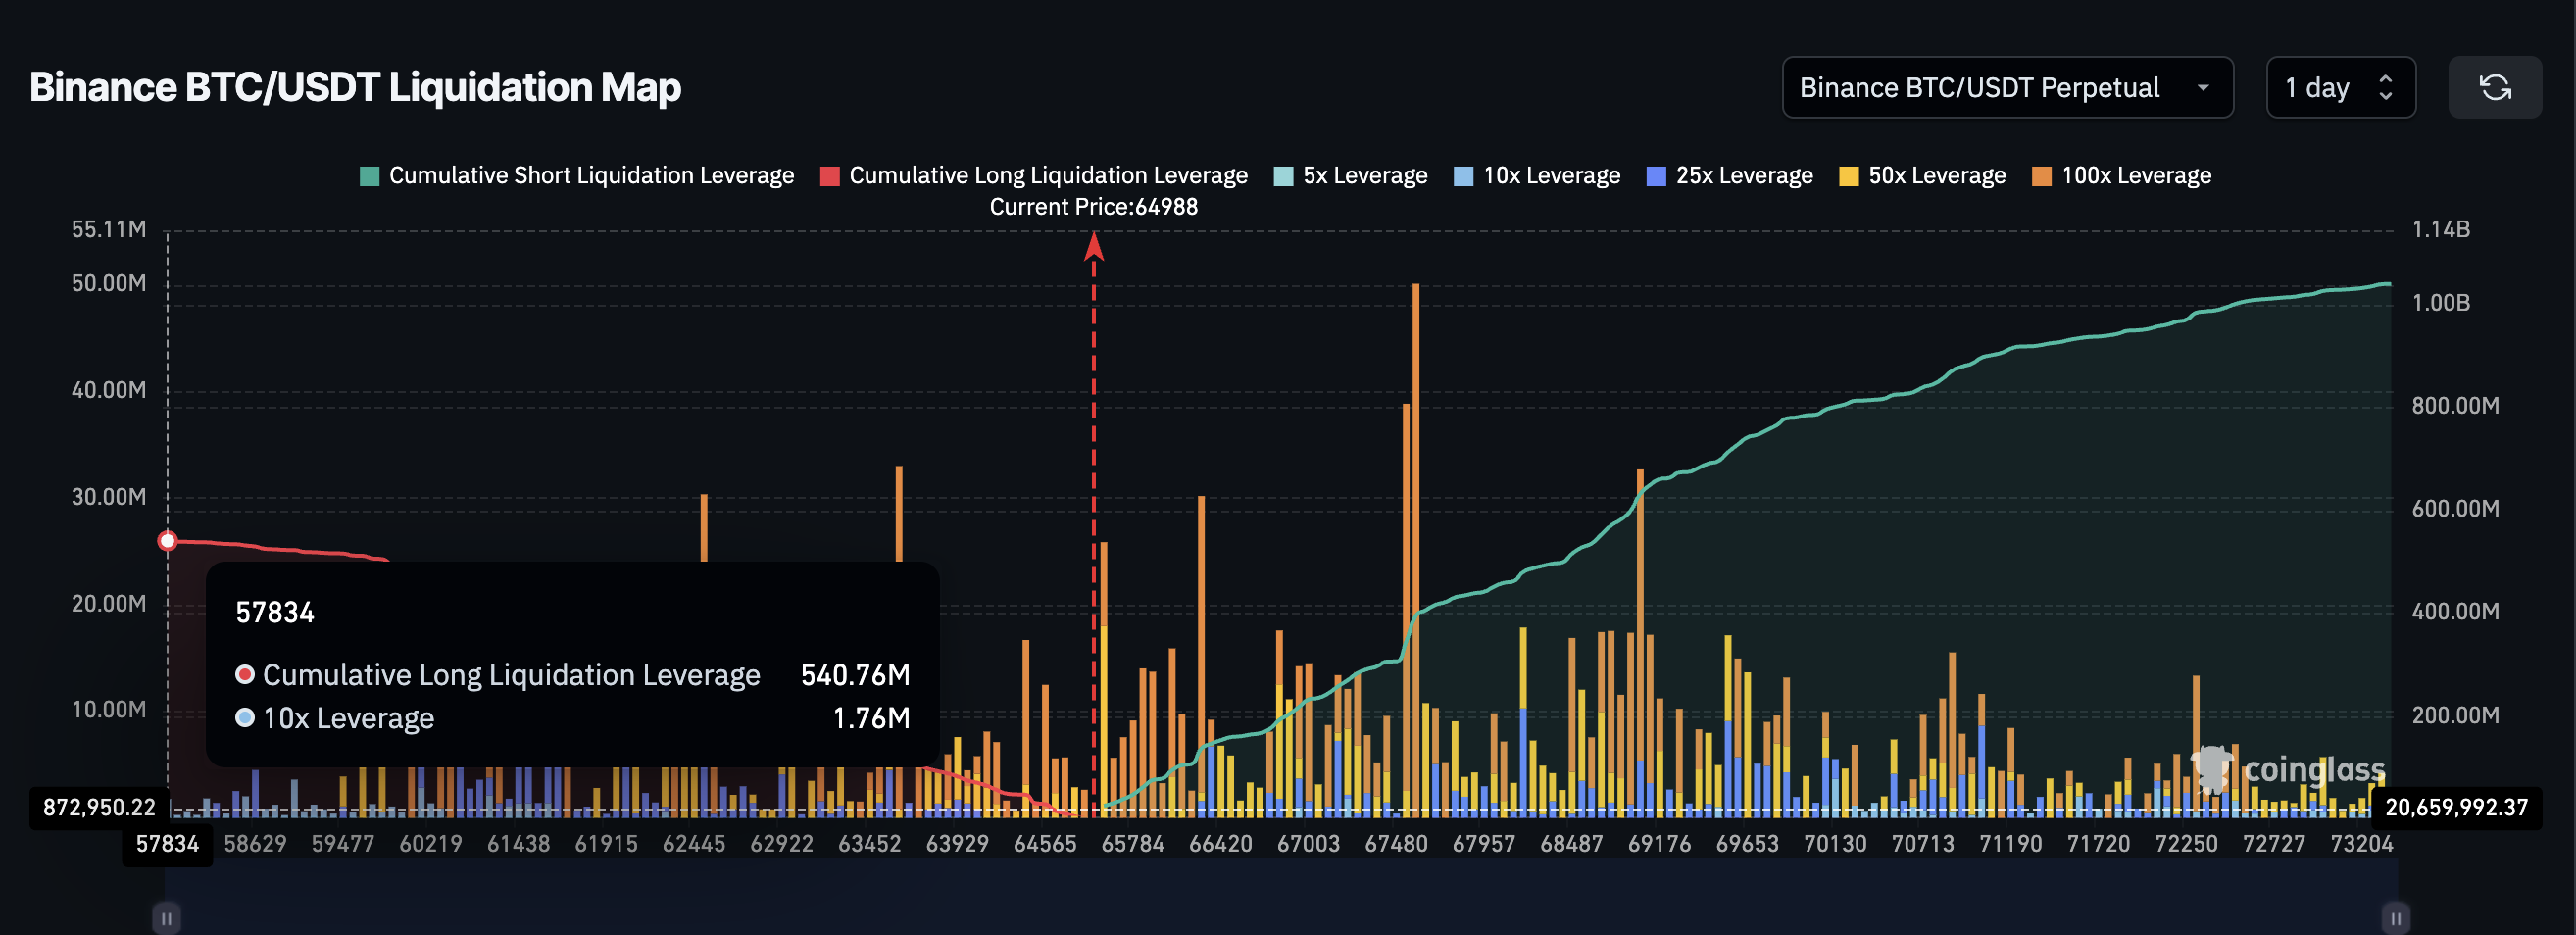
Despite this technical warning, leverage is rising again.
Following the 11.18% rebound, more than $540 million in new long positions were built on Binance alone. This shows that traders are once again using heavy leverage, betting that the bottom is already in. Similar behavior has preceded major liquidations in past downturns.
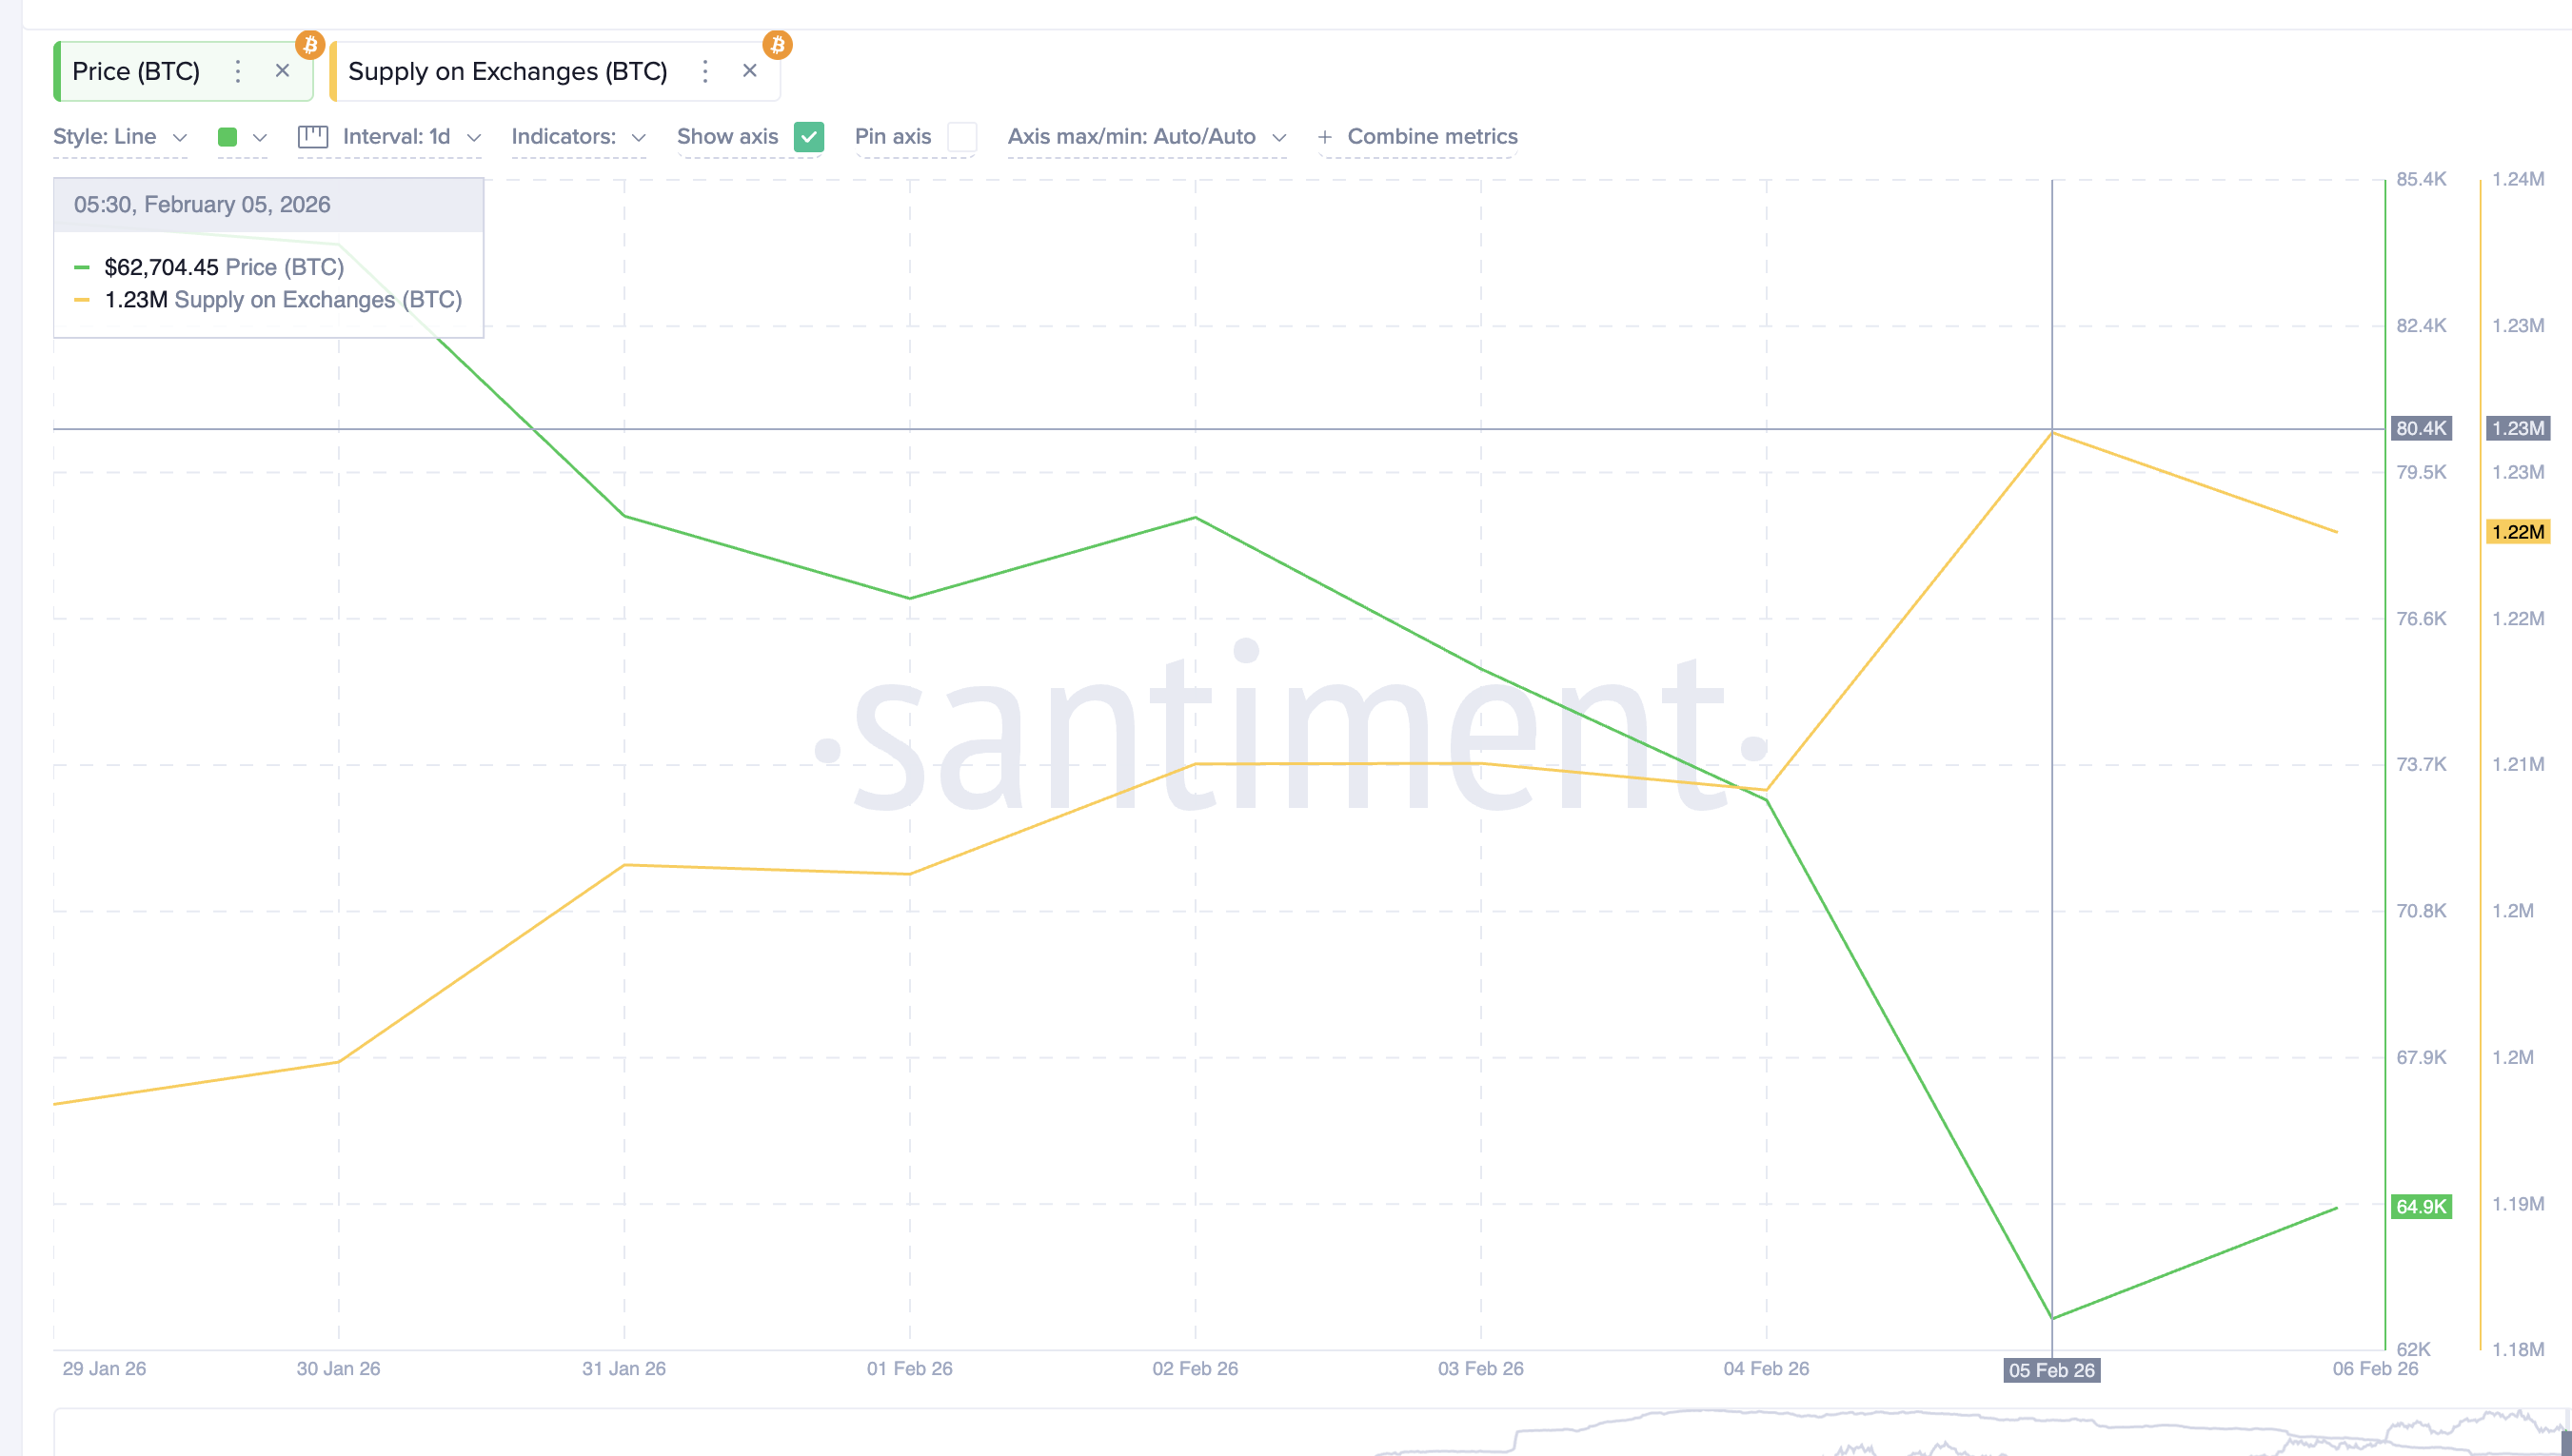
At the same time, spot market behavior reflects a growing buy-the-dip mindset.
Bitcoin supply on exchanges fell from around 1.23 million $BTC to 1.22 million $BTC between February 5 and February 6. This decline suggests that traders are withdrawing coins, possibly for short-term holding, expecting higher prices.
Public figures and social media sentiment have also turned more optimistic, reinforcing the ‘Buy-the-Dip’ narrative.
Buying $2,000,000 of btc at 67,000.
— Andrew Tate (@Cobratate) February 5, 2026
Bookmark this.
Together, these signals possibly show misplaced confidence.
A fragile chart pattern, rising leverage, and early dip buying are forming at the same time. When optimism builds before structural weakness is resolved, downside risk often increases rather than fades.
Long-Term Holders Keep Selling as Realized Price Support Comes Into Focus
While short-term traders are turning bullish, long-term holders, the most stable folks, are moving in the opposite direction.
The Long-Term Holder Net Position Change, which tracks the 30-day supply shift among investors holding for more than one year, has remained deeply negative since early January. On January 6, this metric showed net selling of around 2,300 $BTC. By February 5, that figure had worsened to roughly 246,000 $BTC.
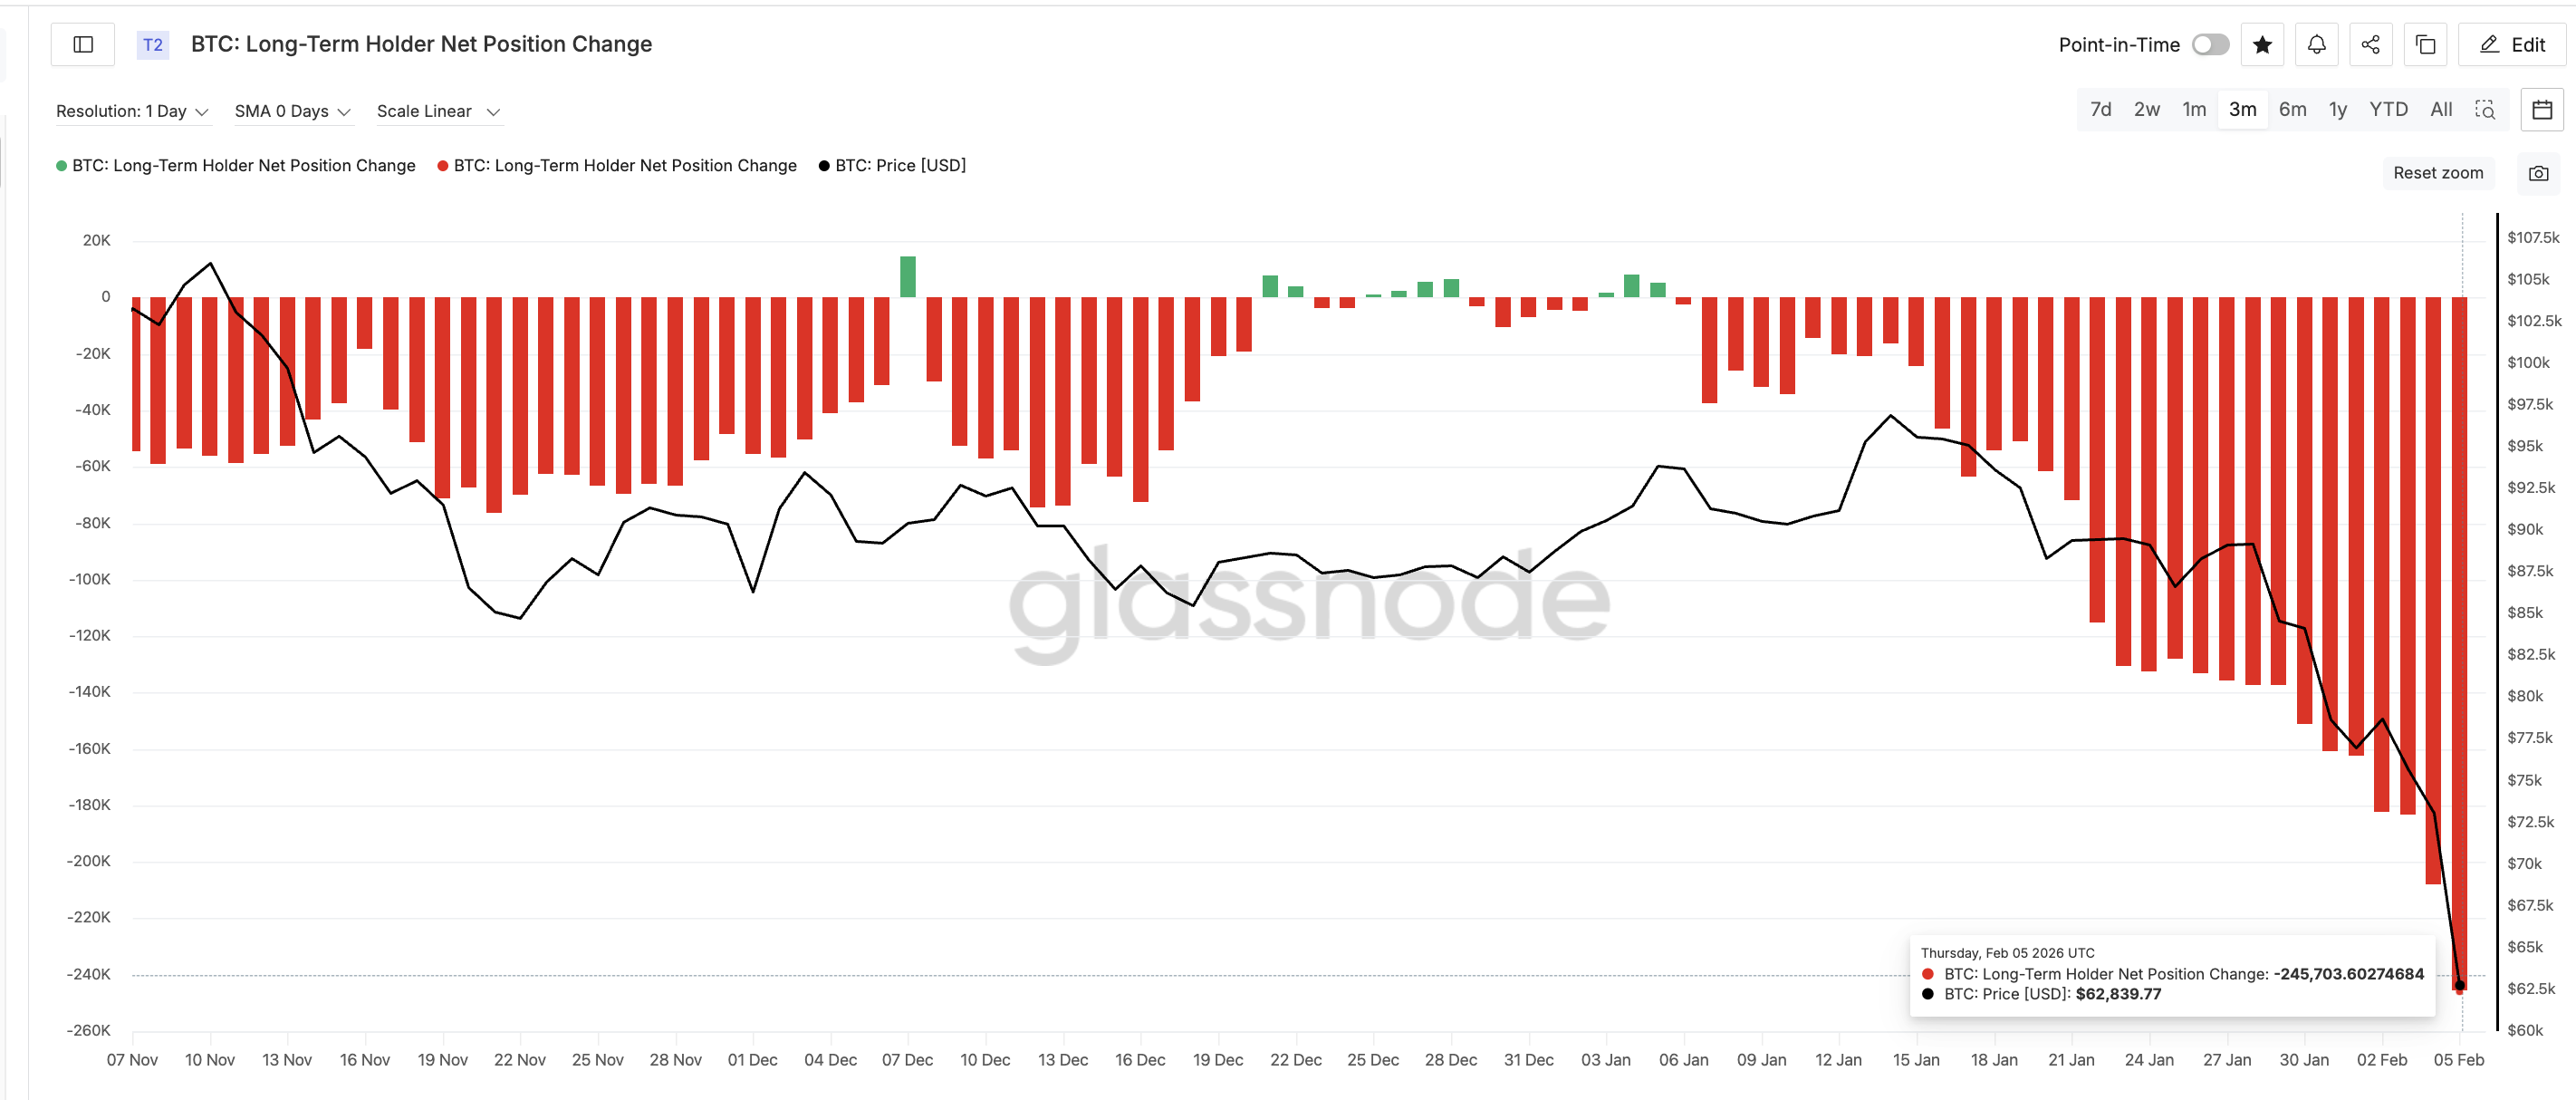
This represents a nearly 10,500% increase in long-term distribution in just one month. In simple terms, the most conviction-driven investors are still reducing exposure.
This behavior becomes more concerning when combined with the long-term holder realized price.
The realized price represents the average acquisition cost of coins held by long-term investors. Historically, when Bitcoin approaches or falls below this level, it signals deep market stress. In past cycles, major rallies only began after the price stabilized around this zone; however, not immediately.
Currently, the long-term holder realized price sits near $40,260.
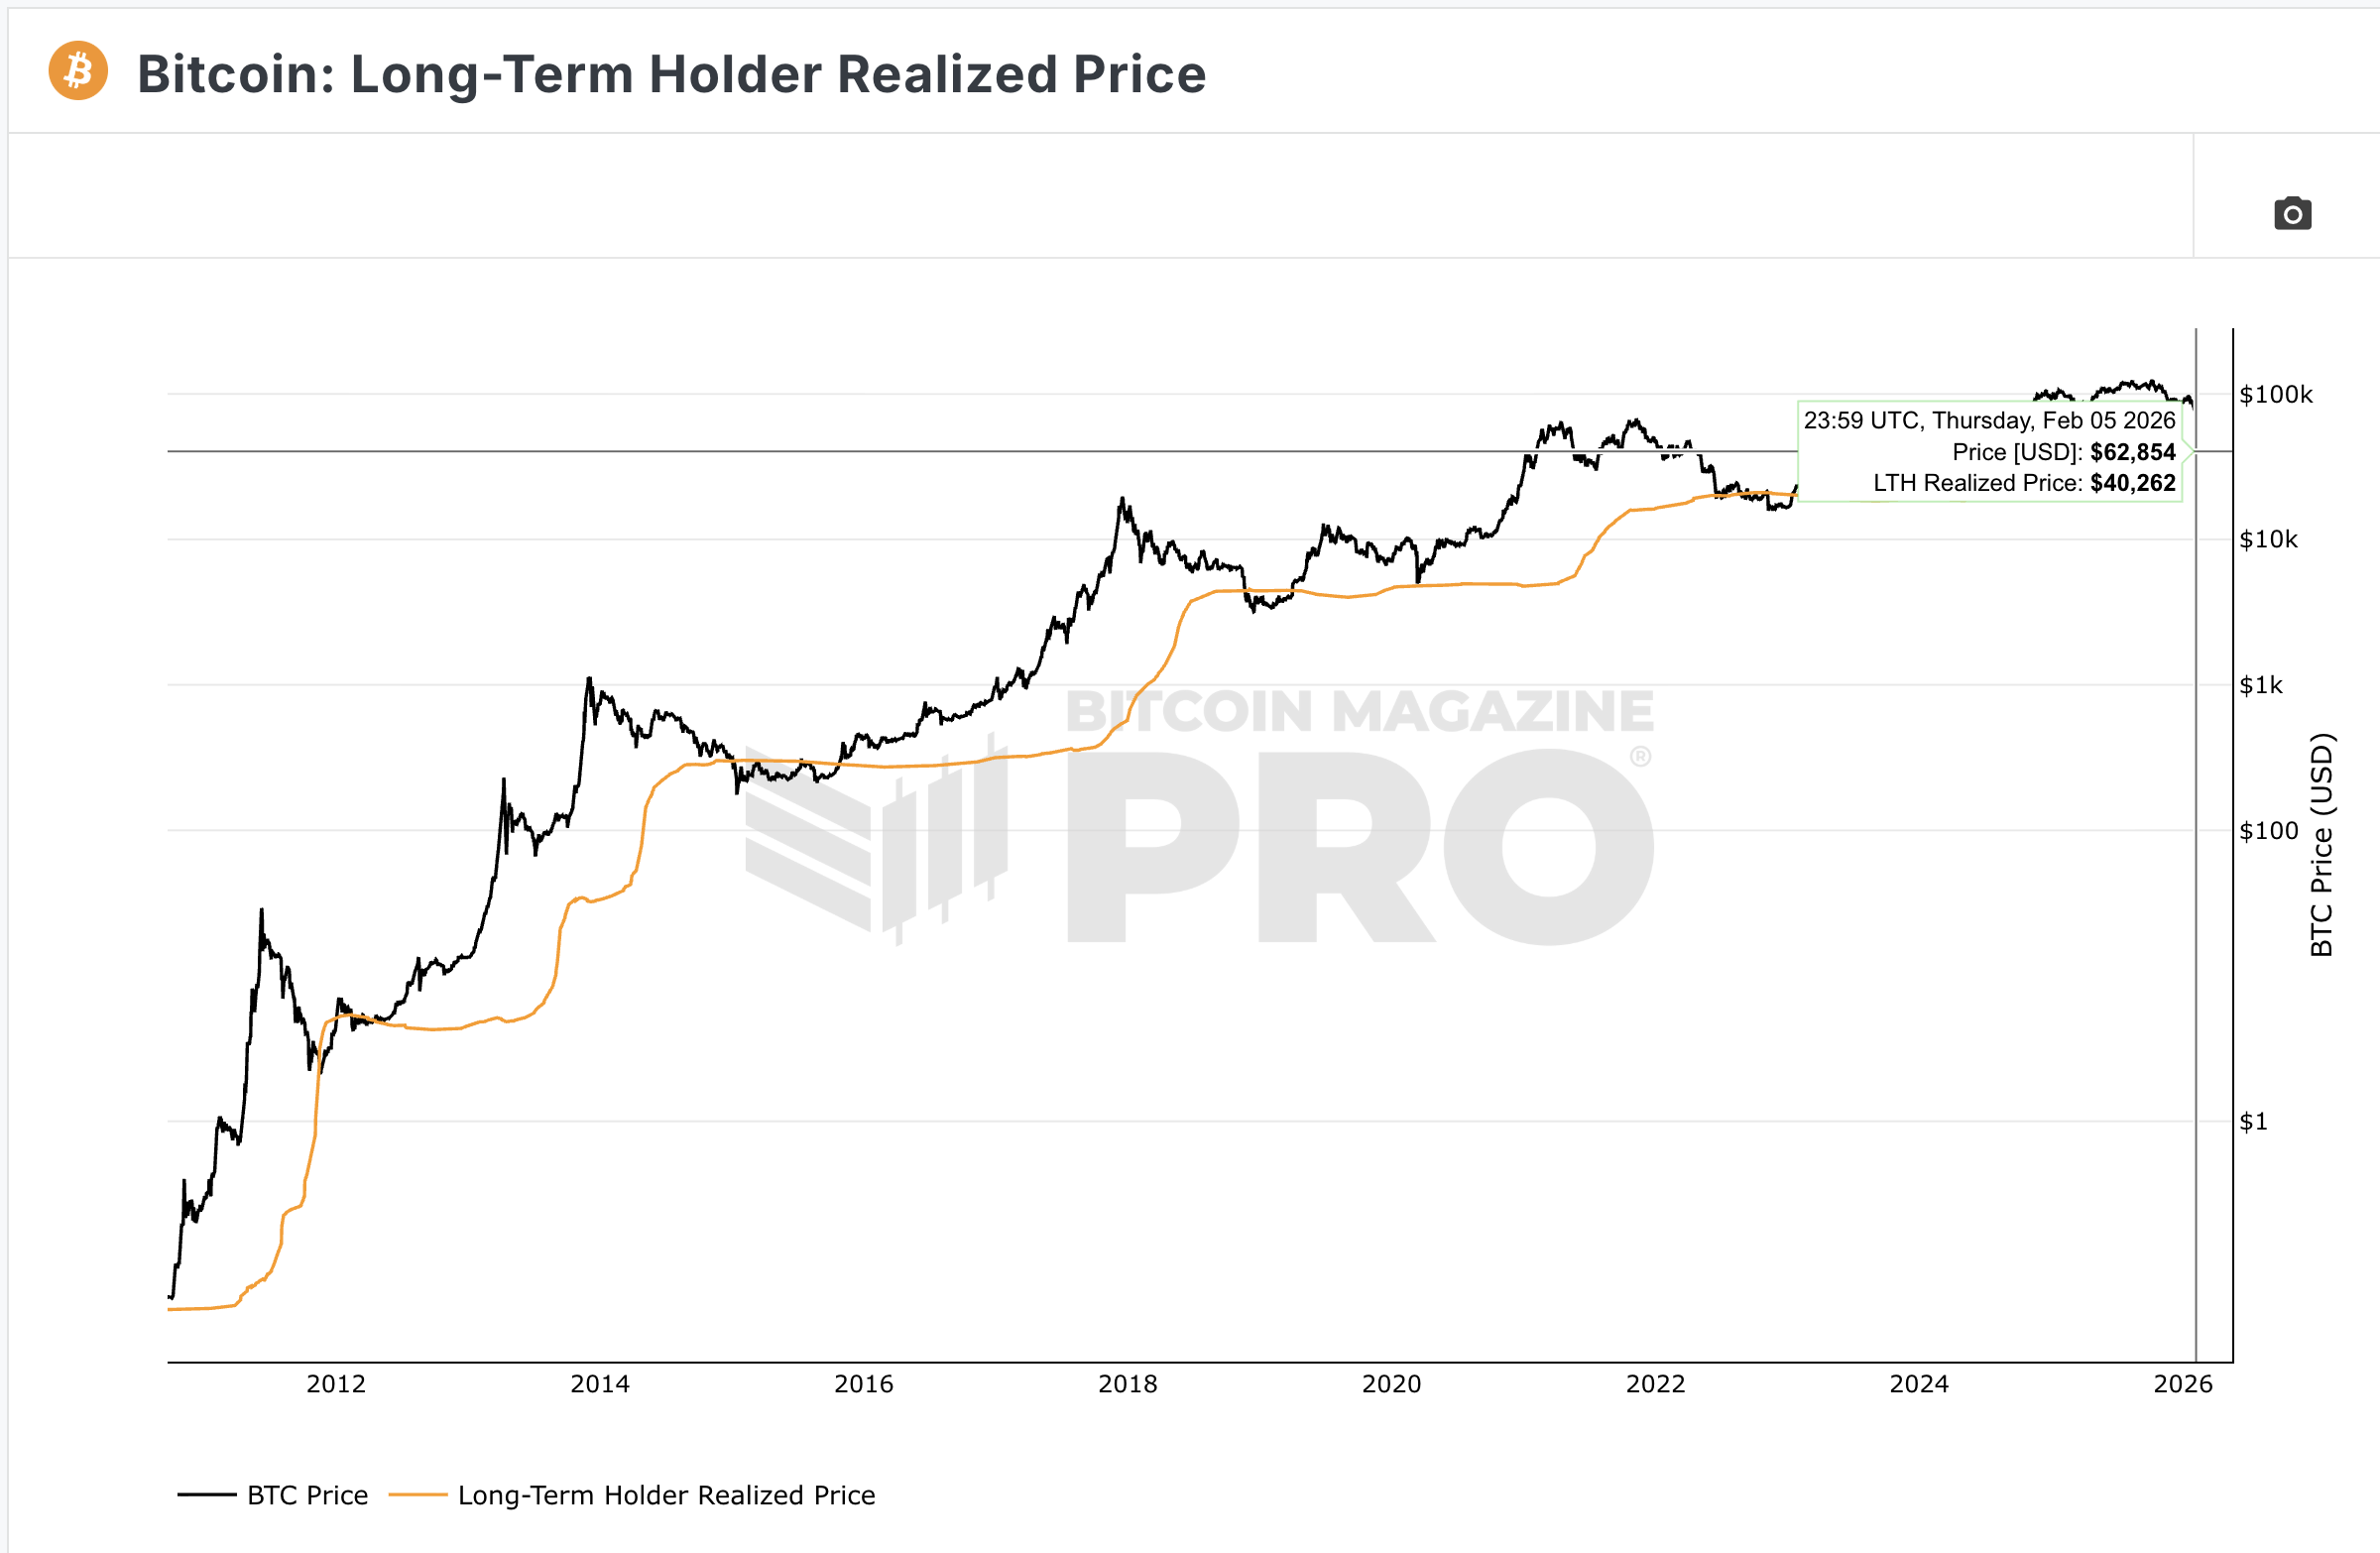
As Bitcoin moves closer to this level, more long-term investors approach breakeven. If the price drops below it, many enter losses, often accelerating capitulation. This dynamic played out in late 2022 before the final bear market bottom formed.
So far, that reset has not happened.
Long-term holders are still selling, not accumulating. Their realized price is becoming a key downside magnet. This suggests the market has not completed its full deleveraging and redistribution phase.
Key Bitcoin Price Levels Show Why $48,000 and $40,000 Matter Next
All technical and on-chain signals now converge around a few critical price zones.
On the downside, the first major support sits near $53,350. A failure here would expose the $48,800 region, which aligns with the bear flag target and prior consolidation zones.
If $48,800 breaks, attention shifts to the long-term holder realized price near $40,260.
This zone represents the deepest structural support in the current cycle. A move into this region would indicate broad capitulation among long-term investors and confirm a deeper bear phase.
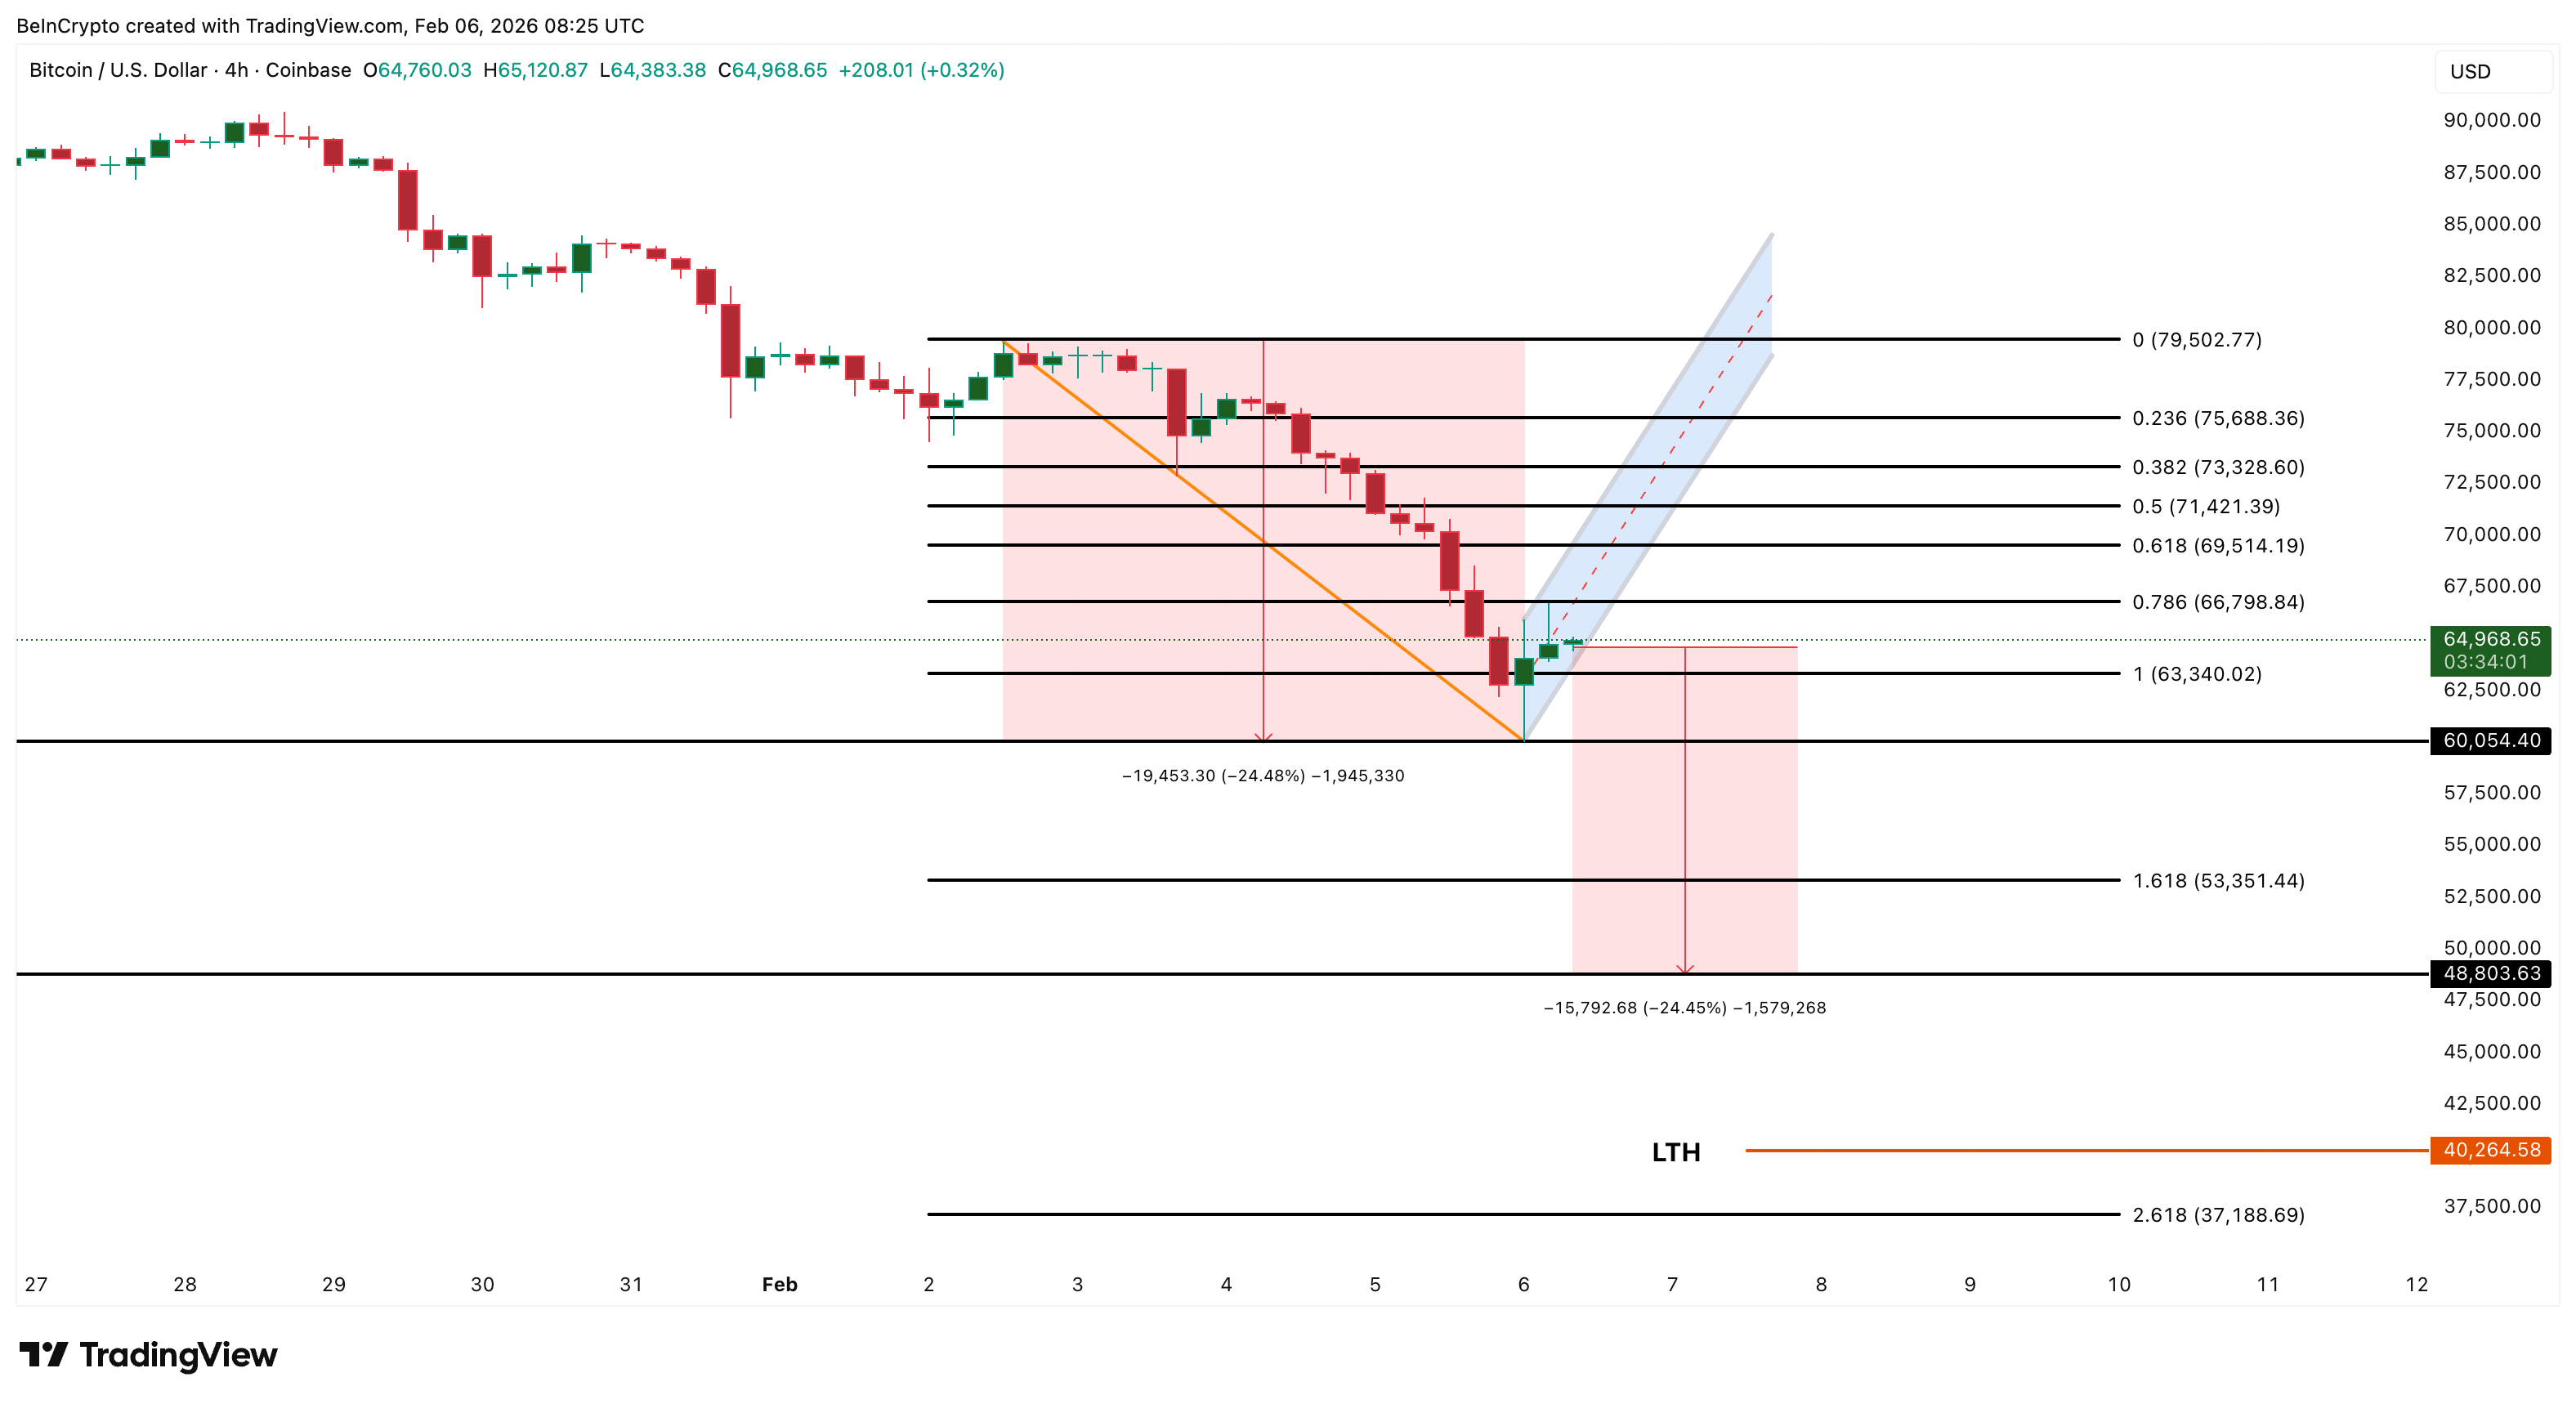
In a worst-case scenario, extended weakness could even open the door toward $37,180, based on longer-term projections and historical support clusters.
On the upside, Bitcoin must reclaim $69,510 on a sustained 4-hour closing basis to regain short-term credibility. A move above $73,320 would be required to invalidate the bearish pattern.
Until that happens, rallies remain vulnerable.
With leverage rebuilding, long-term holders still selling, and critical support levels approaching, the current rebound lacks structural confirmation. Under these conditions, buy-the-dip strategies remain exposed to sharp reversals rather than sustained upside.
The post Bitcoin’s ‘Buy-the-Dip’ Narrative Faces Tough Questions as Another 25% Risk Builds appeared first on BeInCrypto.
