


 7
7
After a violent washout across crypto markets, traders are watching the Bitcoin price today for signs of whether this is a late-stage flush or the start of a deeper leg lower.
Summary
Bitcoin price today: where we are
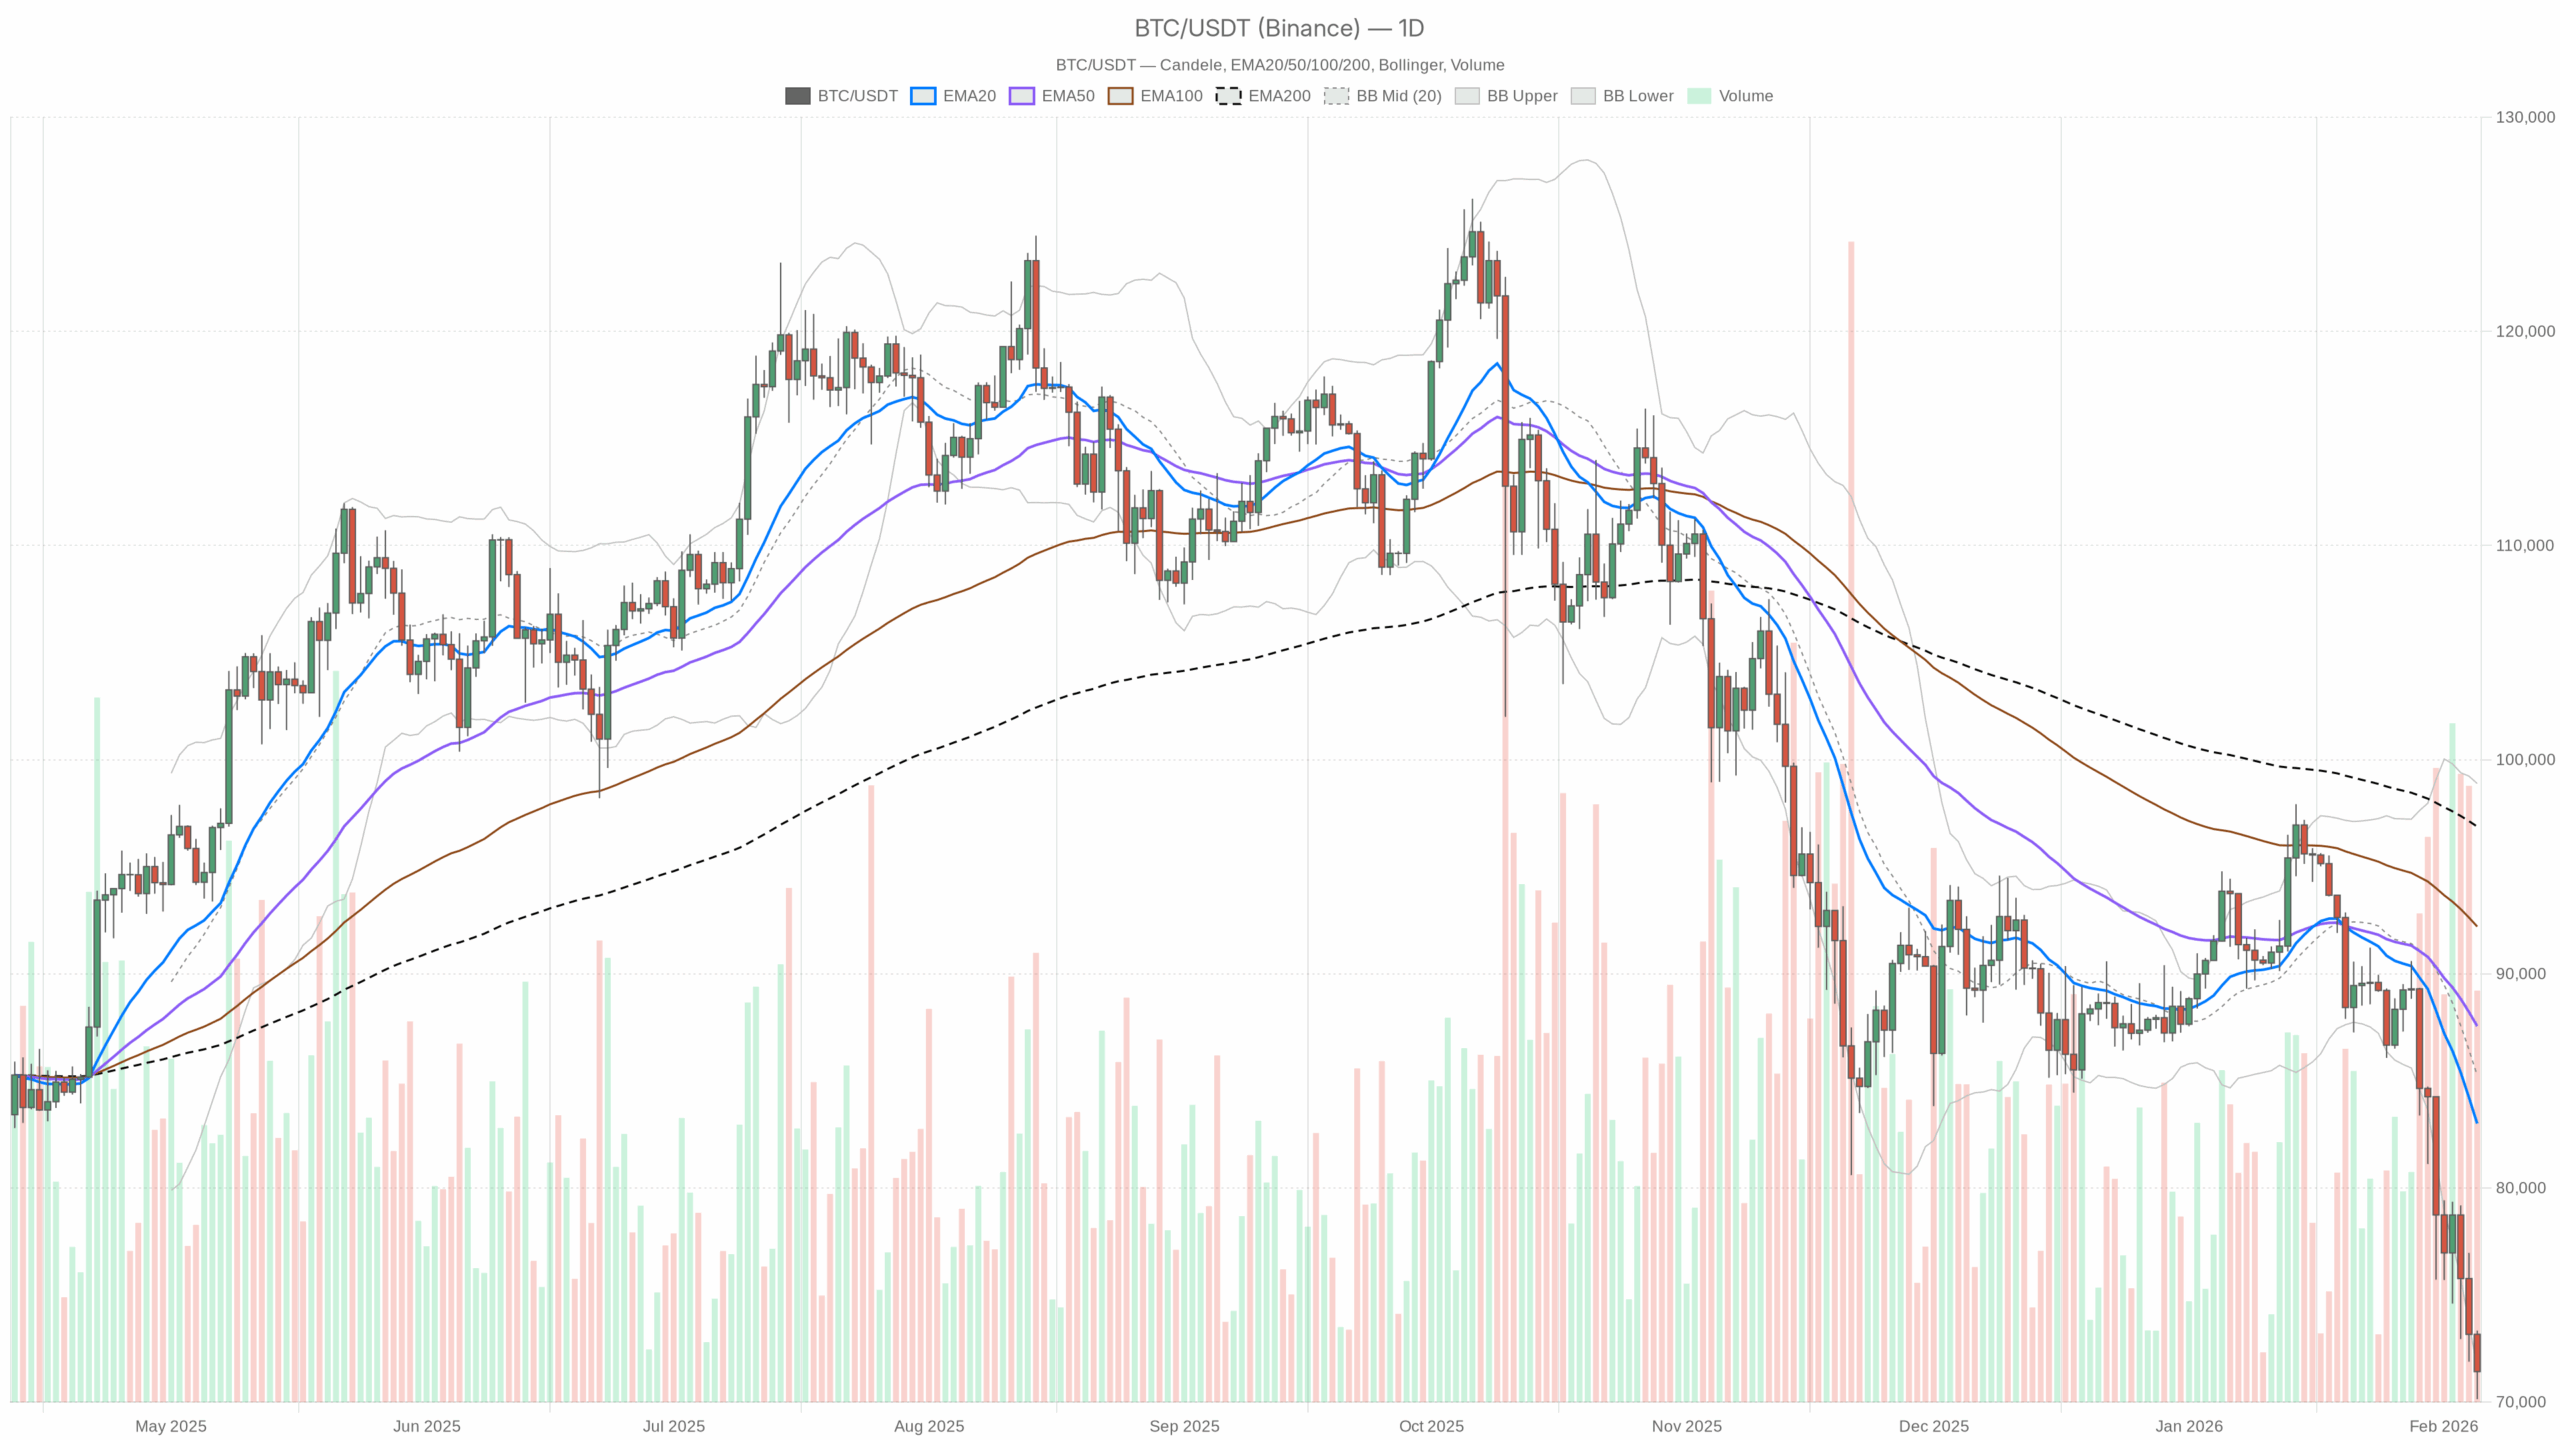
Bitcoin (BTCUSDT) is trading around $71,400–71,500 after a brutal washout that has knocked total crypto market cap down more than 5% in 24 hours and roughly half a trillion dollars over the past week. $BTC dominance is back near 57%, which tells you this is a Bitcoin-led risk-off move, not just random altcoin noise.
The backdrop is simple: the market is in an extreme fear phase (fear & greed index at 12) with mainstream headlines talking about a “crisis of faith.” That is the kind of sentiment you usually see after big drawdowns, not before them. The key question now is whether we are entering a deeper distribution phase or a late-stage flush that will set up a larger bounce.
On the higher timeframe (daily), the main scenario is firmly bearish. The structure is trending down, momentum is oversold, and price is trading well below all key moving averages. On the lower timeframes, however, the bleeding has slowed; the 1H and 15M show the very early stages of potential mean reversion, but nothing more than that for now.
Daily chart (D1): primary trend & main thesis – clearly bearish
Main scenario: Bearish
The daily chart defines the macro bias, and there the message is clear: $BTC is in a strong downtrend, currently hovering just above the lower edge of its recent volatility envelope.
EMAs (trend structure)
- Price (close): $71,426.69
- EMA 20: $83,006.95
- EMA 50: $87,558.81
- EMA 200: $96,876.82
- Regime flag: bearish
Interpretation: $BTC is trading far below all major EMAs, with the 20, 50 and 200-day stacked firmly above price. That is classic bear-trend anatomy. The distance to the 20-day EMA (~$11,500 above) is wide enough to call this move extended: trend is down, but we are also stretched away from mean value. That combination is where sharp, counter-trend bounces often originate. However, until price starts reclaiming at least the 20-day EMA, any bounce is just a rally within a downtrend.
RSI 14 (momentum & exhaustion)
- RSI 14: 21.28
Interpretation: Daily RSI in the low 20s signals heavy downside momentum but also short-term exhaustion. Sellers have clearly been in control, yet readings this low historically do not persist for long without either a volatility spike lower (final flush) or a sharp rebound. In other words, the trend is bearish, but we are entering territory where chasing shorts blindly becomes dangerous.
MACD (trend momentum)
- MACD line: -4,466.03
- Signal line: -2,755.38
- Histogram: -1,710.65
Interpretation: MACD is deeply negative with the line well below the signal and the histogram strongly red. This is consistent with an established downtrend that has picked up speed recently. There is no sign of a daily bullish cross or clear histogram contraction yet, so from a daily standpoint, the impulse is still down even if conditions are technically oversold.
Bollinger Bands (volatility & positioning)
- Middle band (20SMA proxy): $85,250.41
- Upper band: $98,889.72
- Lower band: $71,611.11
- Price: $71,426.69 (just below the lower band)
Interpretation: Price is essentially pinned to the lower Bollinger Band, slightly outside it. That is what strong trend legs look like, but it is also where you start to see mean-reversion traders stepping in. Sustained closes below the band would signal panic-style selling and open the door to a sharper leg down. A quick snap back inside the band would confirm the idea of a capitulation flush being bought.
ATR 14 (volatility)
- ATR 14: $3,868.60
Interpretation: A daily trading range of roughly $3,868 tells you volatility is elevated but not at “full capitulation” extremes seen in past crashes. There is enough range for intraday traders to operate, but this is still relatively controlled selling. If ATR spikes further while price breaks below $70,000, that is the kind of environment where downside moves can overshoot all levels.
Daily pivots (near-term map)
- Pivot point (PP): $71,635.96
- Resistance 1 (R1): $73,131.91
- Support 1 (S1): $69,930.73
Interpretation: $BTC is trading just below the daily pivot, effectively in a tug-of-war zone. R1 at roughly $73,100 is the first meaningful intraday ceiling for any bounce. On the downside, S1 around $69,900 is the immediate line in the sand. A decisive daily close below there would confirm continuation of the bearish daily trend and likely bring $68,000 and then the mid-$60,000s onto the radar.
1-hour chart (H1): bears in charge, but momentum is fraying
The hourly chart remains aligned with the daily trend: still bearish. However, intraday momentum is starting to show the earliest signs of stabilizing.
EMAs (short-term trend)
- Price (close): $71,481.87
- EMA 20: $72,335.23
- EMA 50: $74,227.70
- EMA 200: $79,385.47
- Regime flag: bearish
Interpretation: On H1, price is trading below all three EMAs, with the 20 under the 50 and both well under the 200. Intraday trend is down, and rallies into the 20/50 EMA zone (~$72,300–74,200) are likely to face selling pressure. For bulls, the first thing they need is to reclaim the 20 EMA and hold above it. Until that happens, every uptick is suspect.
RSI 14 (intraday momentum)
- RSI 14: 37.05
Interpretation: Hourly RSI has crawled up from oversold to the high 30s. Sellers are still in control, but the immediate downside pressure has eased. This is classic “bearish but no longer falling off a cliff” behavior, which is fertile ground for choppy consolidation, short-covering bounces, or both.
MACD (short-term momentum shift?)
- MACD line: -1,126.29
- Signal line: -1,177.92
- Histogram: +51.63
Interpretation: MACD is still negative, but the histogram has flipped slightly positive as the MACD line edges above the signal line. That is an early sign that the downside momentum is stalling and may be trying to reverse on the 1H timeframe. Importantly, this is a counter-trend signal against a clearly bearish daily trend. It often leads to a bounce into resistance rather than a full trend change.
Bollinger Bands (intraday volatility)
- Middle band: $72,255.31
- Upper band: $74,503.77
- Lower band: $70,006.85
- Price: $71,481.87 (between mid and lower band)
Interpretation: Price has backed away from the lower band and is now drifting in the lower half of the band range. The prior band ride lower is cooling off, which fits with the MACD and RSI story: still weak, but not in free fall. The $70,000 zone aligns closely with the lower band and daily S1, reinforcing it as a key intraday support cluster.
ATR 14 (intraday volatility)
- ATR 14: $992.57
Interpretation: An average hourly range of about $1,000 is elevated but manageable. It points to active two-way trading with meaningful intraday swings, which is ideal for short-term traders but punishing for over-leveraged positions.
Hourly pivots
- Pivot point (PP): $71,481.04
- Resistance 1 (R1): $71,650.63
- Support 1 (S1): $71,312.27
Interpretation: Price is sitting almost exactly on the hourly pivot. That tells you the short-term tape is undecided after the recent drop. A sustained move above R1 would open a path toward the mid-band and 20 EMA near $72,000–72,500. Losing S1 would likely force another test of the $70,000 area.
15-minute chart (M15): execution context, not a trend change
The 15-minute chart is neutral, reflecting intraday noise within a larger downtrend.
EMAs (micro-structure)
- Price (close): $71,476.65
- EMA 20: $71,369.24
- EMA 50: $71,871.41
- EMA 200: $74,282.12
- Regime flag: neutral
Interpretation: Price is trading slightly above the 20 EMA but still below the 50 and 200 on M15. That is a small stabilization after the dump, not a structural reversal. Short term, buyers are defending dips around the 20 EMA, while the 50 EMA near roughly $71,900 is the first micro-resistance to watch.
RSI 14 (micro momentum)
- RSI 14: 50.69
Interpretation: RSI near 50 on 15M is textbook neutral: momentum is balanced. This matches a consolidation or decision zone where the market is digesting the move rather than trending.
MACD (very short-term impulse)
- MACD line: -29.05
- Signal line: -135.19
- Histogram: +106.14
Interpretation: MACD on 15M has turned positive on the histogram with the MACD line rising toward or above the signal from below. That shows a short-term push from buyers, essentially a local bounce within the context of a bigger downtrend. For intraday traders, this is the signal to look for pullbacks rather than chasing shorts at this exact moment. Again, it is a tactical nuance, not a new bull trend.
Bollinger Bands (micro volatility)
- Middle band: $71,175.59
- Upper band: $71,882.05
- Lower band: $70,469.13
- Price: $71,476.65 (just above mid-band)
Interpretation: Price is sitting slightly above the mid-band with bands moderately expanded. That is a garden-variety consolidation after expansion, typical of a market catching its breath.
15-minute pivots
- Pivot point (PP): $71,465.94
- Resistance 1 (R1): $71,510.71
- Support 1 (S1): $71,431.87
Interpretation: Price is hugging the 15M pivot almost perfectly. Very short term, that means the market is balanced, waiting for the next impulse. Breaks above R1 or below S1 on this timeframe are only meaningful insofar as they signal which side is taking control of the next leg within the broader hourly structure.
Market context: risk-off, but not total capitulation
Total crypto market cap is around $2.51 trillion, down about 5.6% in 24 hours, while 24-hour volume is up over 21%. $BTC dominance at nearly 57% confirms Bitcoin is leading the sell-off. In DeFi, major DEXs like Uniswap V3 and others are showing strong increases in fees over the last days and weeks. This reflects elevated on-chain activity as traders rebalance, cut risk, or rotate.
The mainstream narrative from outlets such as Bloomberg, Reuters and CNBC is now locked onto Bitcoin’s drawdown and the test of the $70,000 area, framing it as a potential crisis of confidence. That typically coincides with late-stage fear phases rather than early ones, but price action still has to confirm any bottoming attempt.
Scenarios for Bitcoin price today
Bias: Dominant scenario is still bearish
Given the daily downtrend, oversold momentum, and price location near the lower Bollinger Band, the dominant thesis is:
- Primary bias: Bearish trend, with rising odds of a counter-trend bounce or consolidation instead of an immediate straight-line collapse.
- Key battleground: The $70,000–73,000 range.
Bullish scenario (counter-trend bounce / short-covering rally)
- $BTC defends the $70,000 area (daily S1 around $69,930 plus H1 lower band cluster) and stays inside or quickly reclaims the daily lower Bollinger Band.
- On lower timeframes, the 1H MACD bullish tilt extends, with price reclaiming and holding above the H1 EMA 20 (around $72,300) and then challenging the H1 EMA 50 (around $74,200).
- Daily RSI begins to turn up from the low 20s, and hourly RSI moves back above 50, signaling that the worst of the immediate selling pressure has passed.
Upside targets if bulls gain traction:
- First, a move toward the daily pivot and H1 mid-Bollinger region around $72,500–73,000.
- If that area is cleared and held, extension toward $75,000–77,000 becomes plausible as mean reversion toward the far-off daily EMA 20 begins.
What invalidates the bullish scenario:
A decisive break and daily close below $69,900–70,000 with expanding ATR and renewed pressure on the daily lower band would indicate this was not a bottoming attempt but the start of a deeper leg lower. That would put the mid-to-high $60,000 region in play.
Bearish scenario (trend continuation / deeper flush)
- $BTC fails to hold the $70,000 cluster and loses daily S1 with force, turning that zone into resistance on any retest.
- Daily MACD remains deeply negative and RSI stays pinned near oversold while price grinds or spikes lower, a classic “bleed then flush” pattern.
- On 1H and 15M, EMAs continue to cap every bounce, with the 20 and 50 EMAs acting as dynamic ceilings and intraday RSI unable to sustain above 50.
Downside targets if bears stay in control:
- First phase: a measured extension beyond daily S1 could drag price into the $67,000–69,000 area.
- In a full risk-off extension with rising ATR, a deeper probe toward the mid $60,000s would not be out of character for this kind of market reset.
What invalidates the bearish scenario:
If $BTC reclaims and holds above the $73,000 region (over daily pivot and into or above H1 EMA 20), turns that area into support, and daily RSI curls higher from oversold while the daily MACD histogram contracts, then the immediate bearish continuation thesis loses edge. The broader trend would still be down as long as price sits well below the daily EMA 20 (around $83,000), but it would shift expectations toward a multi-day range or corrective up-move rather than a clean continuation lower.
Positioning, risk, and how to think about this tape
Bitcoin price today is sitting at an uncomfortable intersection: the trend is clearly bearish, but short-term conditions are stretched and sentiment is extremely fearful. That mix is exactly where traders get trapped on both sides, with late shorts selling into the hole and impatient dip-buyers front-running confirmations.
Key points to keep in mind:
- Daily trend and structure argue for caution on aggressive long exposure until $BTC can at least reclaim and hold above nearby intraday resistance zones, starting around $73,000 on the 1H chart.
- At the same time, daily oversold readings and price pressing the lower Bollinger Band mean downside entries are no longer as clean as they were a few days ago. Risk-reward for fresh shorts is less forgiving unless you are trading very short term with tight risk controls.
- Volatility is elevated across timeframes, so position sizing and leverage matter more than usual. Even relatively small intraday moves can translate into large P&L swings.
In this environment, trading decisions hinge less on calling the exact bottom or top and more on respecting the dominant daily downtrend while recognizing the potential for violent, counter-trend rallies. The $70,000 level and the $73,000 area above are the immediate reference points to judge whether current action is just another leg down or the start of a more meaningful bounce.