

 4
4
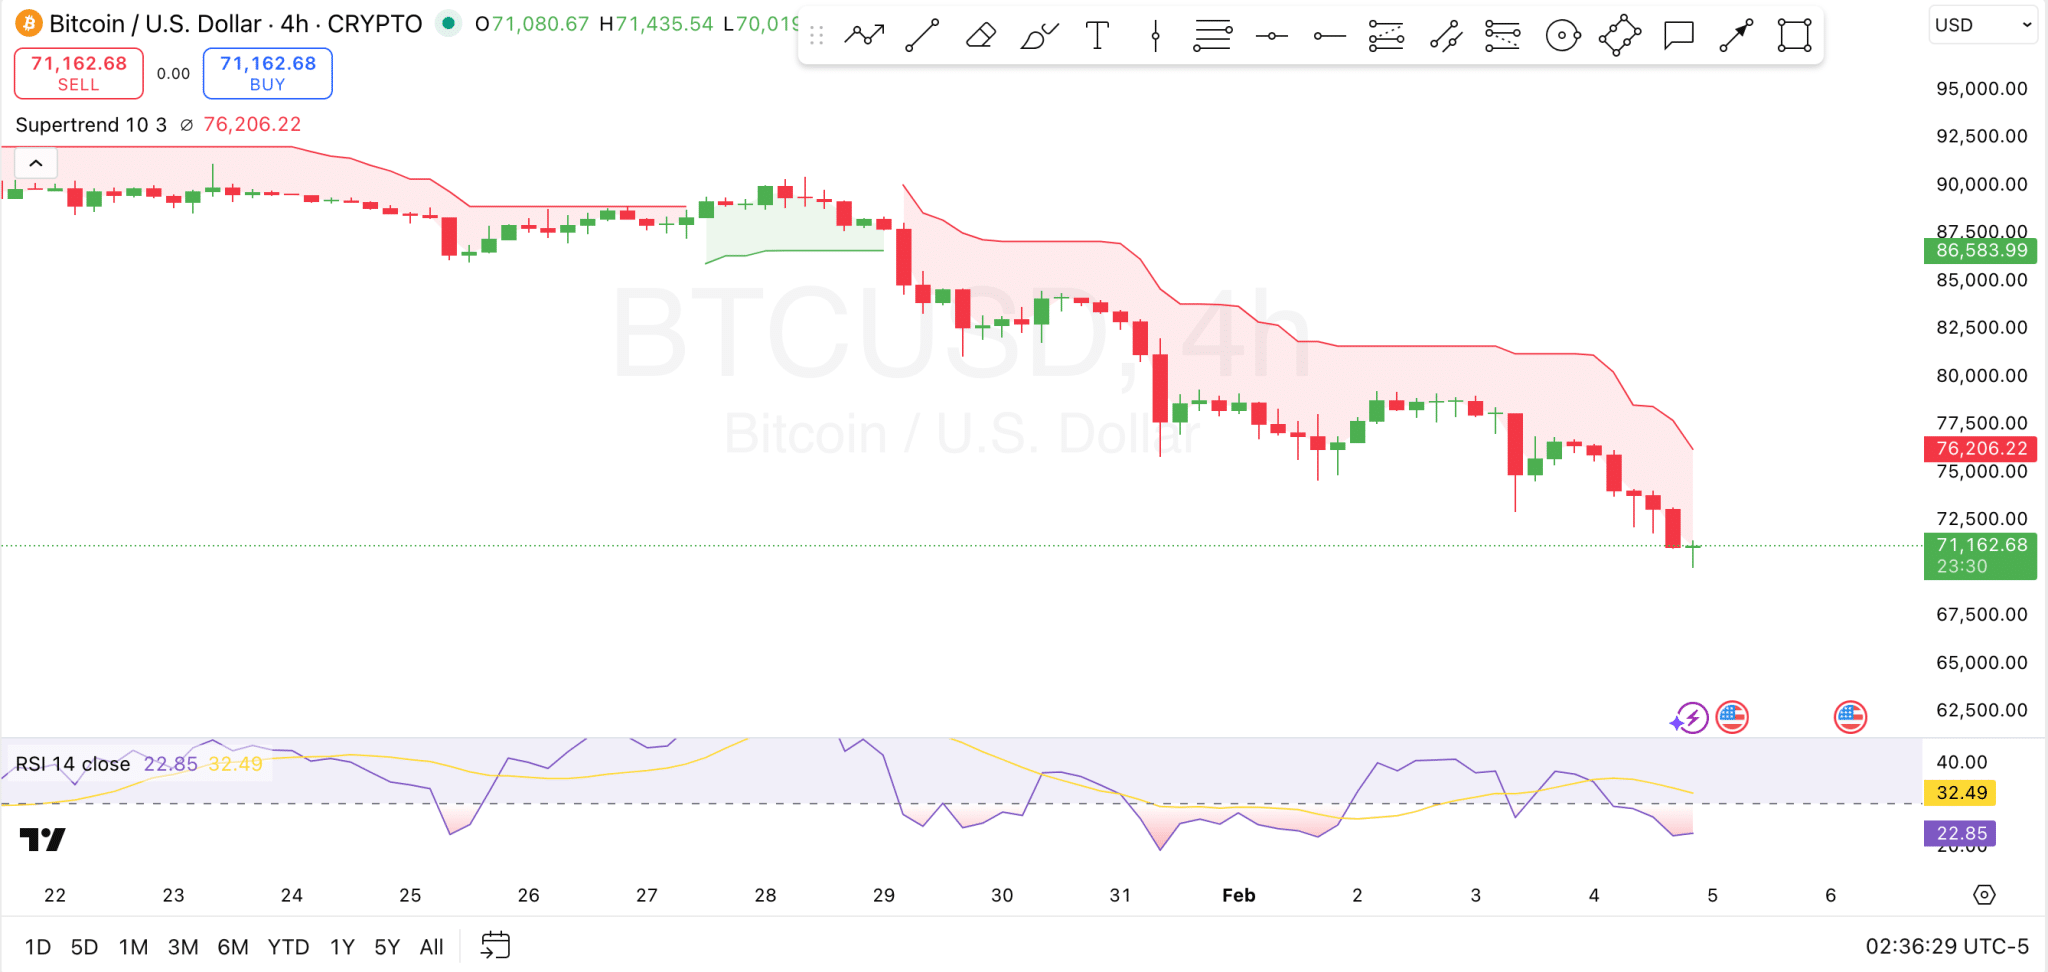
Bitcoin faces resistance at the Supertrend level, with analysts suggesting a potential decline toward the 200-week SMA.
Bitcoin ($BTC) continues to show volatility, experiencing a notable 6.7% decline in the past 24 hours. As of the most recent data, Bitcoin is trading around $71,206, with fluctuations between $70,119 and $76,472.
Over the past 30 days, Bitcoin’s performance has seen a decrease of 23.9%, further compounded by a 19.2% drop over the last week. Despite the short-term setbacks, Bitcoin remains the leader of the crypto market, with a 24-hour trading volume of $83 billion, up over 21% today.
Although the current market conditions have shown a downturn, Bitcoin’s long-term outlook remains a key factor in its market dominance. Will this price action indicate a long-term trend reversal, or is it another pullback in the anticipated super cycle?
Will Bitcoin Recover?
Notably, Bitcoin’s current price action is testing key support near $71,000, with the Supertrend indicator acting as immediate resistance at around $76,206.22. The price has been under pressure, and the Supertrend remains in the red zone, suggesting a bearish sentiment. If Bitcoin fails to hold the support near $71,162.68, it could see further downside, targeting $70,000, and potentially $67,500 as the next support level.
The immediate resistance, marked by the Supertrend, continues to limit Bitcoin’s ability to make significant upward movements. A breakout above this level would be necessary for any bullish reversal to gain momentum. If Bitcoin manages to clear this resistance, the next resistance zone would be between $77,500 and $80,000, where previous rejections have occurred.
Additionally, the RSI at 22.85 is signaling deep oversold conditions, which is a sign of a potential reversal. However, a reversal will occur only if the RSI begins to rise and crosses above the 30 level. Nonetheless, this would need to align with the price breaking through the immediate Supertrend resistance.
Further Declines Incoming?
Elsewhere, expert analyst Ali Martinez believes further decline could be incoming. Martinez highlighted a concerning trend for Bitcoin, pointing out that whenever the crypto has dropped below the 100-week Simple Moving Average, it has failed to reclaim it quickly and instead continued to fall toward the 200-week SMA.
Historically, Bitcoin’s price fell by 55.25% in 2015, 45.50% in 2018, 46.78% in 2020, and 57.95% in 2022 after losing the 100-week SMA. Martinez suggests that Bitcoin may be on a similar path, potentially heading toward the 200-week SMA if it cannot regain support above the 100-week SMA. Martinez’s chart pointed out that Bitcoin’s next target could be around the 200-week SMA, which currently sits at approximately $57,600.

