


 26
26
- Bitcoin price correction is 4% short of retesting the November 2021 peak at $69,000.
- Bitcoin UTXOs in unrealized loss climbed to 27–30%, mirroring stress patterns recorded in May 2022.
- Amid a major bear market, the $BTC price temporarily breached below 200 weekly exponential moving average before regaining its bullish momentum.
The Bitcoin price slips nearly 3% on Wednesday, February 4th, to break below the $75,000 psychological level. A 39% jump in trading volume hints that the market selling pressure remains intact, and a risk of a prolonged downtrend persists. As the price wavers below the $75k mark, the on-chain metrics and derivatives signal a crucial make-or-break moment for $BTC that may determine the near mid-term trend.
$BTC’s Unrealized Losses Are Flashing a Cycle Warning
Amid the recent market correction, Bitcoin price plunged to a low of $73,000, marking its worst levels since late 2024. As market sentiment wavers in the influence of macroeconomic development and geopolitical tension, the $BTC price continued to fluctuate around $75,000.
Traders are making note of the fact that trading above $75,000 might potentially give room for rebuilding momentum, while a strong break lower could hasten defensive positioning and additional liquidations.
Derivatives markets are a reflection of caution in this respect. Open interest in futures contracted in the drop, with funding rates going negative with accelerated selling. Implied volatility is still high on options expiring soon, and the volatility curve is indicating some mild backwardation, indicating that traders are paying a premium to be protected against sudden moves. Downside skew has actually built, with demand building for out-of-the-money puts that guard against sharp declines – that is, focus on crash protection as opposed to upside bets.
On-chain data provides an additional layer of insight. The percentage of Bitcoin UTXOs currently in unrealized loss has risen back to the 27 – 30% range, which is reminiscent of patterns seen during the downturn in May 2022. This band has historically been used as a pressure gauge, not just an easy-to-trigger bearish.
When the metric spikes beyond 30% and then stays there, it is often accompanied by piling up loss positions that lead to extended selling. On the other hand, if it stalls or reverses below 27-30%, it may indicate exhaustion of sellers and the setting of stabilization or recovery.
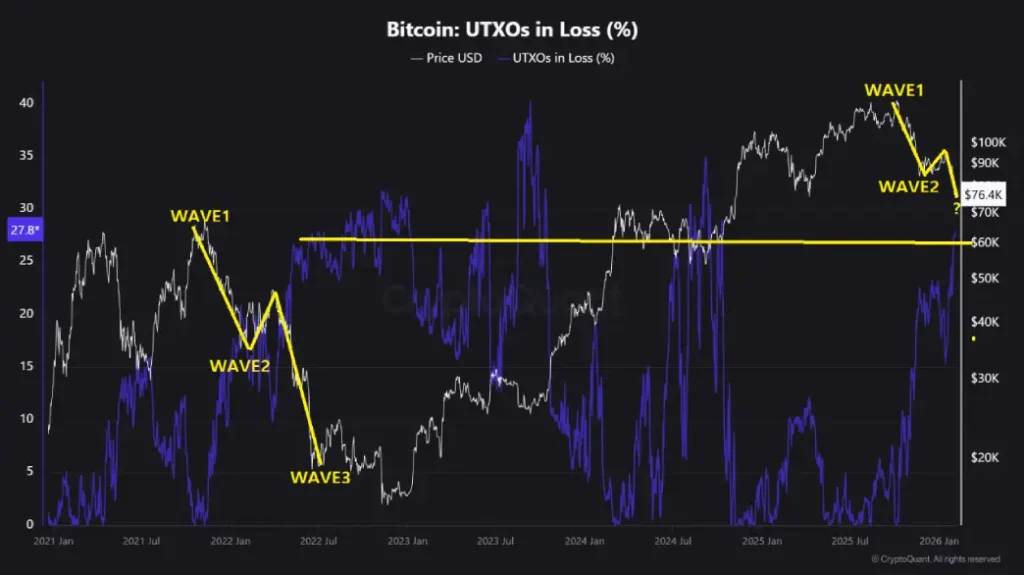
The chart patterns show repeat cycles where loss percentages go wild during drawdowns with labelled “waves” of prior peaks (some near 40%) linked to major price swings. Current readings take the metric close to readings that have preceded both deeper corrections and eventual rebounds in previous cycles.
Together, these elements make the $70,000-$75,000 area a major trial of will for the participants – how to balance the absorbed stress with the potential for renewed pressure.
Bitcoin Price to Seek Support From 2021 Peak
In the last three weeks, the Bitcoin price witnessed a major downturn from $97,398 to currently trading value of $72,350, registering a 26% loss. As a result, the $BTC market cap also plunged to $1.44 trillion.
With sustained selling, the coin price could plunge another 4% and retest the 2021 all-time high of $69,000 as potential support. Historically, the bear market bottoms often revisit the peaks of the prior cycle. This isn’t arbitrary, as the price action often remembers high-volume areas from the past-cycle.
The volume profile shown in the chart below shows a thin order book between the $75,000-$70,000 region, indicating an “air pocket” where price can fall rapidly. The weekly chart also shows the 200 EMA slope wavering close to $69,000, creating a strong support zone for buyers to step in.
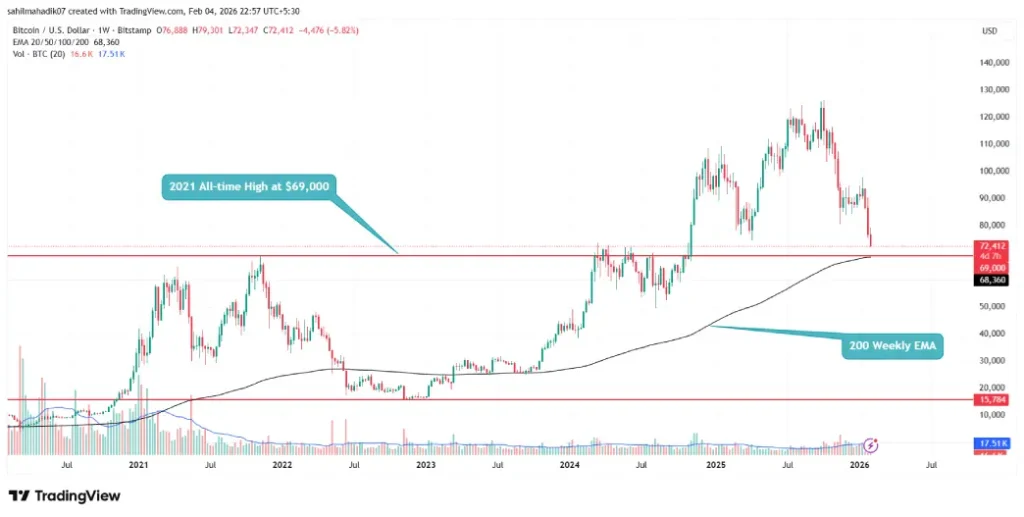
Thus, a consolidation range is highly possible at the aforementioned level before price decides its next move.
Also Read: $BTC ETFs Slip, Price of $BTC Drops to $76K; XRP, ETH, SOL ETFs Gain
