


 21
21
Bottom-fishing is sexy but brutal. But if that's your game, this battle-tested on-chain indicator may be your North Star for spotting the bitcoin $BTC$76,020.66 bear market bottom.
This metric, called $BTC supply in profit versus loss, gauges how bitcoin wallets sitting on paper profits stack up against those underwater. When the two balance out, bear markets tend to bottom, past data show. This makes it a reliable signal for capitulation and long-term opportunity.
To the relief of bulls, that scenario could arrive soon, as the number of those sitting on profits and losses seems to be converging.
Glassnode data shows that currently 11.1 million bitcoin is in profit, meaning these coins have been acquired at prices lower than the going market rate. Meanwhile, 8.9 million $BTC is in loss.
A potential convergence could mark a bottom just as it did in 2022 and 2018-19, as seen in the chart below.
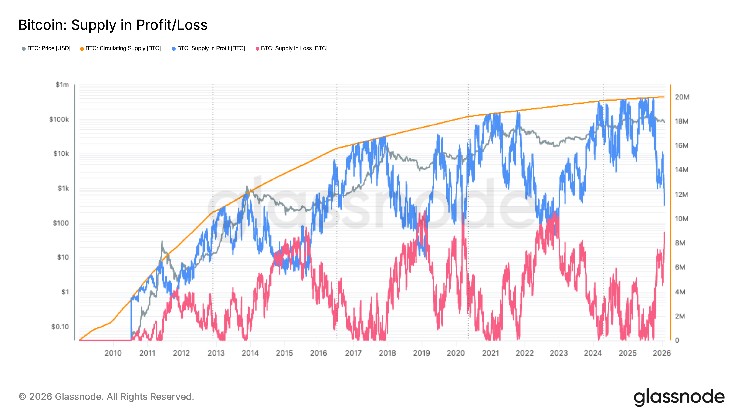
The Glassnode chart illustrates the volume of $BTC supply held in profit, shown in blue, and in loss, shown in red, relative to the circulating supply.
As spot prices move above or below aggregate cost bases, coins migrate between these two supply cohorts, providing insight into market wide positioning and investor stress.
Historically, convergence points between the two have marked definitive cycle bottoms. This occurred in November 2022 around $15,000 following the FTX collapse, in March 2020 when bitcoin briefly fell below $3,000 during the covid-19 market shock, in January 2019 near $3,300, and again in 2015 just above $200.
Let's see if history repeats itself.
