


 21
21
Bitcoin remains under pressure as former support zones turn into resistance, with heavy long liquidations shaping near-term market direction. Where next?
Bitcoin ($BTC) has come under renewed selling pressure, sliding 4.1% over the past 24 hours to trade around $75,441. During the session, $BTC moved within a wide intraday range, touching highs near $79,049 before dipping to lows around $74,592. The broader performance trend also remains weak, with Bitcoin down roughly 14% over the past week, nearly 19% in the last 14 days, and more than 16% over the past month.
$BTC’s chart shows a steady intraday decline punctuated by sharp downside moves, suggesting fragile market confidence as buyers struggle to reclaim lost ground. This price weakness comes amid a challenging macro backdrop, with traders reacting to a mix of risk-off catalysts.
These include a partial U.S. government shutdown, renewed trade-war headlines, rising long-dated Japanese government bond yields, and escalating geopolitical tensions tied to the unrest in Iran and growing friction in South China Sea.
Together, these factors have pressured risk assets broadly, setting the stage for the next section to examine whether Bitcoin can stabilize or if further downside risks remain in play.
Can Bitcoin Stabilize?
Bitcoin’s daily chart shows a decisive breakdown below key Fibonacci extensions, confirming strong bearish control. After slicing through the 1.0 level at $84,440, price continued lower and has now broken beneath the 1.618 Fibonacci extension at $76,150, which had acted as a critical downside target.
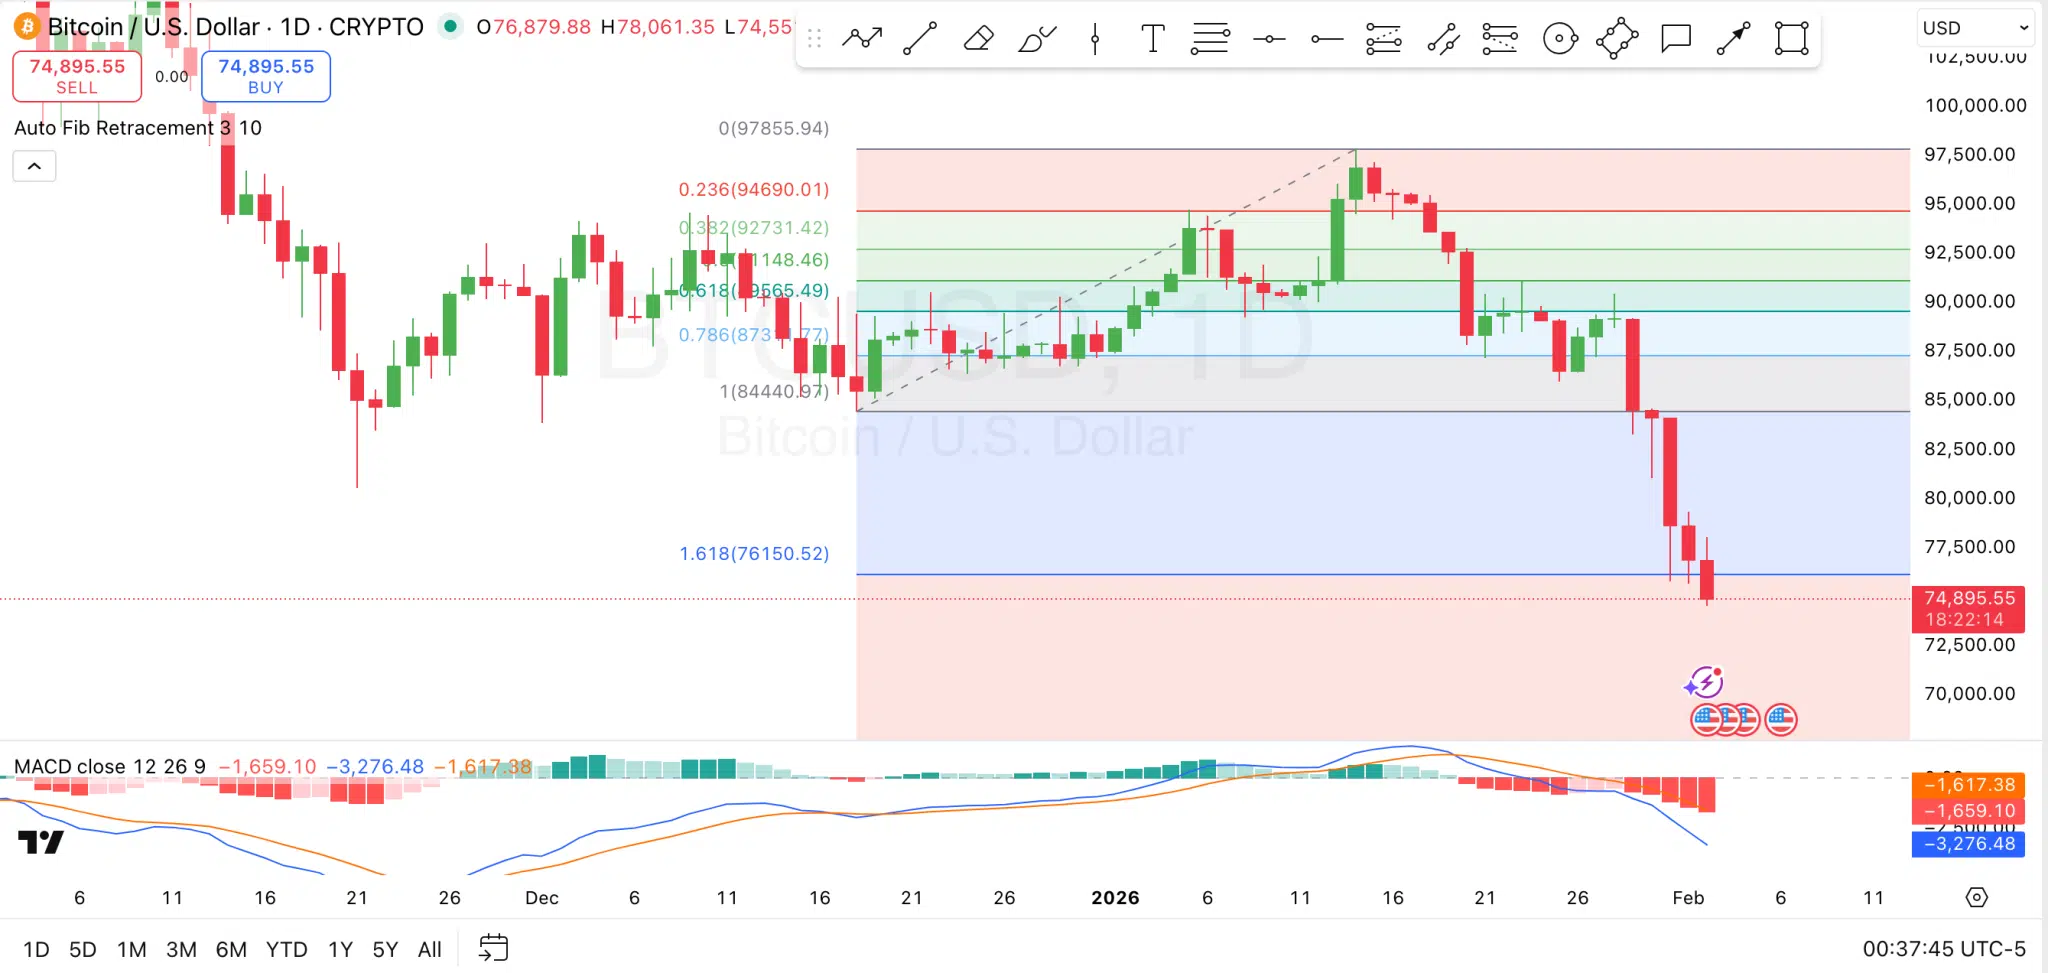
This move signals accelerating downside momentum rather than a simple pullback. With this extension lost, the immediate focus shifts to the next demand zone at $62,735, last seen around October 2024. Here, buyers may attempt to stabilize price, though the current structure suggests support is fragile and reactive rather than strong.
On the upside, prior support zones have now flipped into resistance. The 0.618 ($89,565) and 0.786 ($87,371) retracement zones stand out as key resistance bands, as they align with previous price congestion and failed recovery attempts. As long as Bitcoin remains below these levels, rallies are likely to be corrective in nature, with sellers defending aggressively on moves higher.
Momentum indicators reinforce the bearish outlook. Specifically, the MACD has crossed firmly into negative territory, with the signal line and histogram expanding lower, indicating strengthening downside momentum. There are no clear bullish divergences visible yet, suggesting selling pressure remains dominant. Until momentum indicators begin to flatten or show early reversal signals, the technical picture favors continuation risk to the downside.
Bitcoin Liquidation Data
Meanwhile, over the past 24 hours, total Bitcoin liquidations reached $254.92 million, with long positions accounting for $203.14 million, compared to $51.78 million in short liquidations. This confirms that the market heavily punished bullish positions during the sell-off.
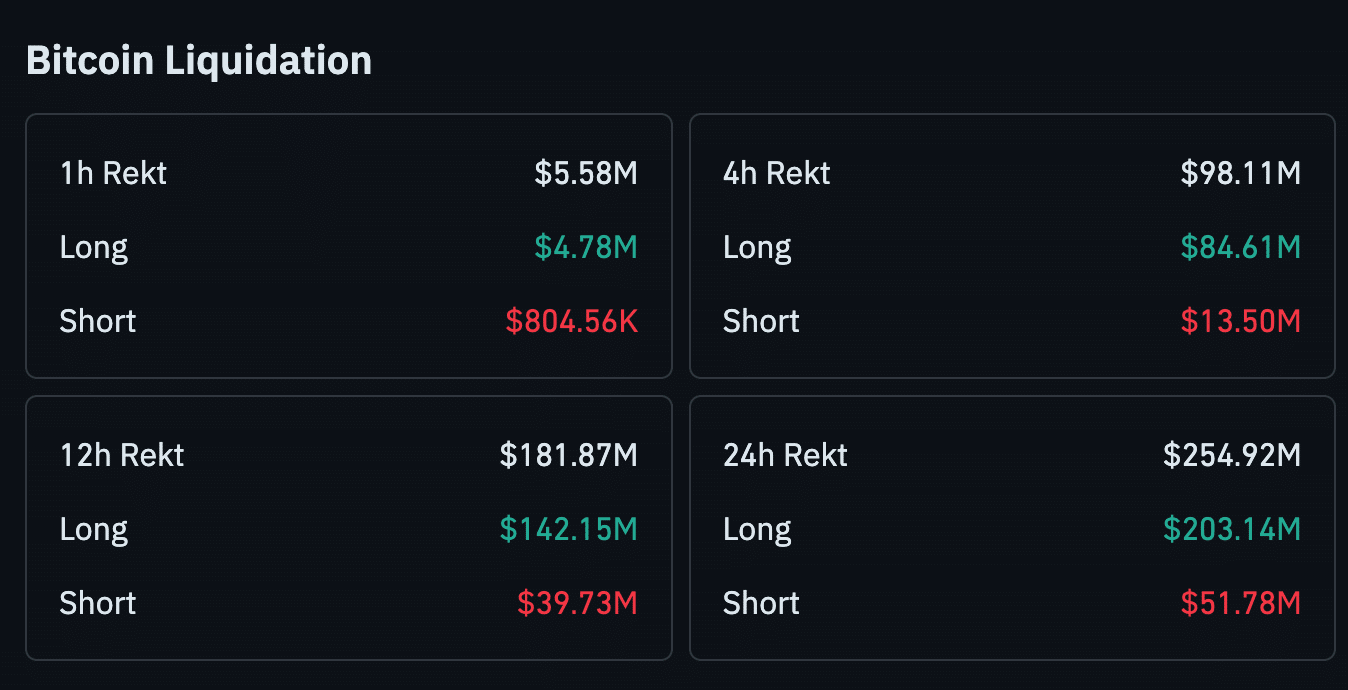
On shorter timeframes, the imbalance remains clear. In the last 12 hours, liquidations totaled $181.87 million, including $142.15 million in longs versus $39.73 million in shorts. Even on the 4-hour timeframe, long liquidations stood at $84.61 million, far exceeding $13.50 million in short liquidations, showing sustained pressure on leveraged buyers.
