


 25
25
Bitcoin entered Saturday, Jan. 31, 2026, with a bruised ego and a market trying to find its footing. Priced at $82,699 with a market capitalization of $1.65 trillion, bitcoin floated within a 24-hour trading band of $81,953 to $84,367. Its daily volume printed a notable $53.64 billion—ample liquidity, but not enough conviction to shake off the bearish overtones. From multiple chart intervals and momentum signals, it’s clear: Bitcoin is nursing its wounds, and the road to redemption may be anything but linear.
Bitcoin Chart Outlook
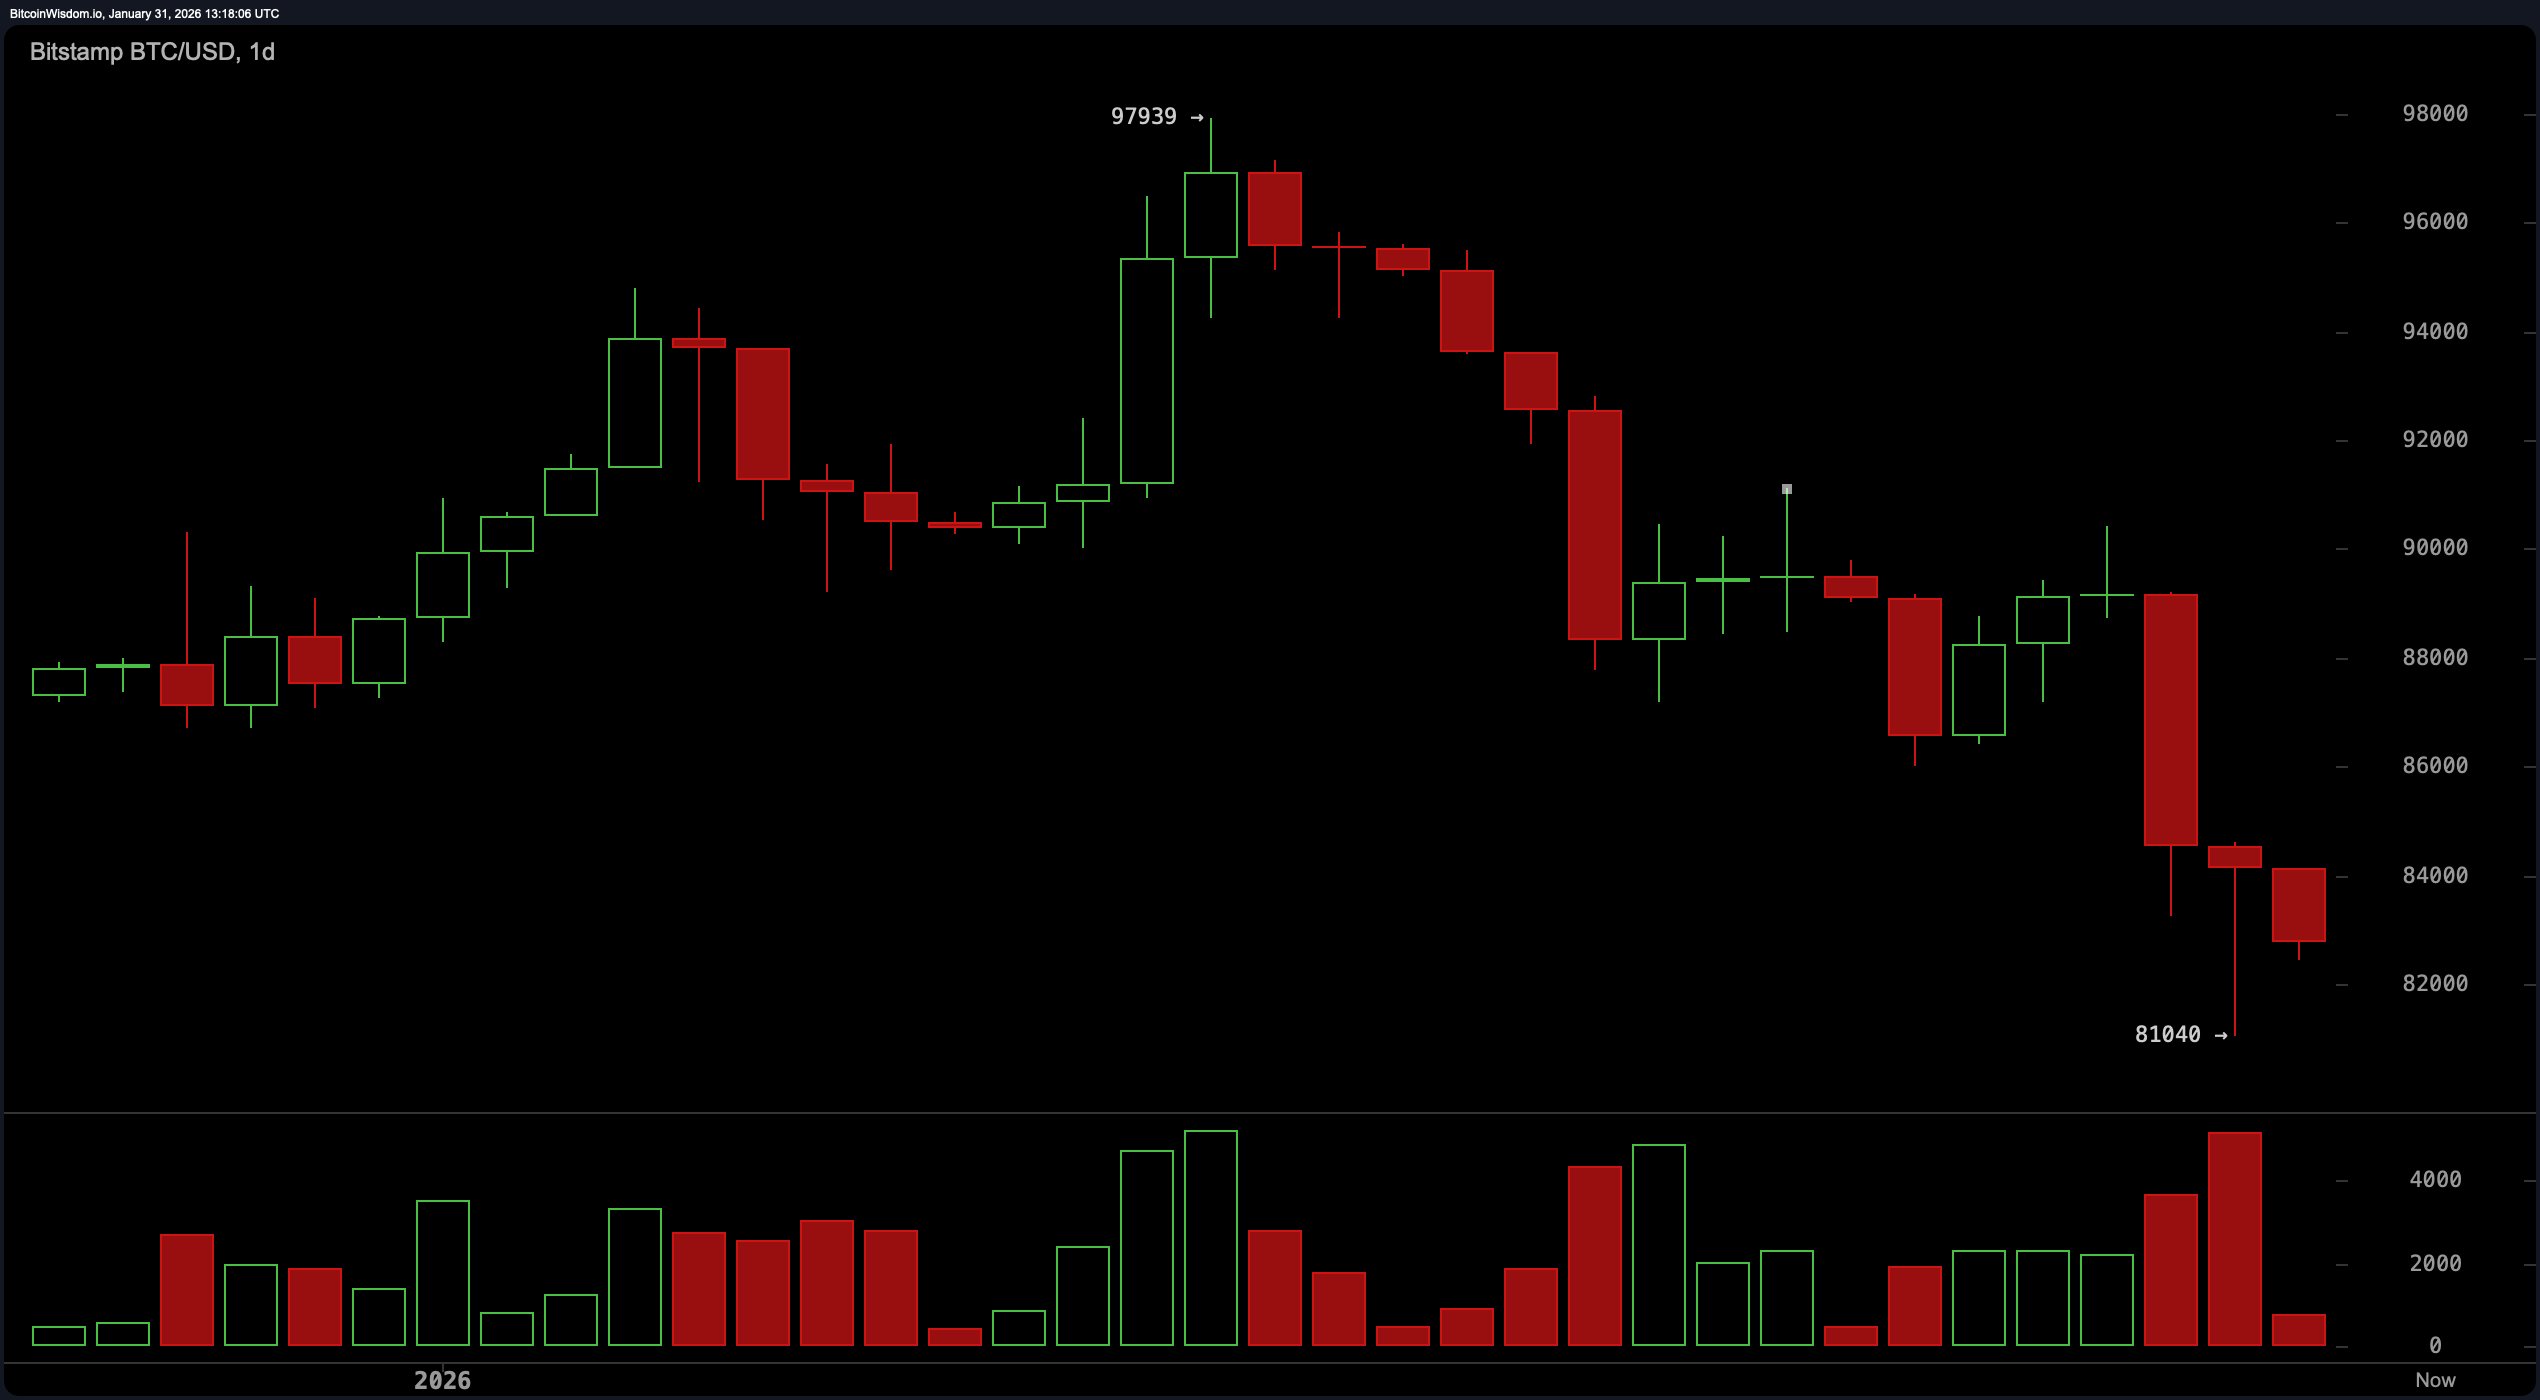
Let’s start with the daily chart, where bitcoin’s rejection at $97,900 etched a firm lower high and opened the trapdoor to its current slide. The sharp breakdown not only lost a key consolidation zone but did so on rising red volume, suggesting distribution over healthy profit-taking.
The wick down to $81,040 marks a line in the sand—key swing support—but without a strong reclaim of the $88,500 to $90,000 range, the broader structure remains in no-man’s-land. Call it bearish-to-neutral if you must, but don’t call it convincing. The bulls have their work cut out for them, and at present, the charts are whispering caution.
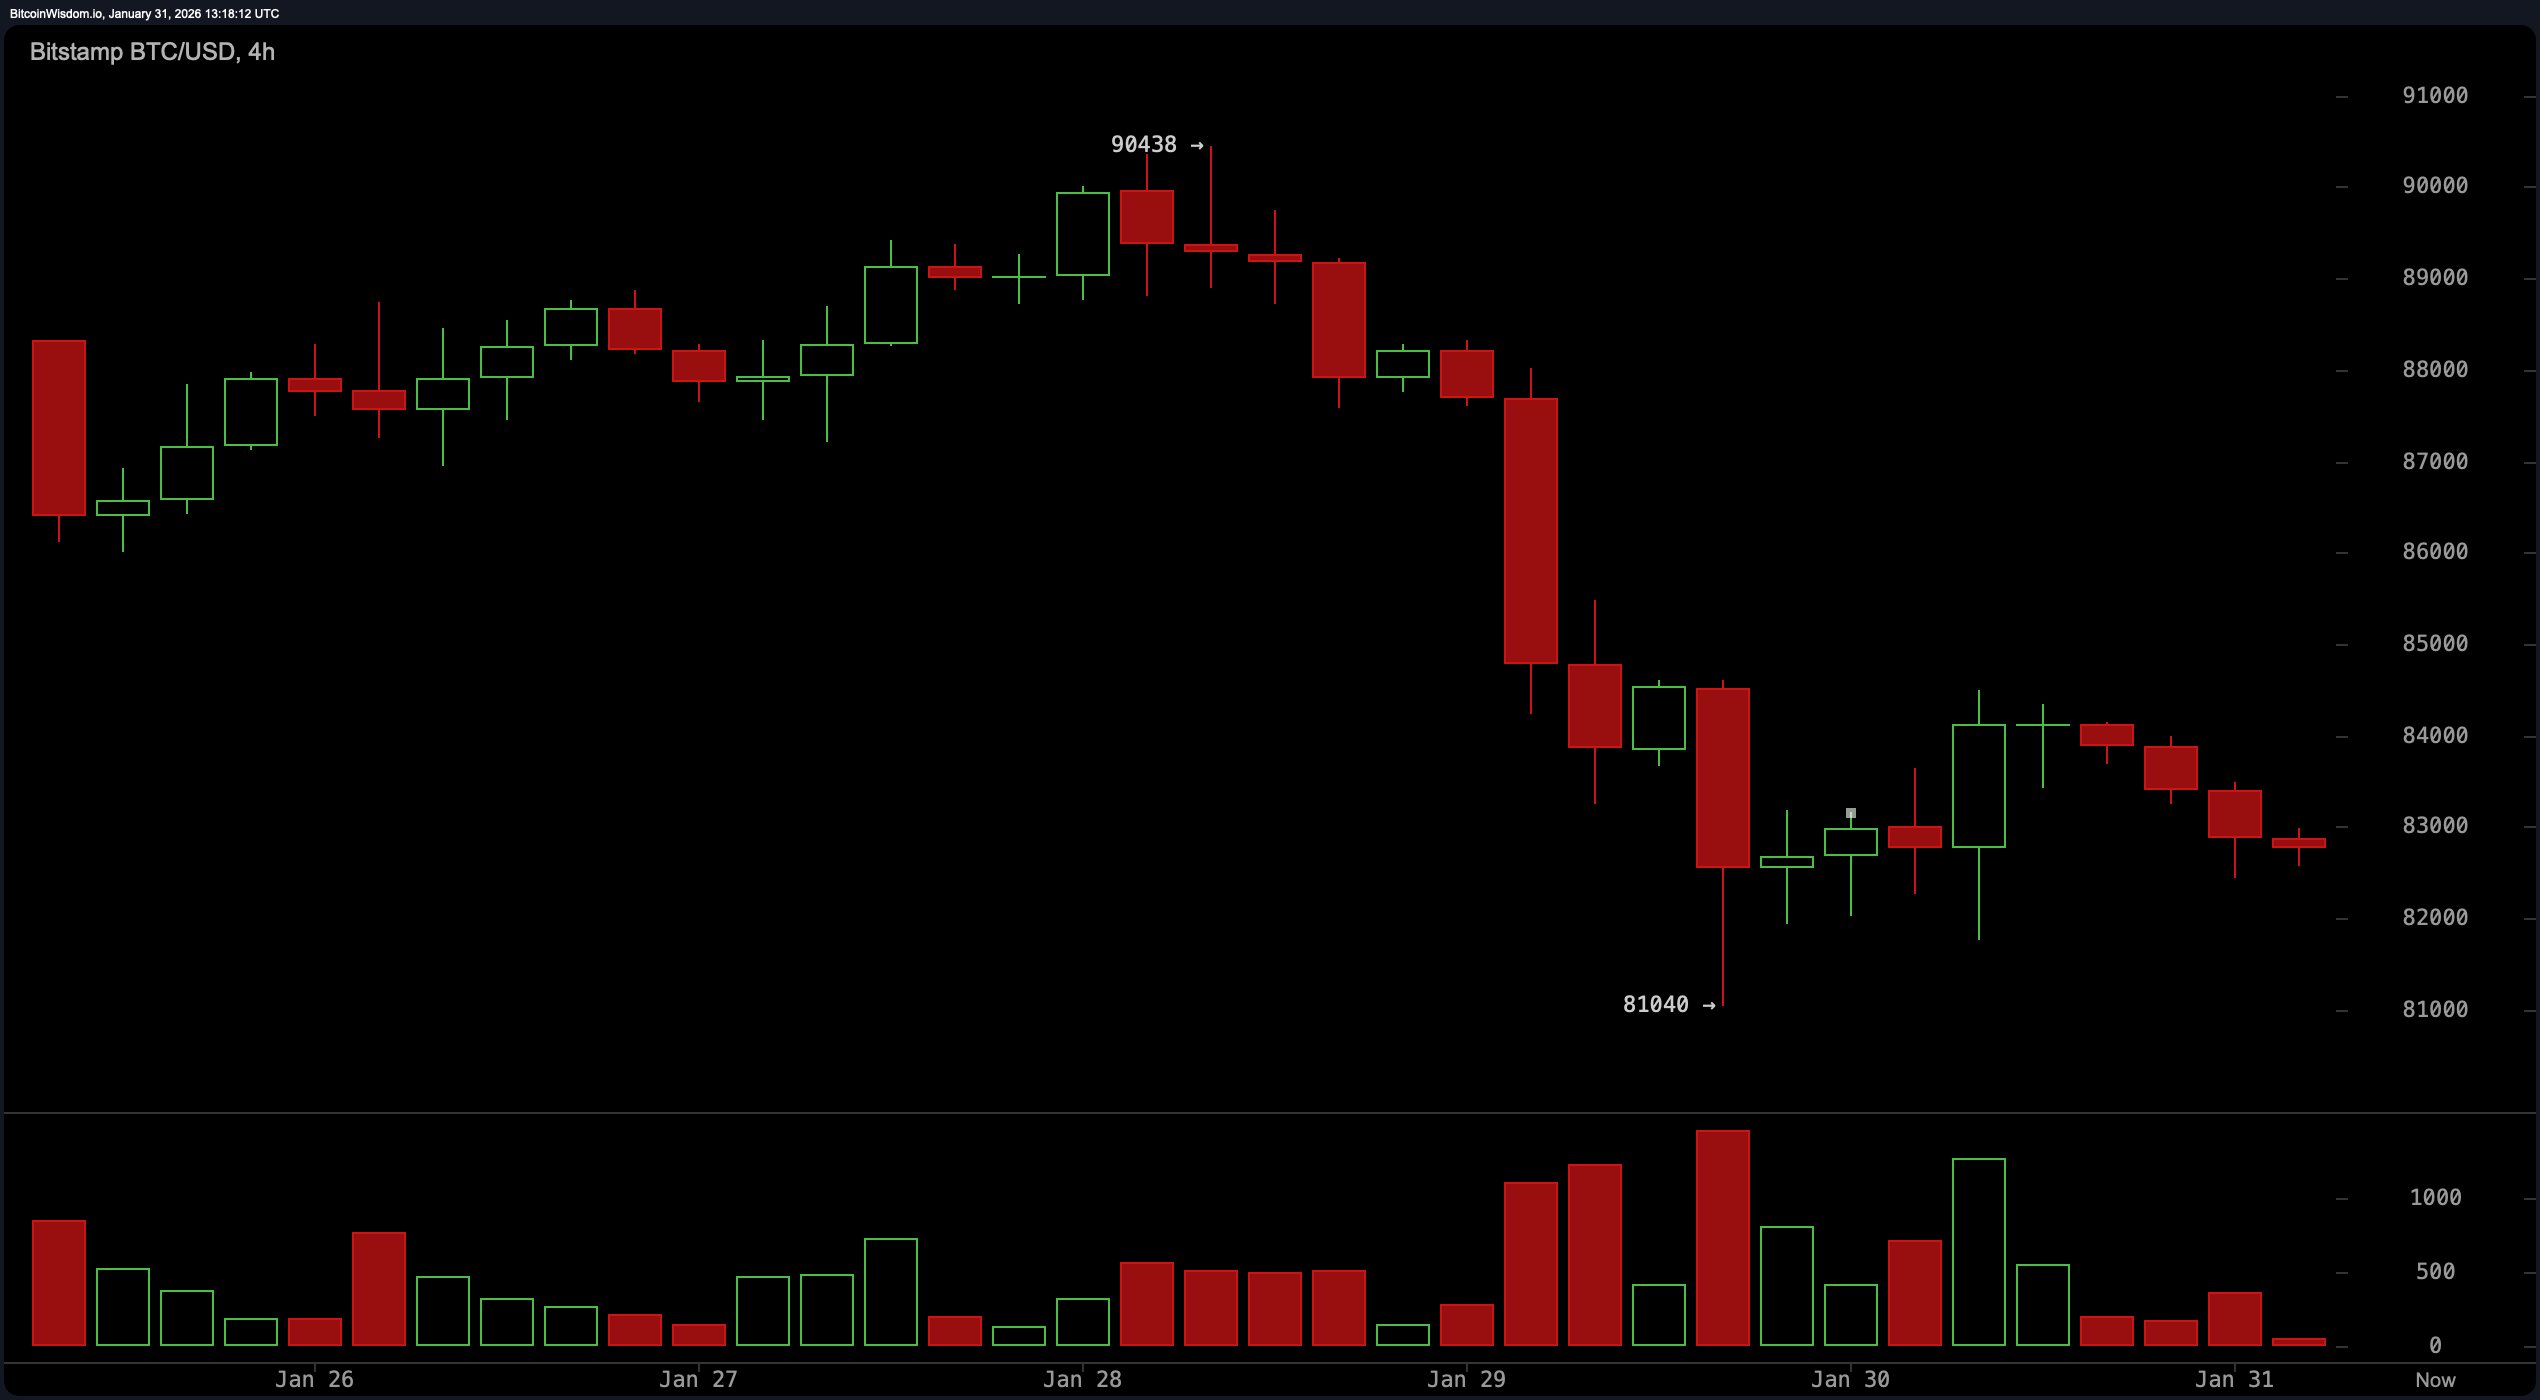
Shift the lens to the 4-hour chart, and the picture sharpens—into something a tad grim. A textbook pattern of lower highs and lower lows underscores that the sellers still have the wheel. Attempts to climb above $85,000 were slapped down like an overeager bidder at an auction, firmly establishing $84,500–$85,000 as near-term supply. Even the bounce off $81,040 lacked oomph—more corrective than impulsive, more whimper than roar. With momentum indicators like the moving average convergence divergence ( MACD) and momentum oscillator still skewing negative, price remains pinned beneath $86,000 with little sign of buyer dominance.
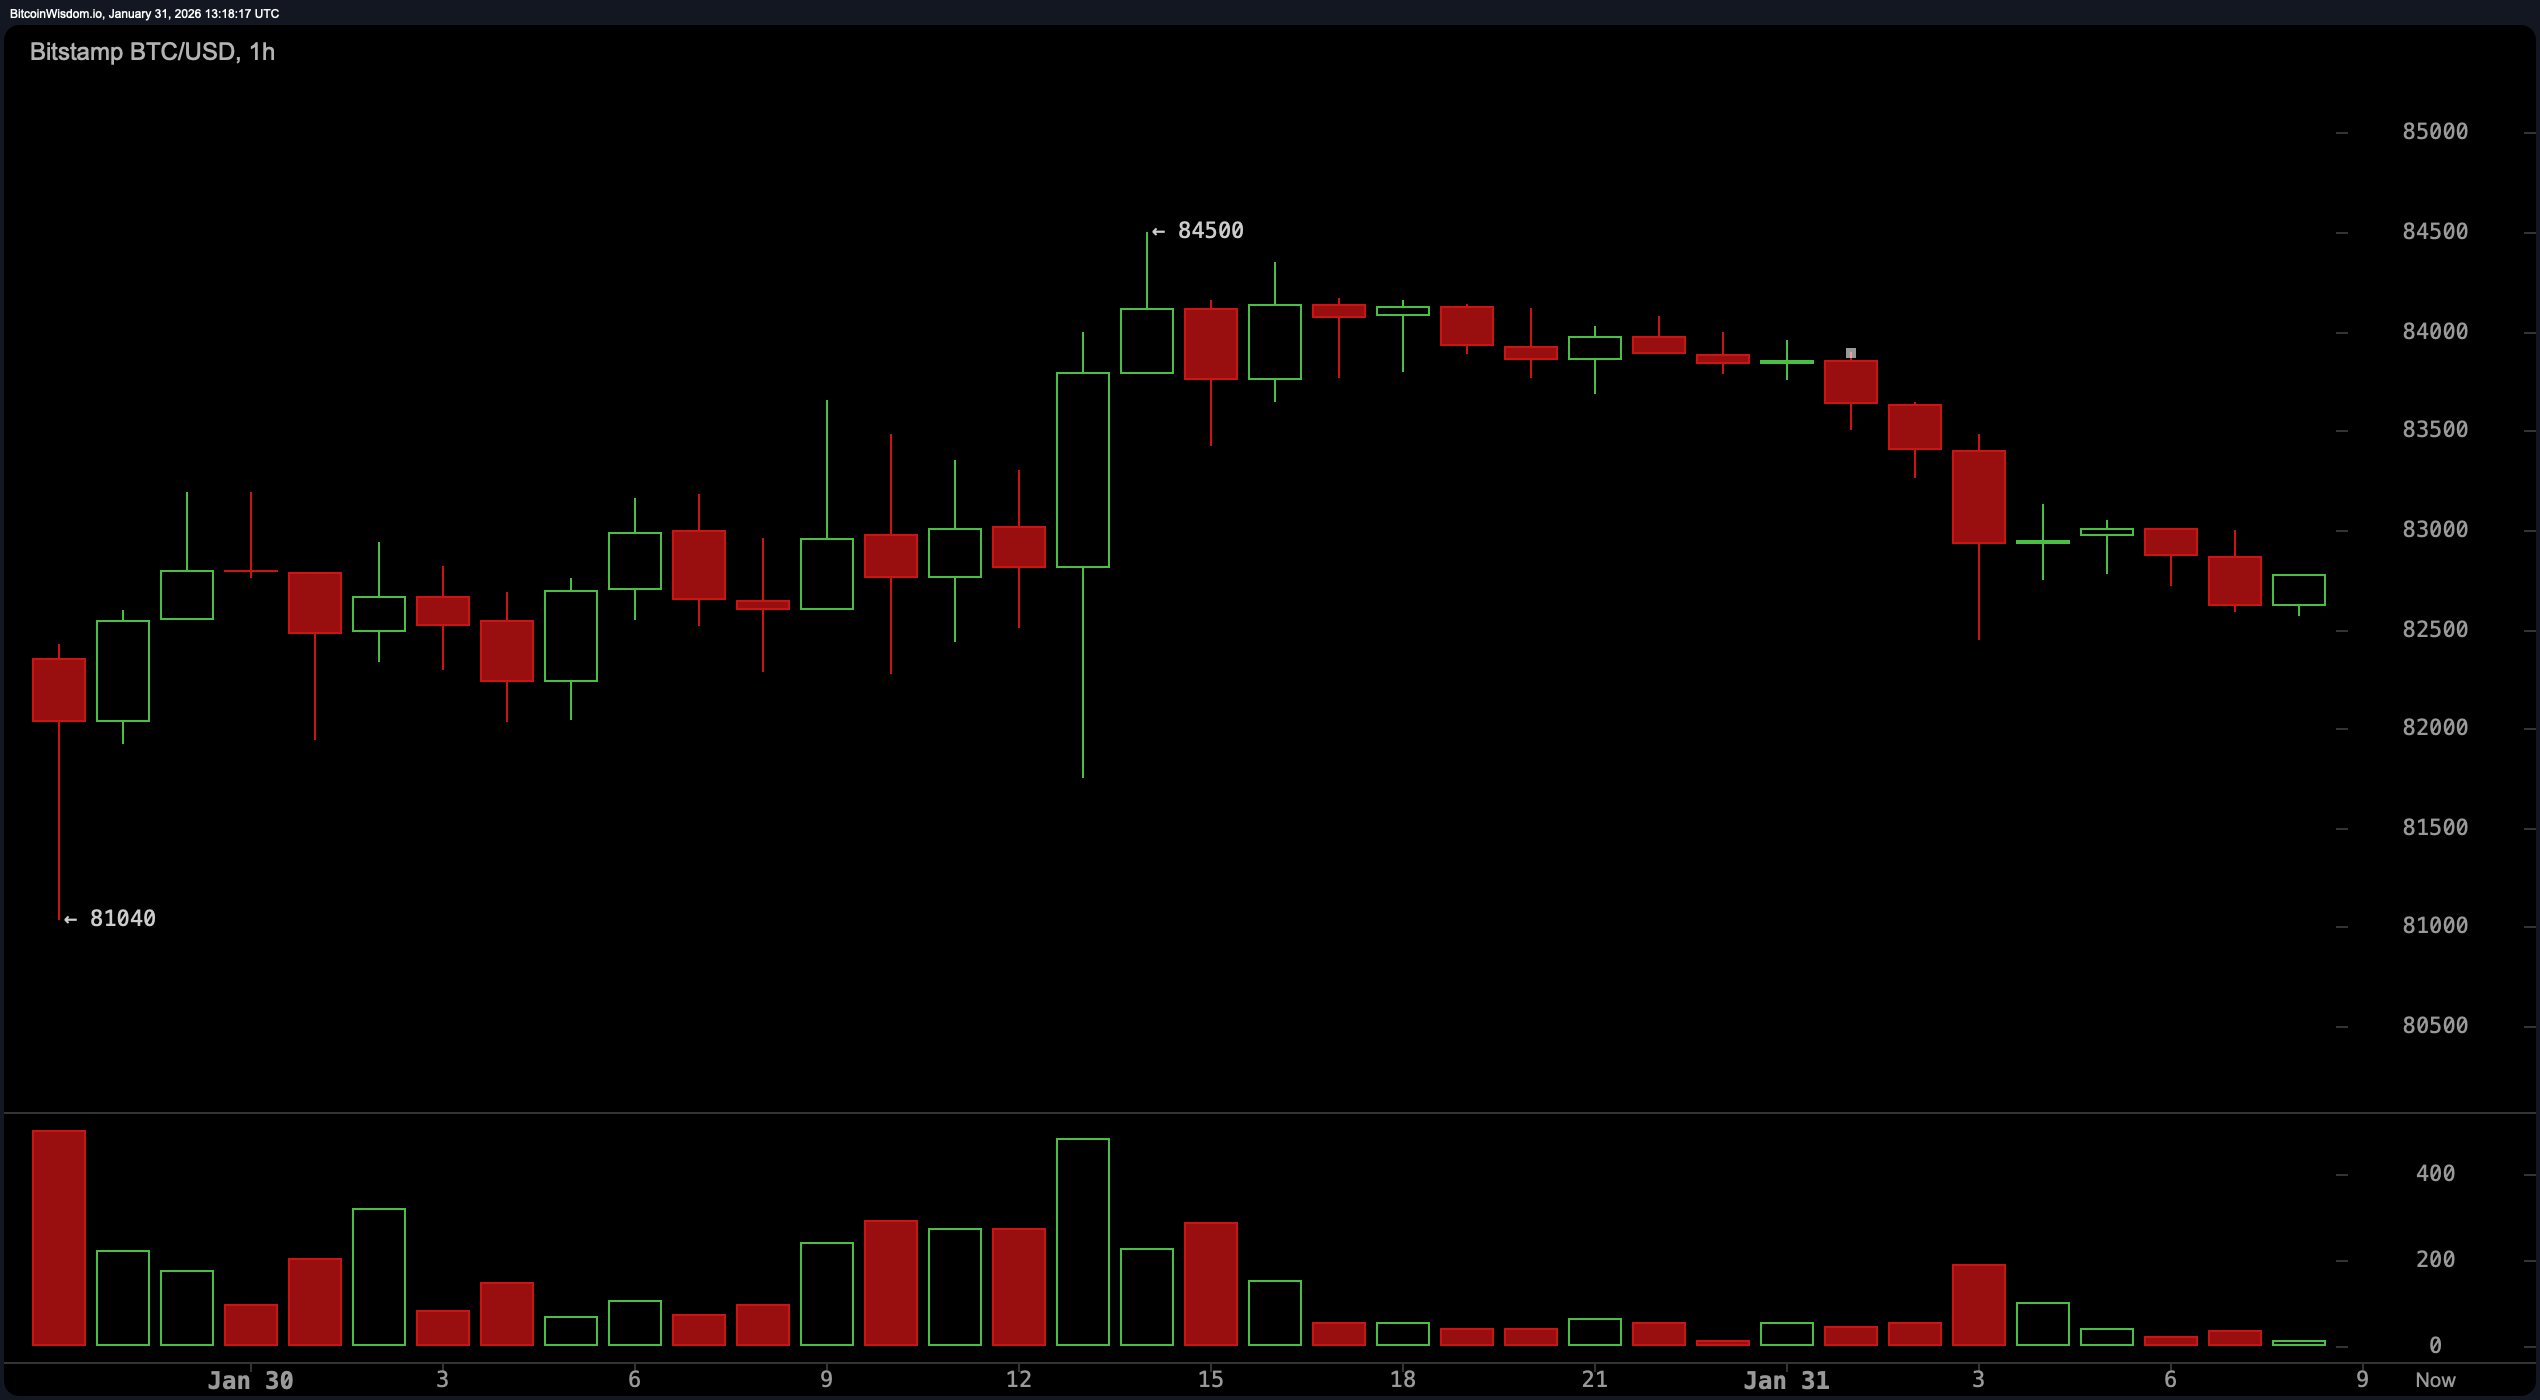
Zoom in on the 1-hour chart, and bitcoin is walking a tightrope draped in tension. Price action shows a narrow range capped by descending highs—a signature of absorption, not accumulation. The recent rejection just shy of $84,500 after sweeping prior bounce highs confirms sellers are still aggressively defending short-term resistance. Weak volume on green candles only reinforces the narrative: the bid side lacks firepower. Current support sits at $82,800, but if that gives way, eyes inevitably turn to $81,000, the same zone flagged in higher timeframes as structurally significant.
Indicators aren’t offering any redemption arcs either. The relative strength index ( RSI) is a tepid 31—hovering just above oversold without signaling strength. The stochastic oscillator and average directional index (ADX) sit in neutral territory, reflecting a lack of clear short-term trend leadership. The commodity channel index (CCI) screams “oversold” at -150, while the MACD shows continued bearish momentum at -1,682. Meanwhile, all major moving averages—from the 10-period exponential moving average (EMA) at $86,881 to the 200-period simple moving average (SMA) at $104,173—are stacked above price like a towering wall of disapproval.
The bottom line? Bitcoin isn’t broken, but it’s bruised. Structure remains tilted toward bears, with no confirmed reversal in sight until at least a sustained hold above $88,500 enters the chat. For now, the range between $81,000 and $85,000 is a battleground—a field littered with failed rebounds and tentative bounces. As always, momentum rules the day, and right now, it’s not wearing bullish colors. Until volume shows up and levels are reclaimed, the charts remain skeptical, not celebratory.
Bull Verdict:
For the bullish case to gain traction, bitcoin must reclaim and close above the $88,500–$90,000 resistance range on strong volume. That would break the sequence of lower highs, recover lost structure, and potentially flip momentum indicators toward positive territory. Until then, any upward movement remains a counter-trend rally, not a confirmed reversal.
Bear Verdict:
The trend remains in the bears’ favor with structure, momentum, and moving averages all leaning south. Rejections at $84,500–$85,000 reinforce short-term resistance, and the inability to hold above $86,000 limits upside potential. So long as price stays trapped below these zones, $81,000 remains vulnerable—and the charts continue to favor downside liquidity.
FAQ ❓
- Where is bitcoin trading now? Bitcoin is trading around $82,699, fluctuating between $81,953 and $84,367.
- What key levels should traders watch?Support lies near $81,000, with resistance at $84,500 and $88,500.
- Is momentum favoring buyers or sellers?Momentum indicators like MACD and momentum oscillator currently favor sellers.
- What does this mean for global crypto markets?Ongoing weakness in bitcoin could weigh on broader market sentiment and altcoin performance.
