


 25
25
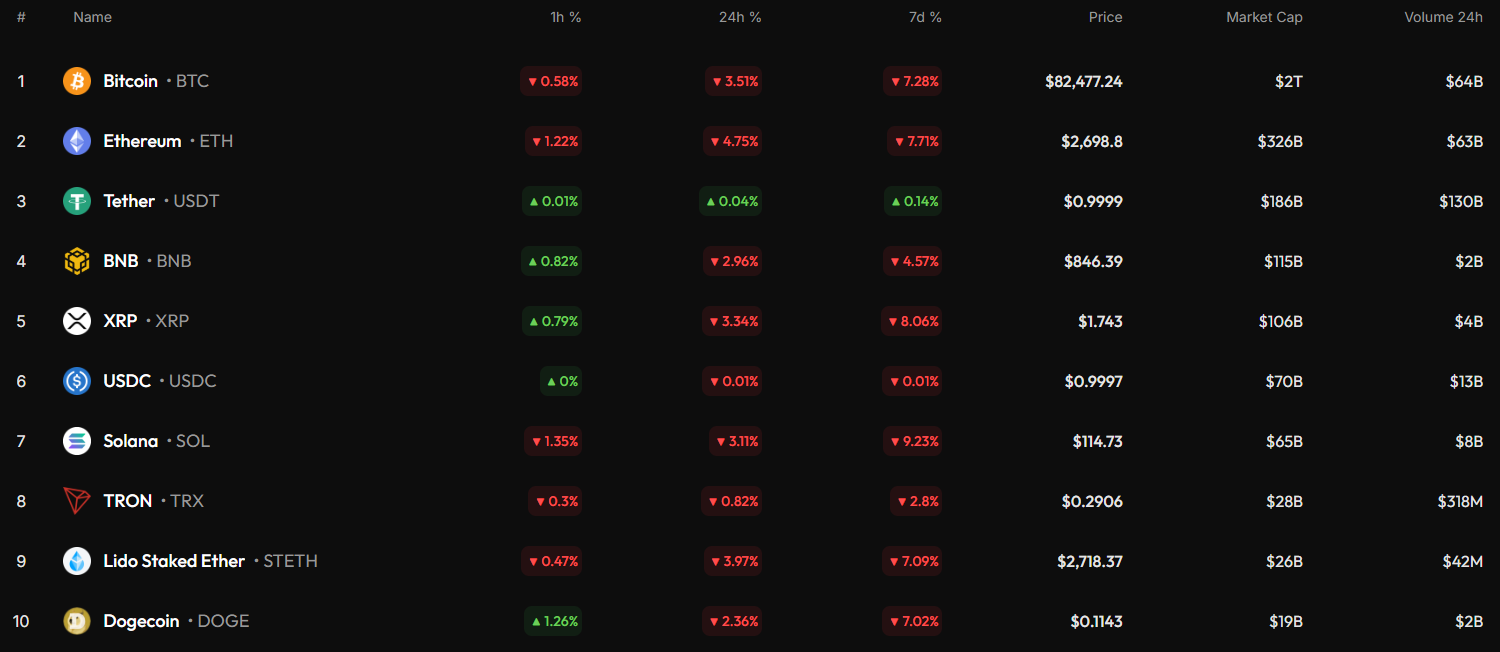
The top 10 coins are in the red zone at the end of the week, according to CoinStats.
$BTC/USD
The rate of Bitcoin ($BTC) has declined by 3.51% since yesterday.
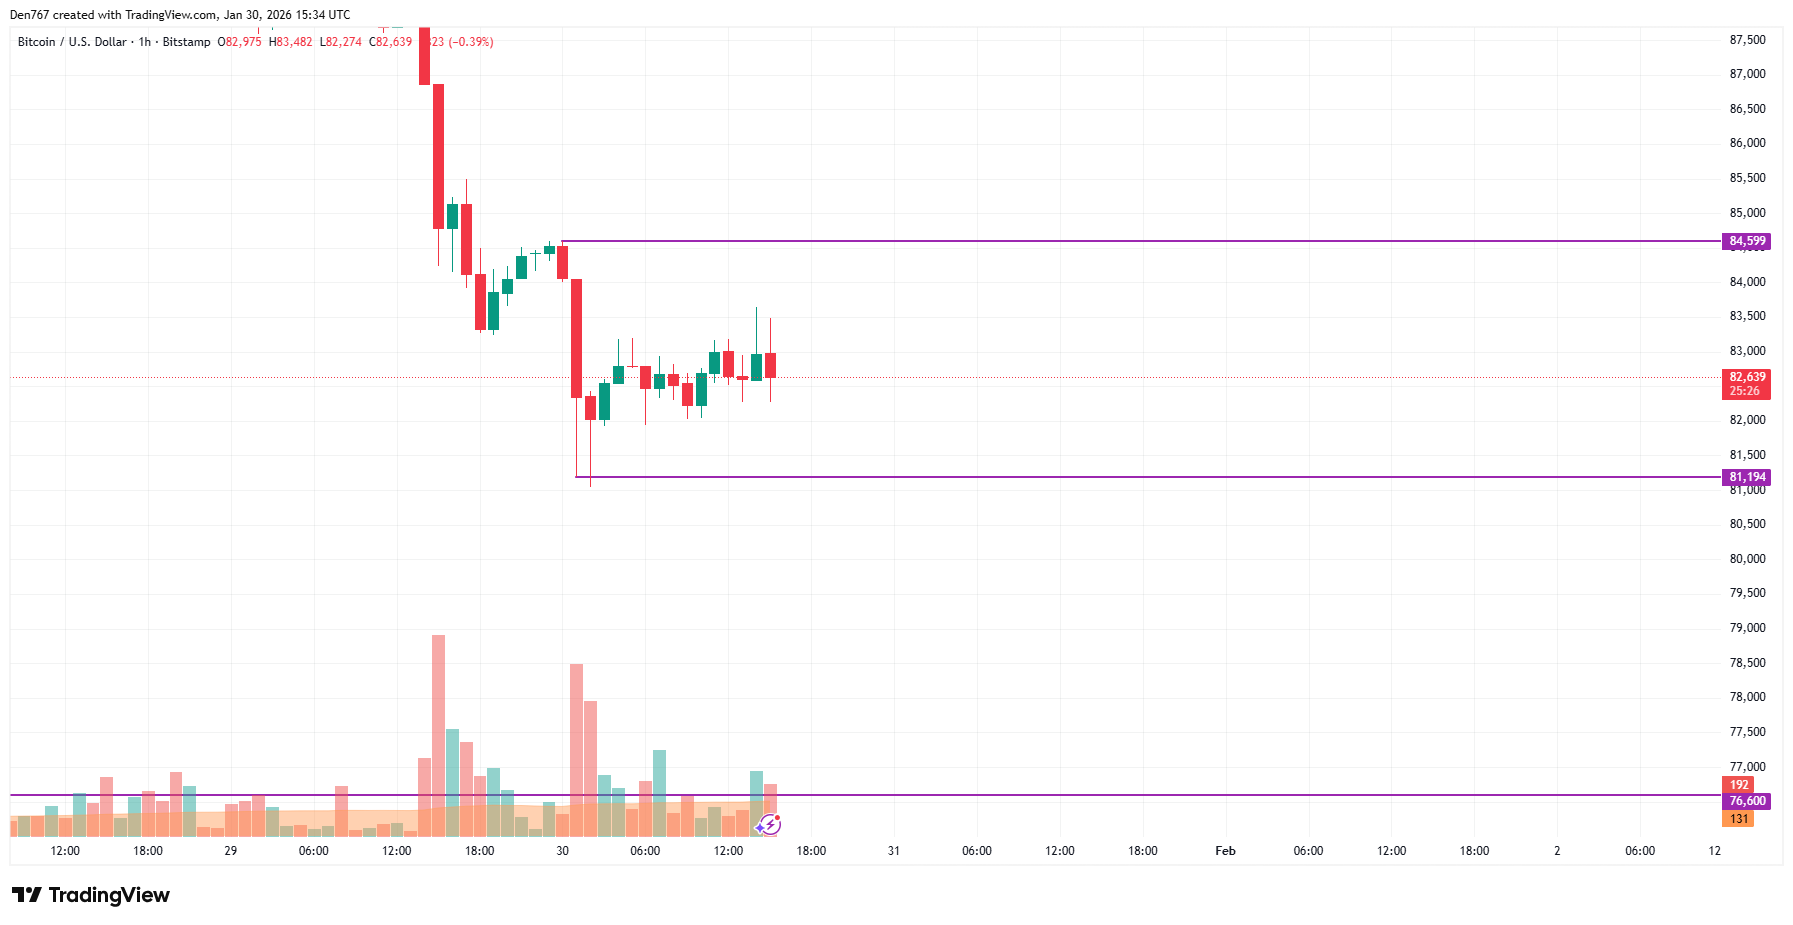
On the hourly chart, the price of $BTC is in the middle of the local channel. As most of the daily ATR has passed, there are low chances of seeing sharp moves by tomorrow.
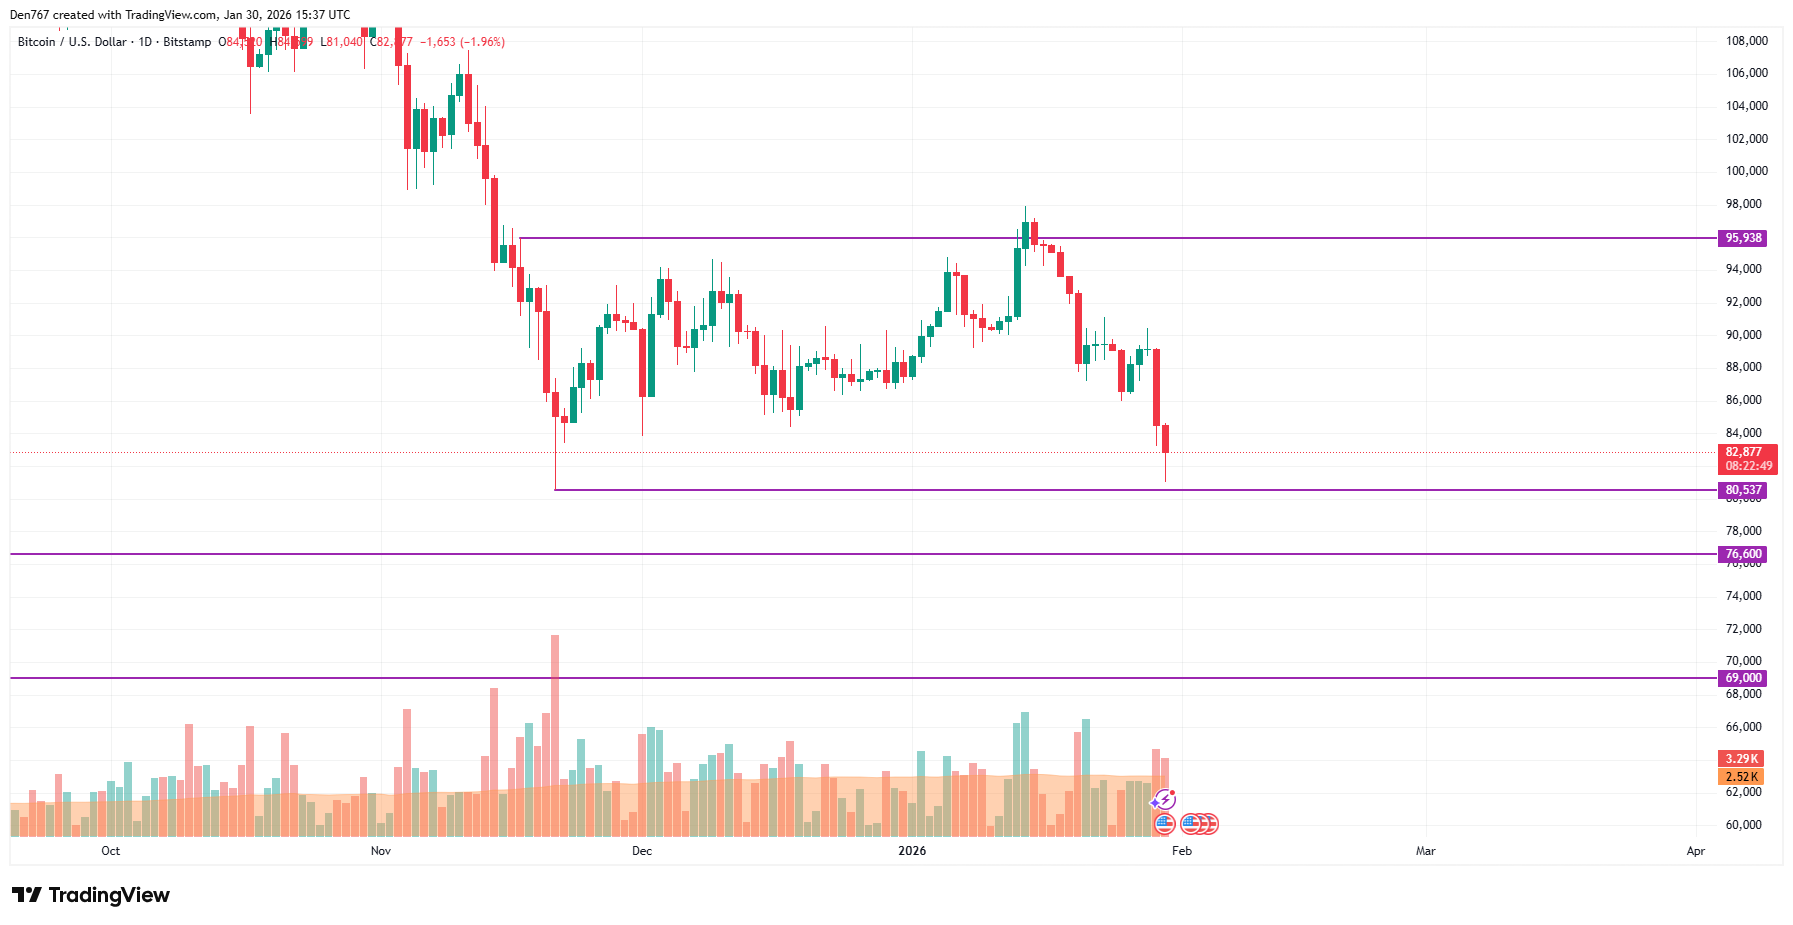
On the longer time frame, traders should focus on the nearest support level at $80,537.
If its breakout occurs, the accumulated energy might be enough for a dump to the $78,000-$80,000 zone.
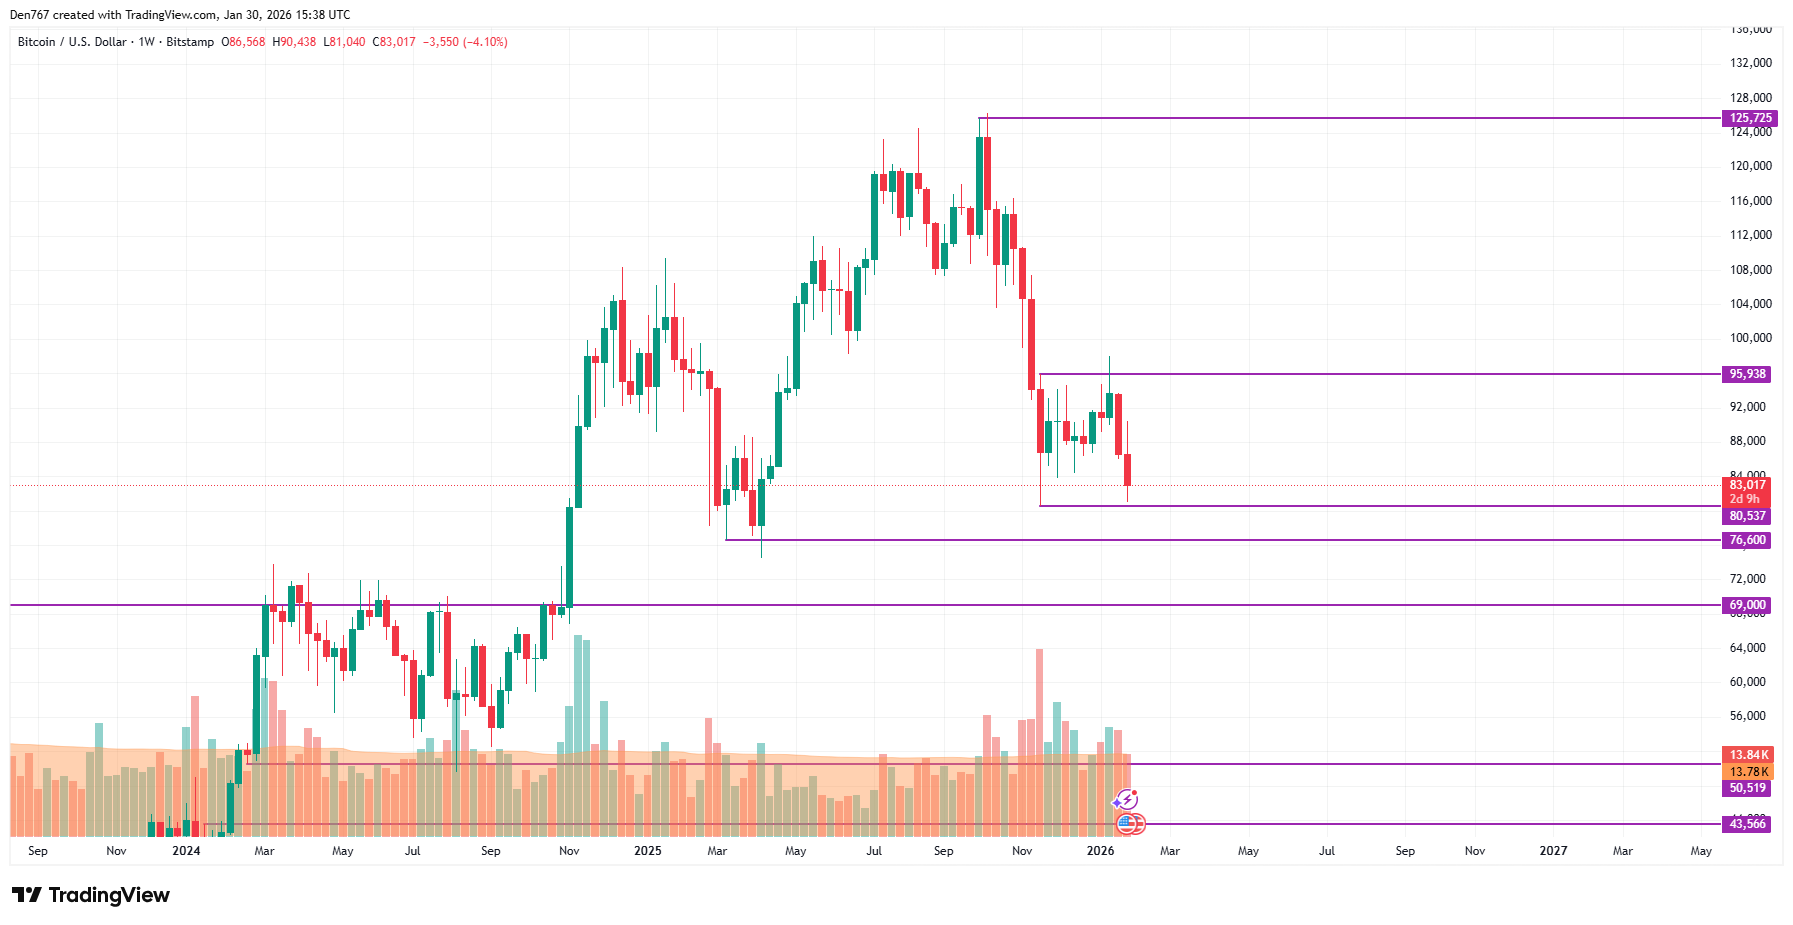
A similar picture can be seen on the weekly chart. The volume remains low, which means buyers are not ready yet to seize the initiative. All in all, a further correction is the most likely scenario for the first cryptocurrency.
Bitcoin is trading at $82,960 at press time.


