


 23
23
The crypto market is facing an identity crisis. While gold blasted past $5,600 per ounce and silver topped $121 this week, Bitcoin has been getting hammered. It's a painful reminder that when macro uncertainty hits, investors still reach for traditional safe havens first—and crypto second, if at all.
All three assets are billed as stores of value, hedges against currency debasement and government overreach. But gold and silver are casually adding hundreds of billions in market value in a matter of days while BTC bleeds.
Why? Rising odds of a U.S. government shutdown, Fed uncertainty, and the looming threat of Japanese yen intervention have investors scrambling for assets with decades of crisis-tested reliability.
Bitcoin's 15-year track record just doesn't cut it when fear takes over, and the altcoin market is bleeding even more, with Dogecoin, XRP and other coins posting severe losses.
Death cross deepens the pain
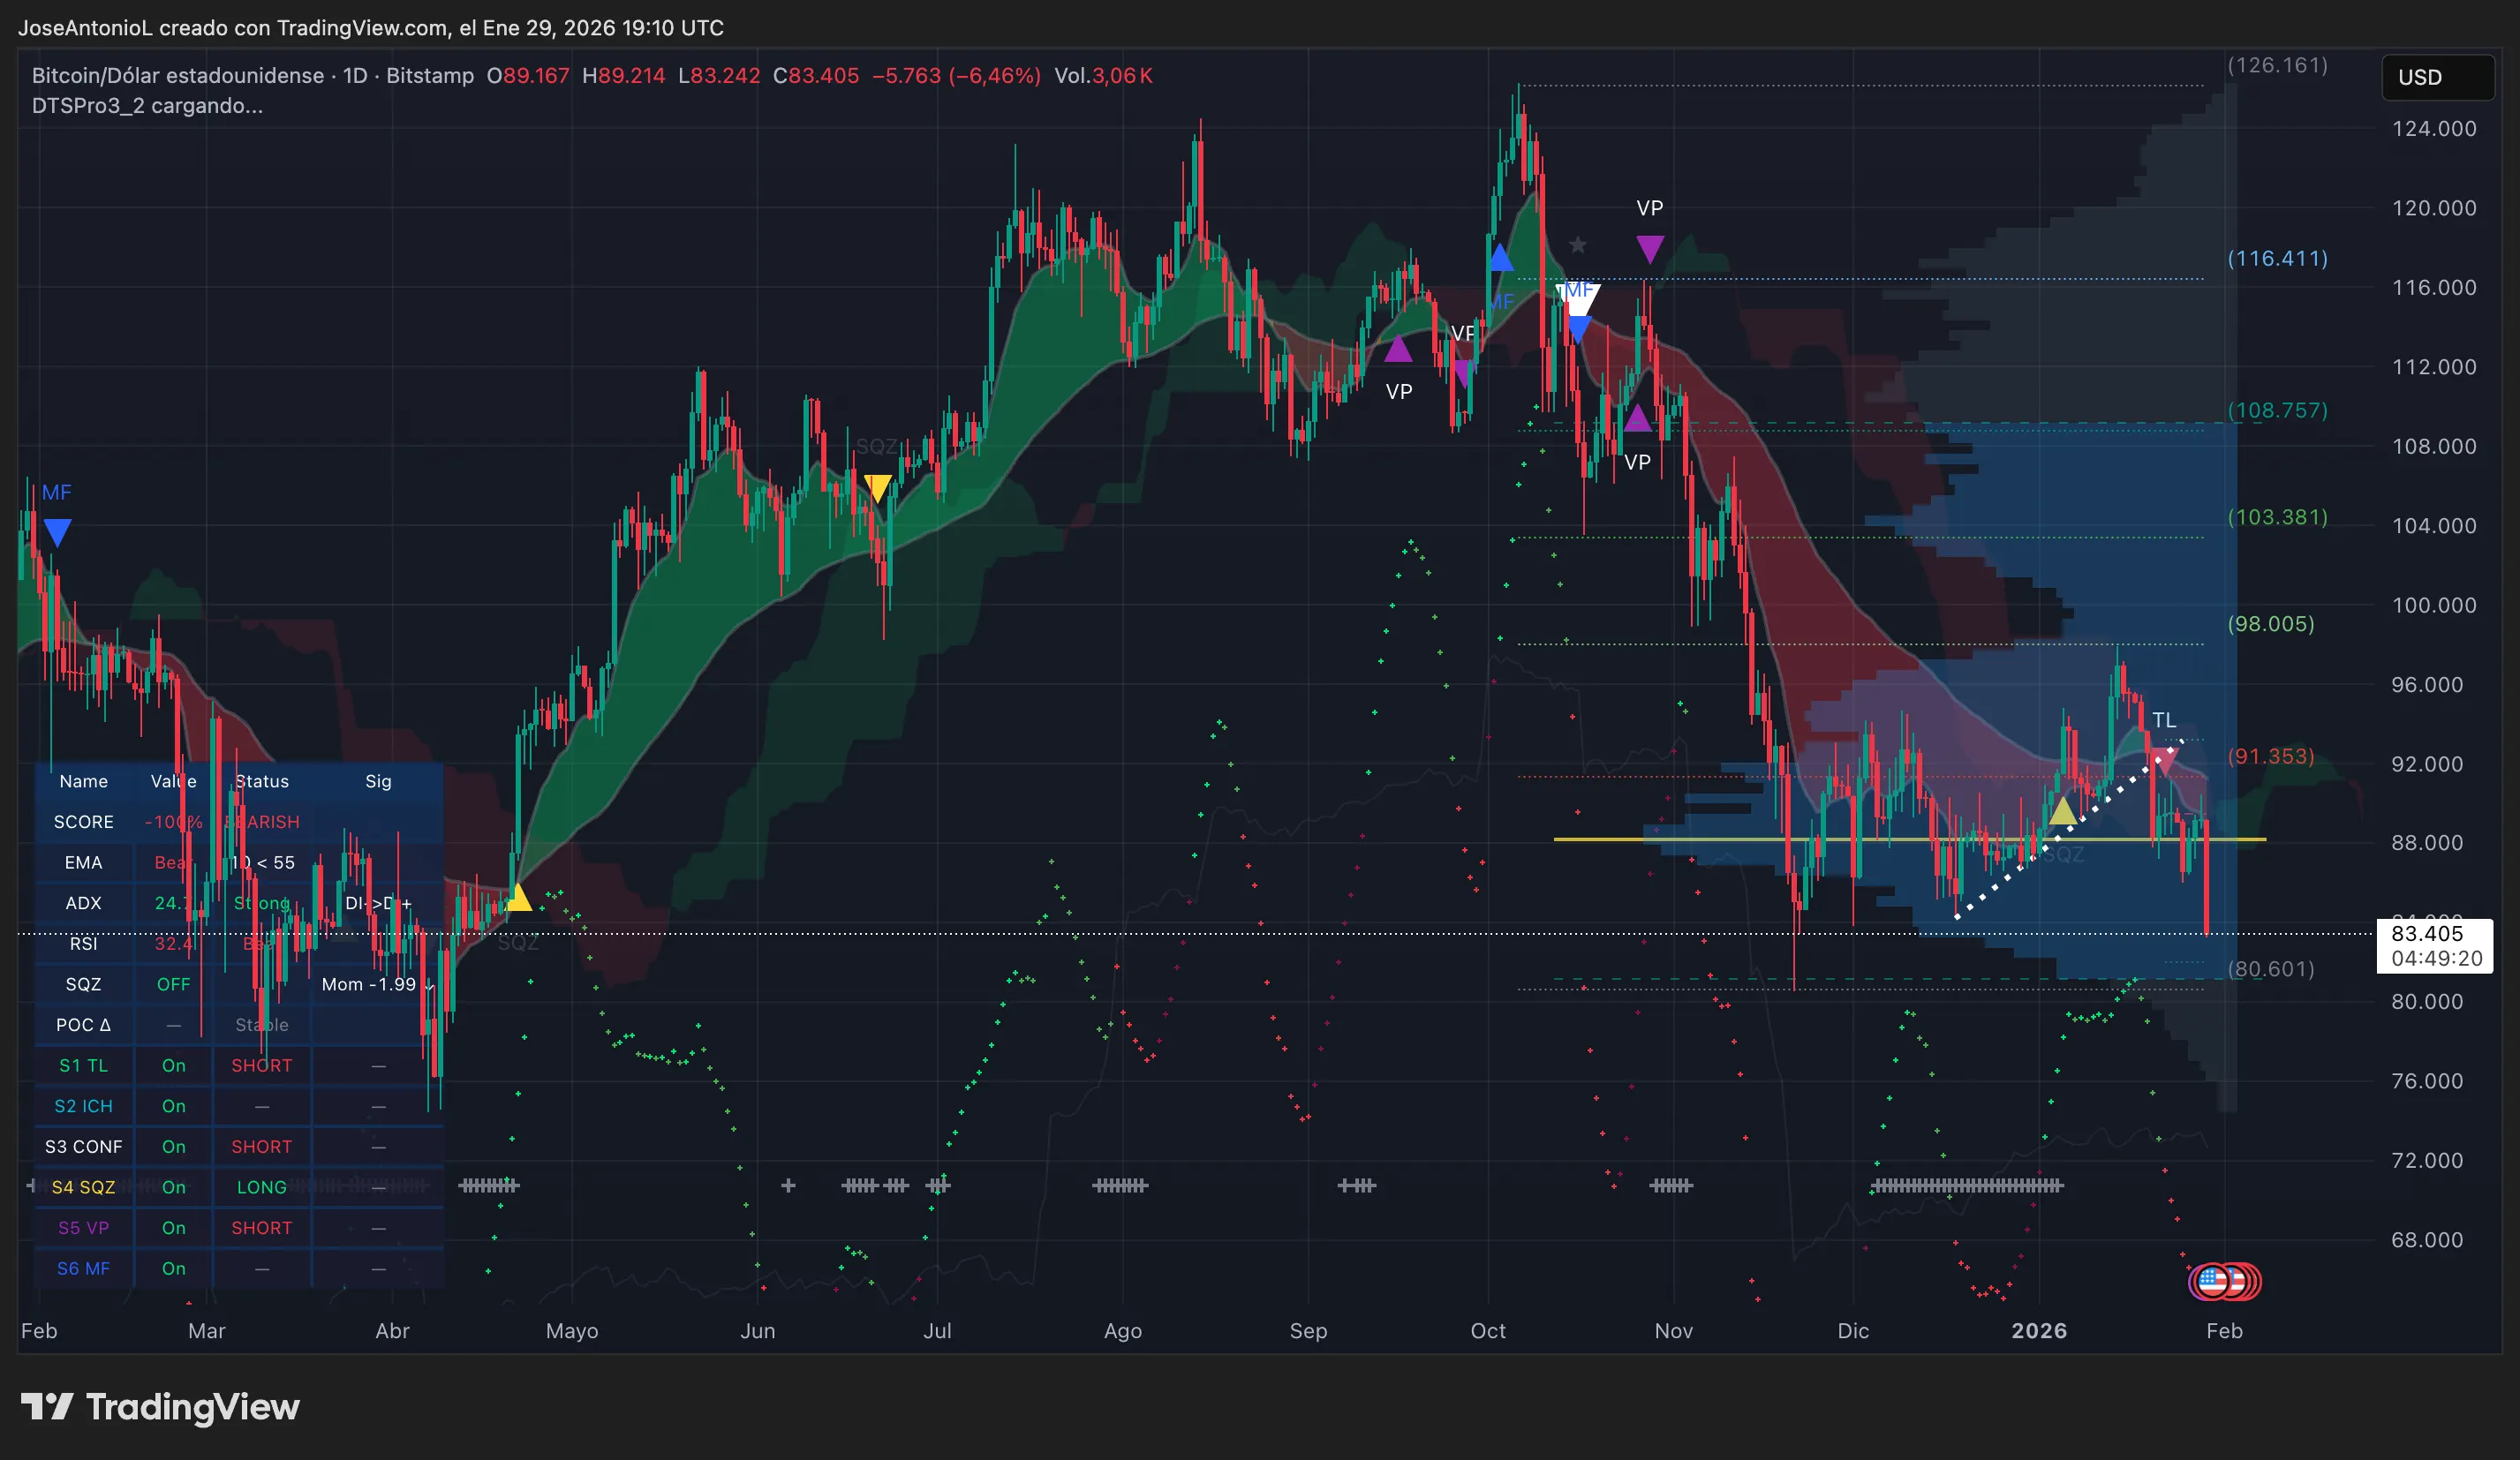
Bitcoin was recently trading at $83,405, down 6.46% or $5,763 from yesterday's levels. The price has sliced through multiple support zones on its way down from January's high near $97,000, and the technical picture suggests this isn't over yet.
The death cross—when the 50-day Exponential Moving Average crosses below the 200-day EMA—is Bitcoin's most ominous long-term bearish signal.
Think of it like this: The short-term average represents where traders have been buying recently, and the long-term average shows where investors have positioned over months. When the short-term mark dips below the long-term, it means recent buyers are underwater, and the market structure is turning decisively bearish. This pattern has historically preceded major Bitcoin drawdowns, including the brutal 2022 collapse and the 2018 bear market.
Do the math. Watch the death cross increase after an unsuccessful attempt to bounce, and 2026 may prove that history repeats itself, unleashing a crypto winter that follows the pattern of three bullish years followed by a bearish one.
The 50-day EMA sits around $88,000, acting as immediate overhead resistance that bulls have failed to reclaim. Bitcoin is now trading well below both moving averages, which creates a nasty ceiling that needs to break before any meaningful recovery can start.
The Average Directional Index, or ADX, reads 24—just below the 25 threshold that confirms a strong trend is in place. ADX measures trend strength regardless of direction, so readings above 25 tell traders that there's real conviction behind price moves, not just noise. At 24, the strength of the price correction from previous weeks appears to be weakening fast.
Volume has been elevated during this decline, which is a sign that this isn't just low-liquidity chop. Real sellers are hitting the market.
The Squeeze Momentum Indicator shows "Off" status, meaning there's no compression or coiling energy building for a big move. If anything, all the price pressure has been released to the downside. Combined with the bearish price action, this suggests Bitcoin could grind lower rather than snap back with a sharp reversal.
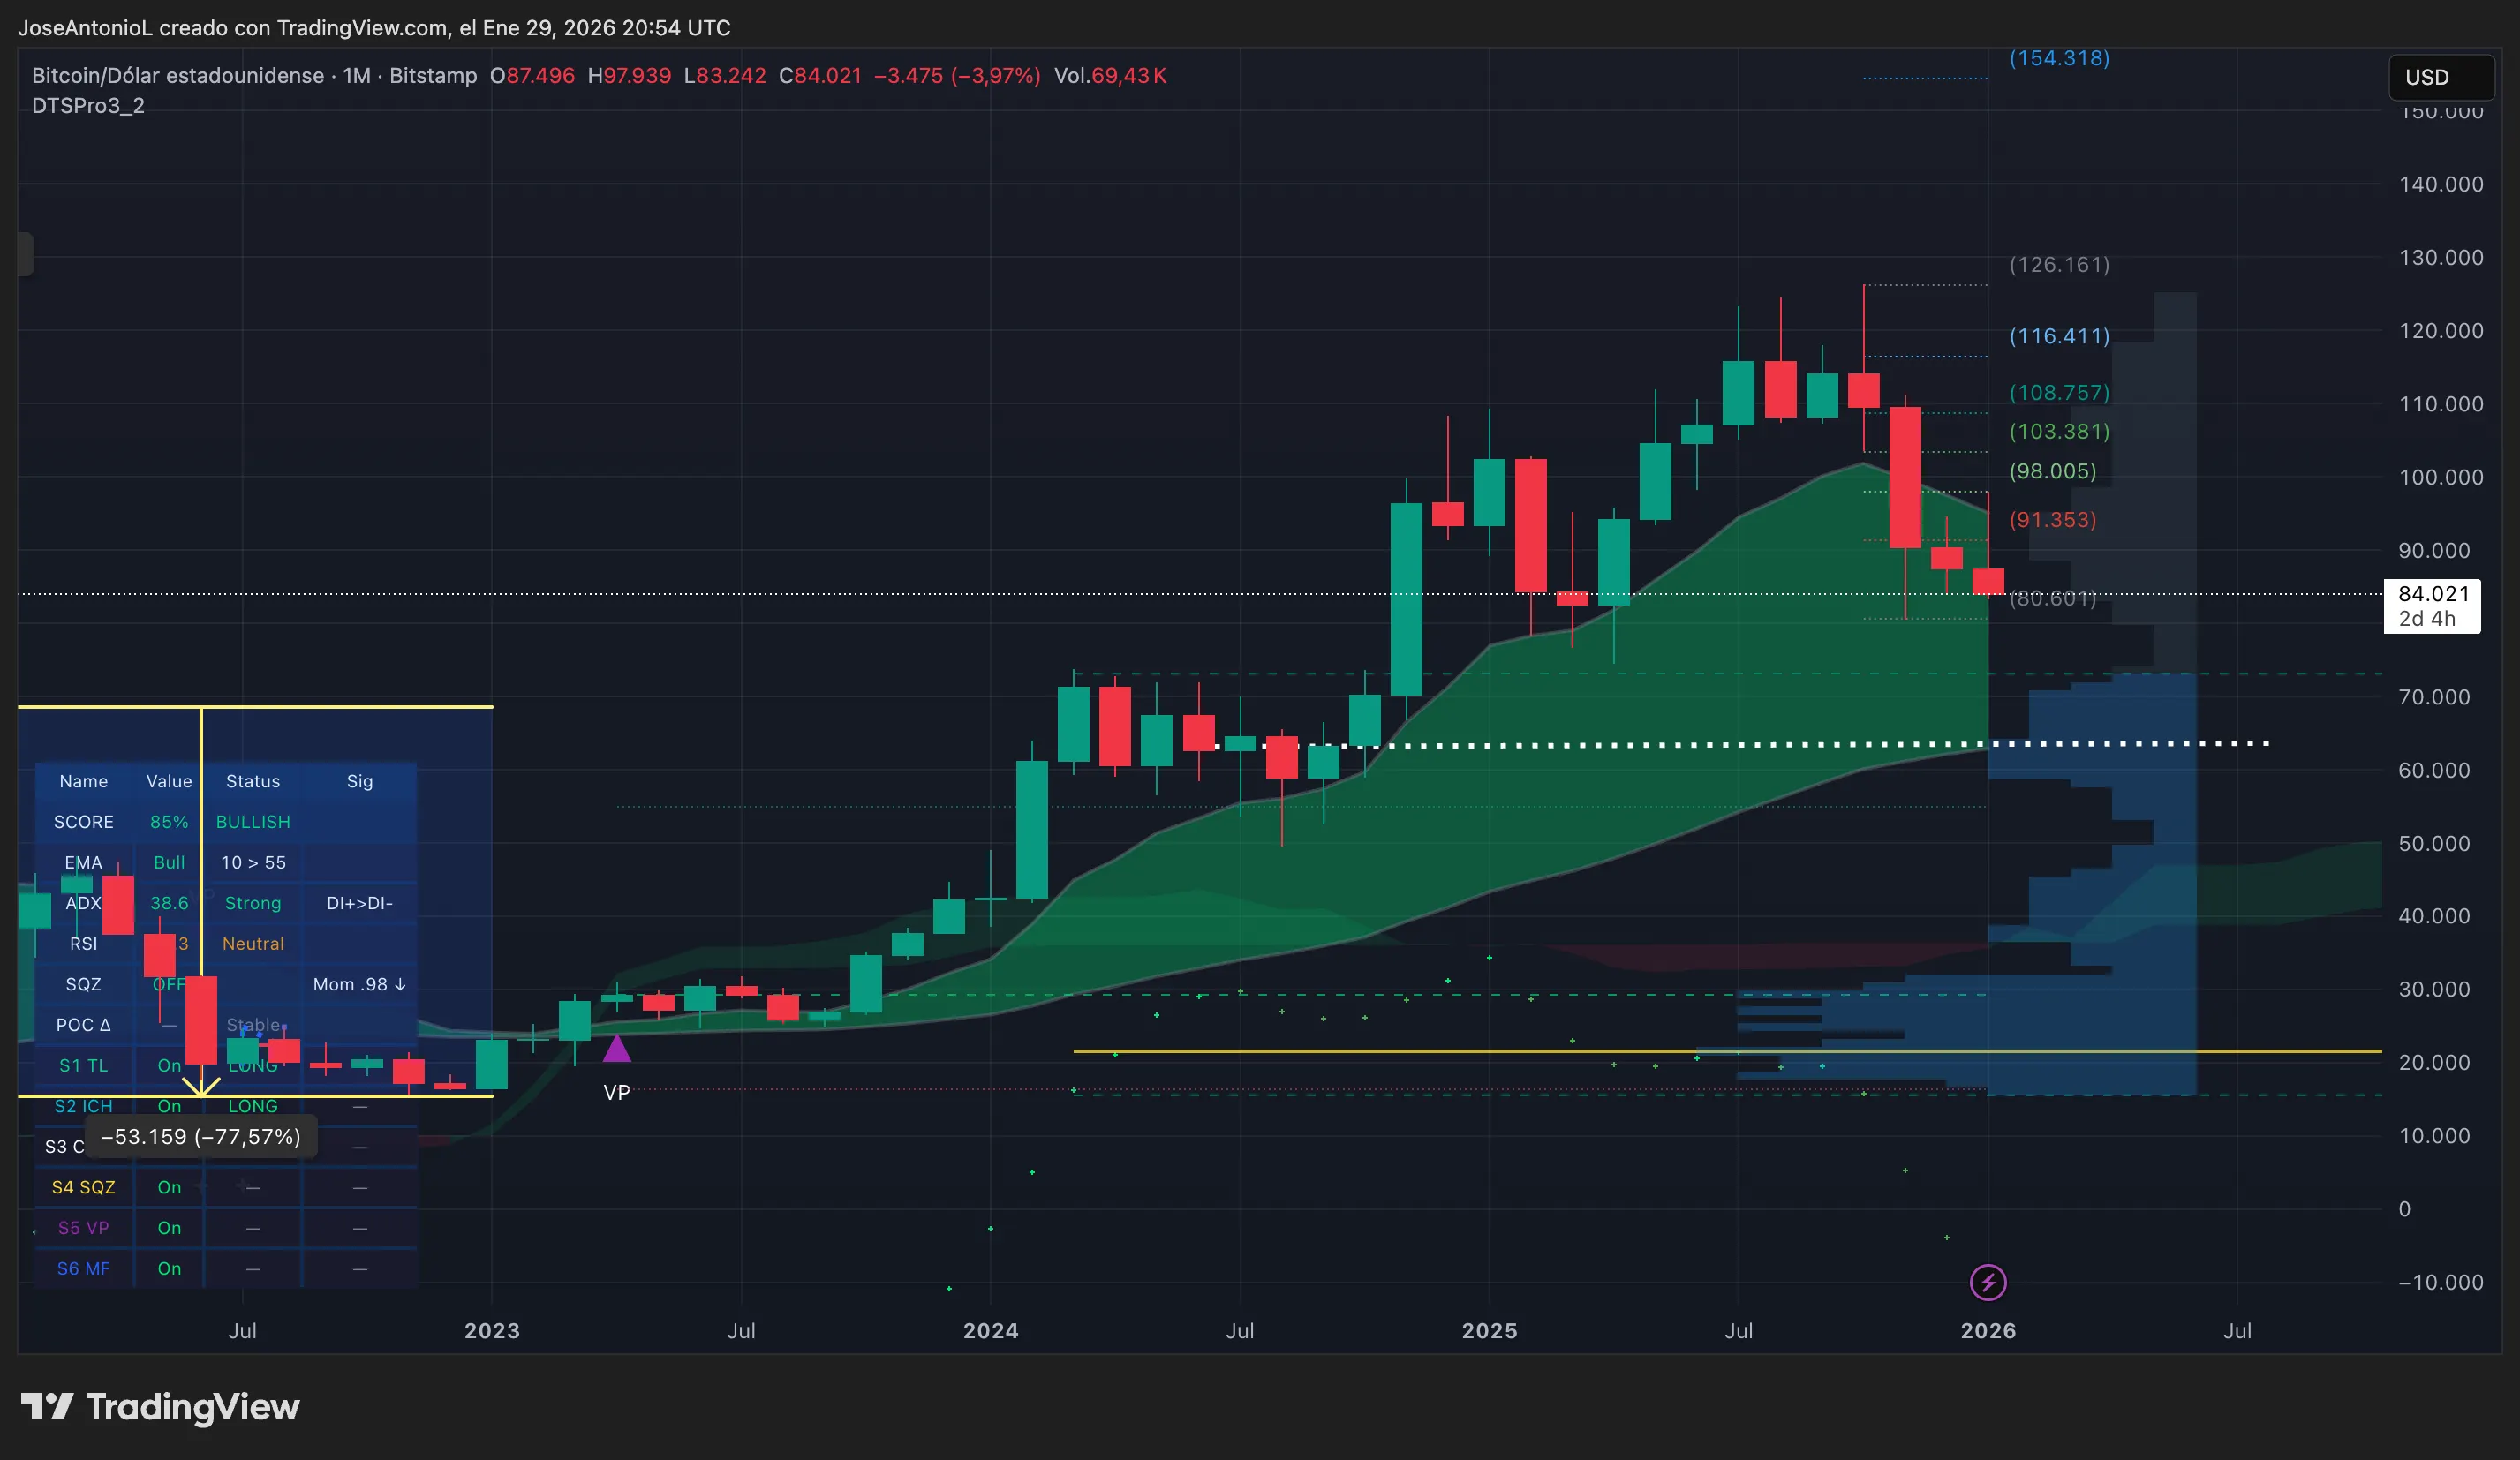
If the $80,600 support fails, then the $74,000 zone could be the next major target—the April 2025 lows where Bitcoin previously bounced. A break there would open the door to an even uglier, but improbable scenario around $65,000 where the 200-day EMA provides long-term support in the monthly charts.
For now, the path of least resistance is down. Bulls need to see a daily close above $88,000 with rising ADX to suggest the tide is turning. Until then, expect more chop, more pain, and more headlines about how gold is eating Bitcoin's lunch.
Key levels to watch:
- Resistance:
- $88,000 (50-day EMA, immediate)
- $92,000 (broken support turned resistance)
- $108,757 (volume profile zone)
- Support:
- $83,381 (volume profile zone)
- $80,601 (strong support)
- $74,000 (April 2025 lows)
Disclaimer
The views and opinions expressed by the author are for informational purposes only and do not constitute financial, investment, or other advice.
