


 18
18
Over the last hour, the digital heavyweight stands at $89,884 to $90,136 per coin with a market cap of $1.79 trillion. In the past 24 hours, its trading volume soared to $47.40 billion, squeezing between an intraday low of $87,315 and a high of $89,963. Despite some faltering momentum, the charts suggest bitcoin is playing the long game—calculated, poised, and just a bit coy with the next move.
Bitcoin Chart Outlook
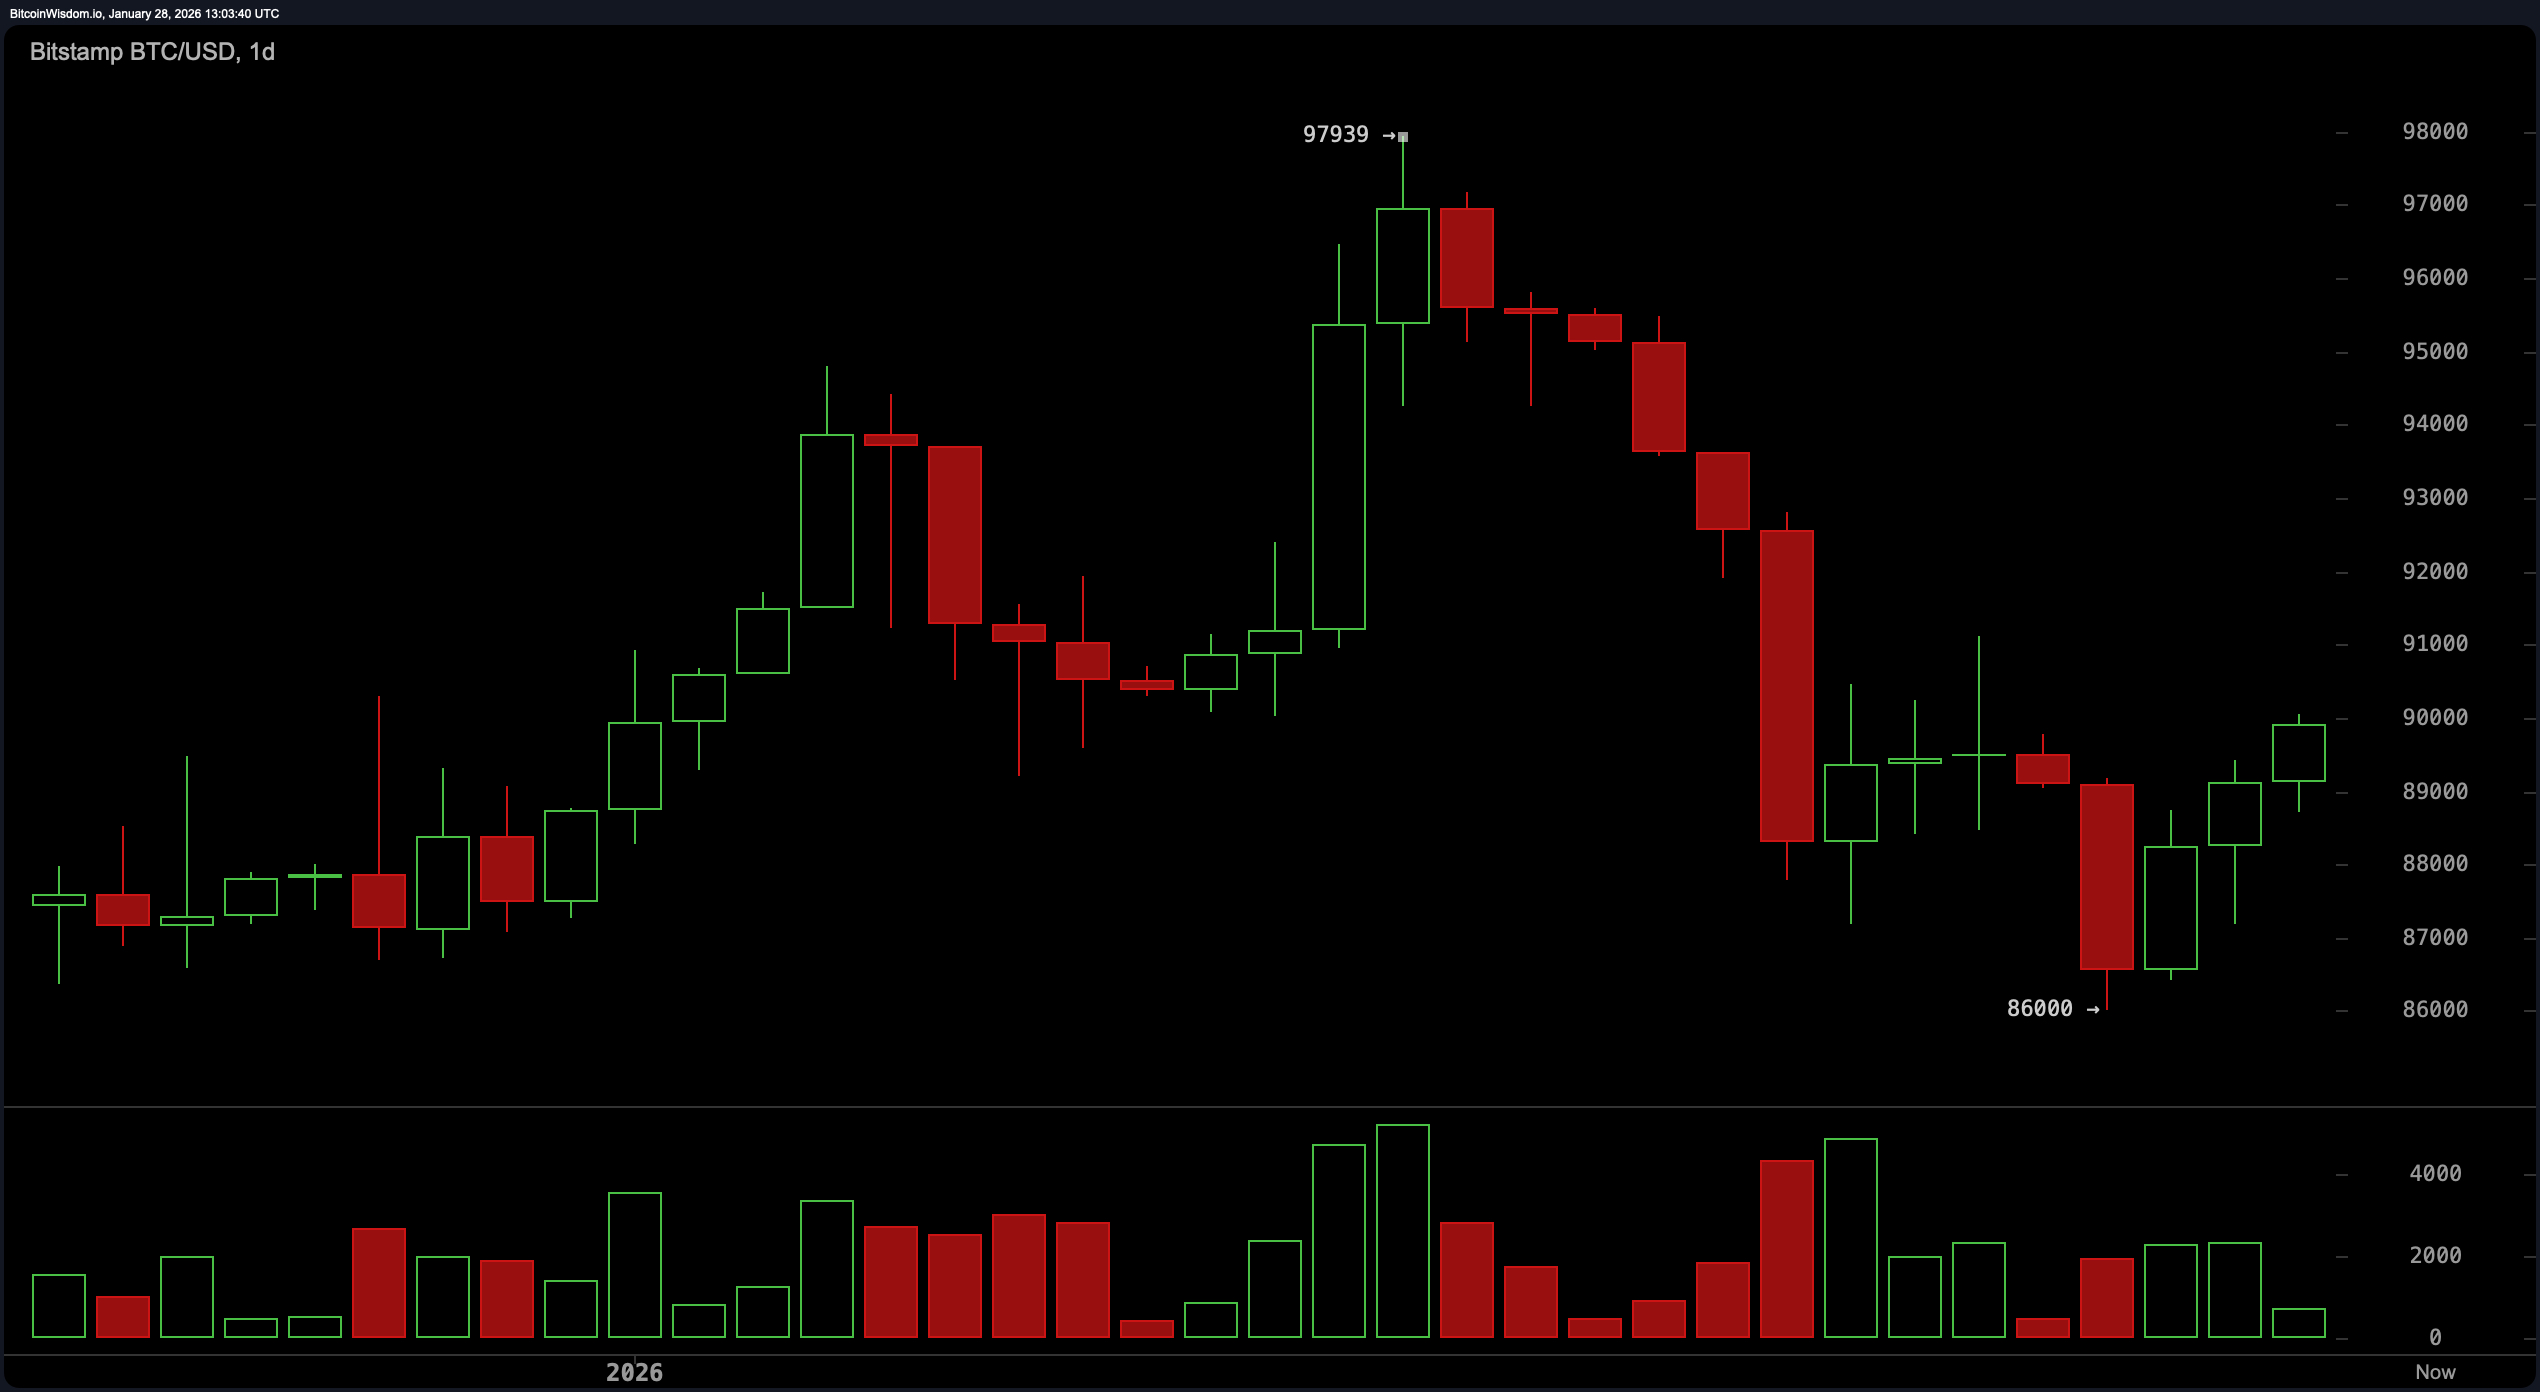
The daily chart paints a recovery in progress, though not without its drama. After topping near $97,939, bitcoin took a nosedive to $86,000—only to claw back up with just enough conviction to turn heads. High- volume capitulation marked the sell-off, but a flicker of green on lighter volume hints at early bullish re-entry.
With support around $86,000 holding firm, a tentative bottom appears to be forming. Still, resistance between $91,000 and $93,000 is where things get dicey, and traders may want to keep one eye on candle behavior and another on volume divergence near those zones.
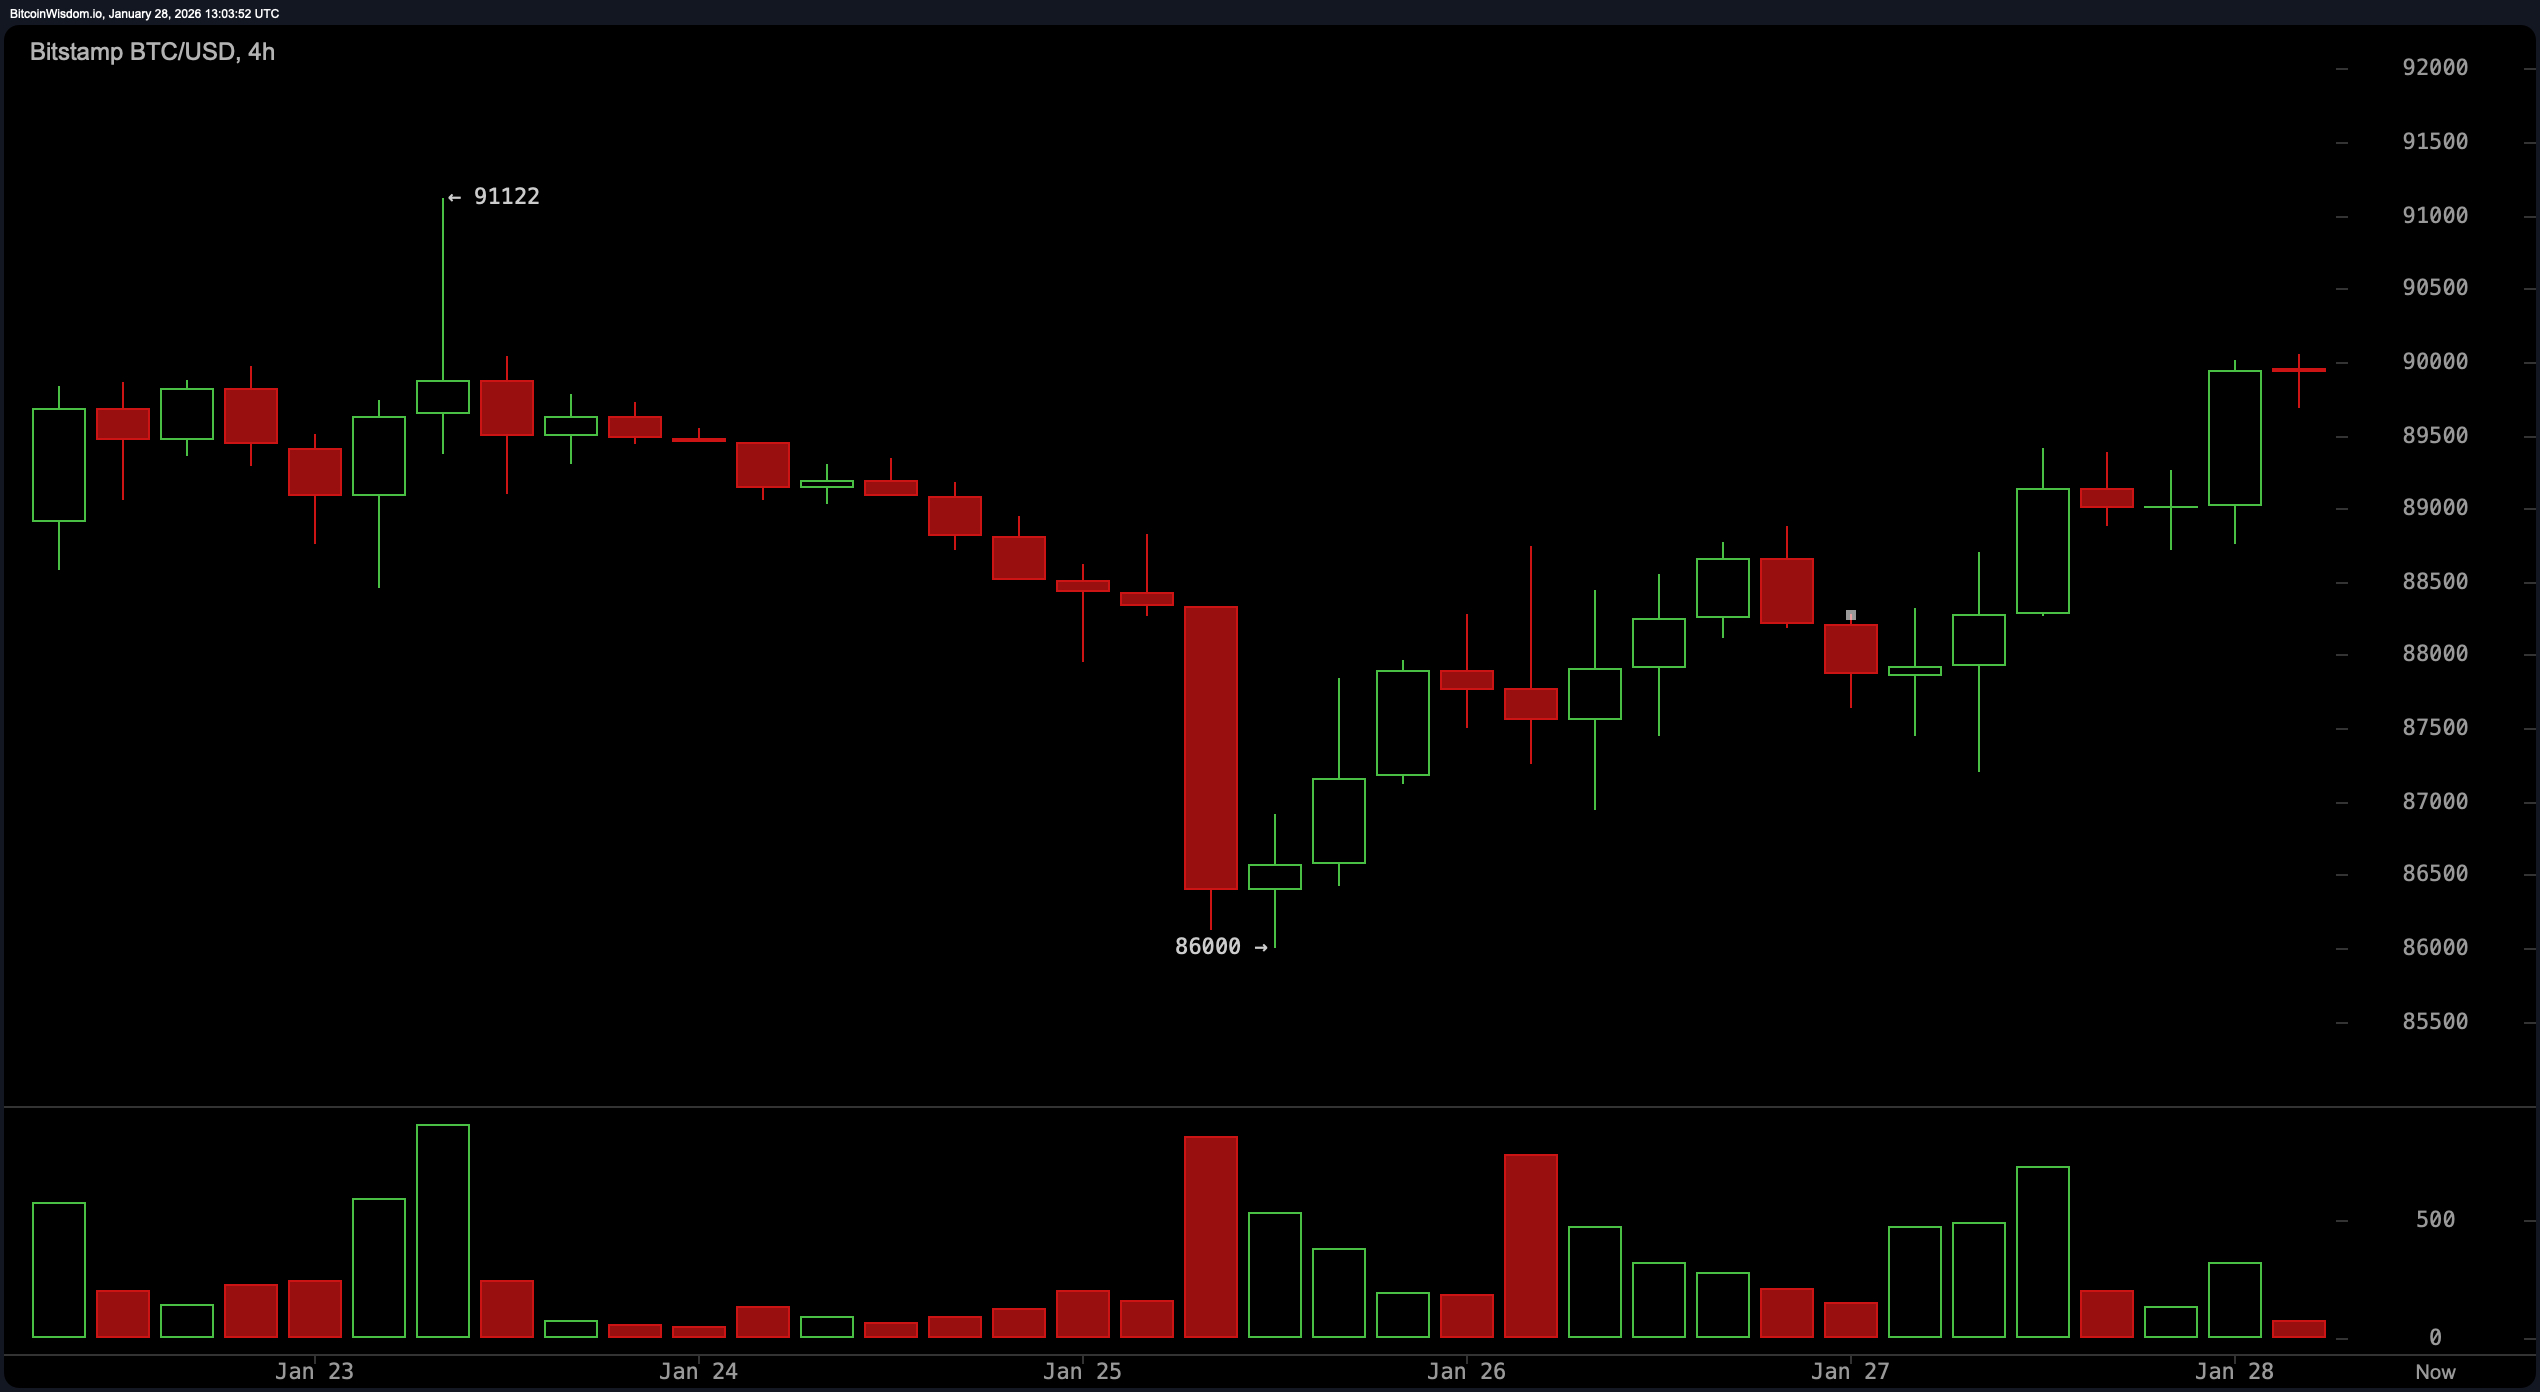
Zooming in on the 4-hour chart, bitcoin seems to be catching its breath after its recent sprint. The pattern since the January 25 low at $86,000 resembles a rounded bottom—a classic shape for staged recovery. Prices have since crept up in a stair-step fashion, but the resistance around $90,000 to $91,000 is acting like a velvet rope outside an exclusive club: it’s letting some through, but not without hesitation. A modest build-up in momentum is visible, but it’s conspicuously lacking the kind of volume one might expect for a breakout encore. A cautious approach may be warranted as the structure tests the overhead barrier.
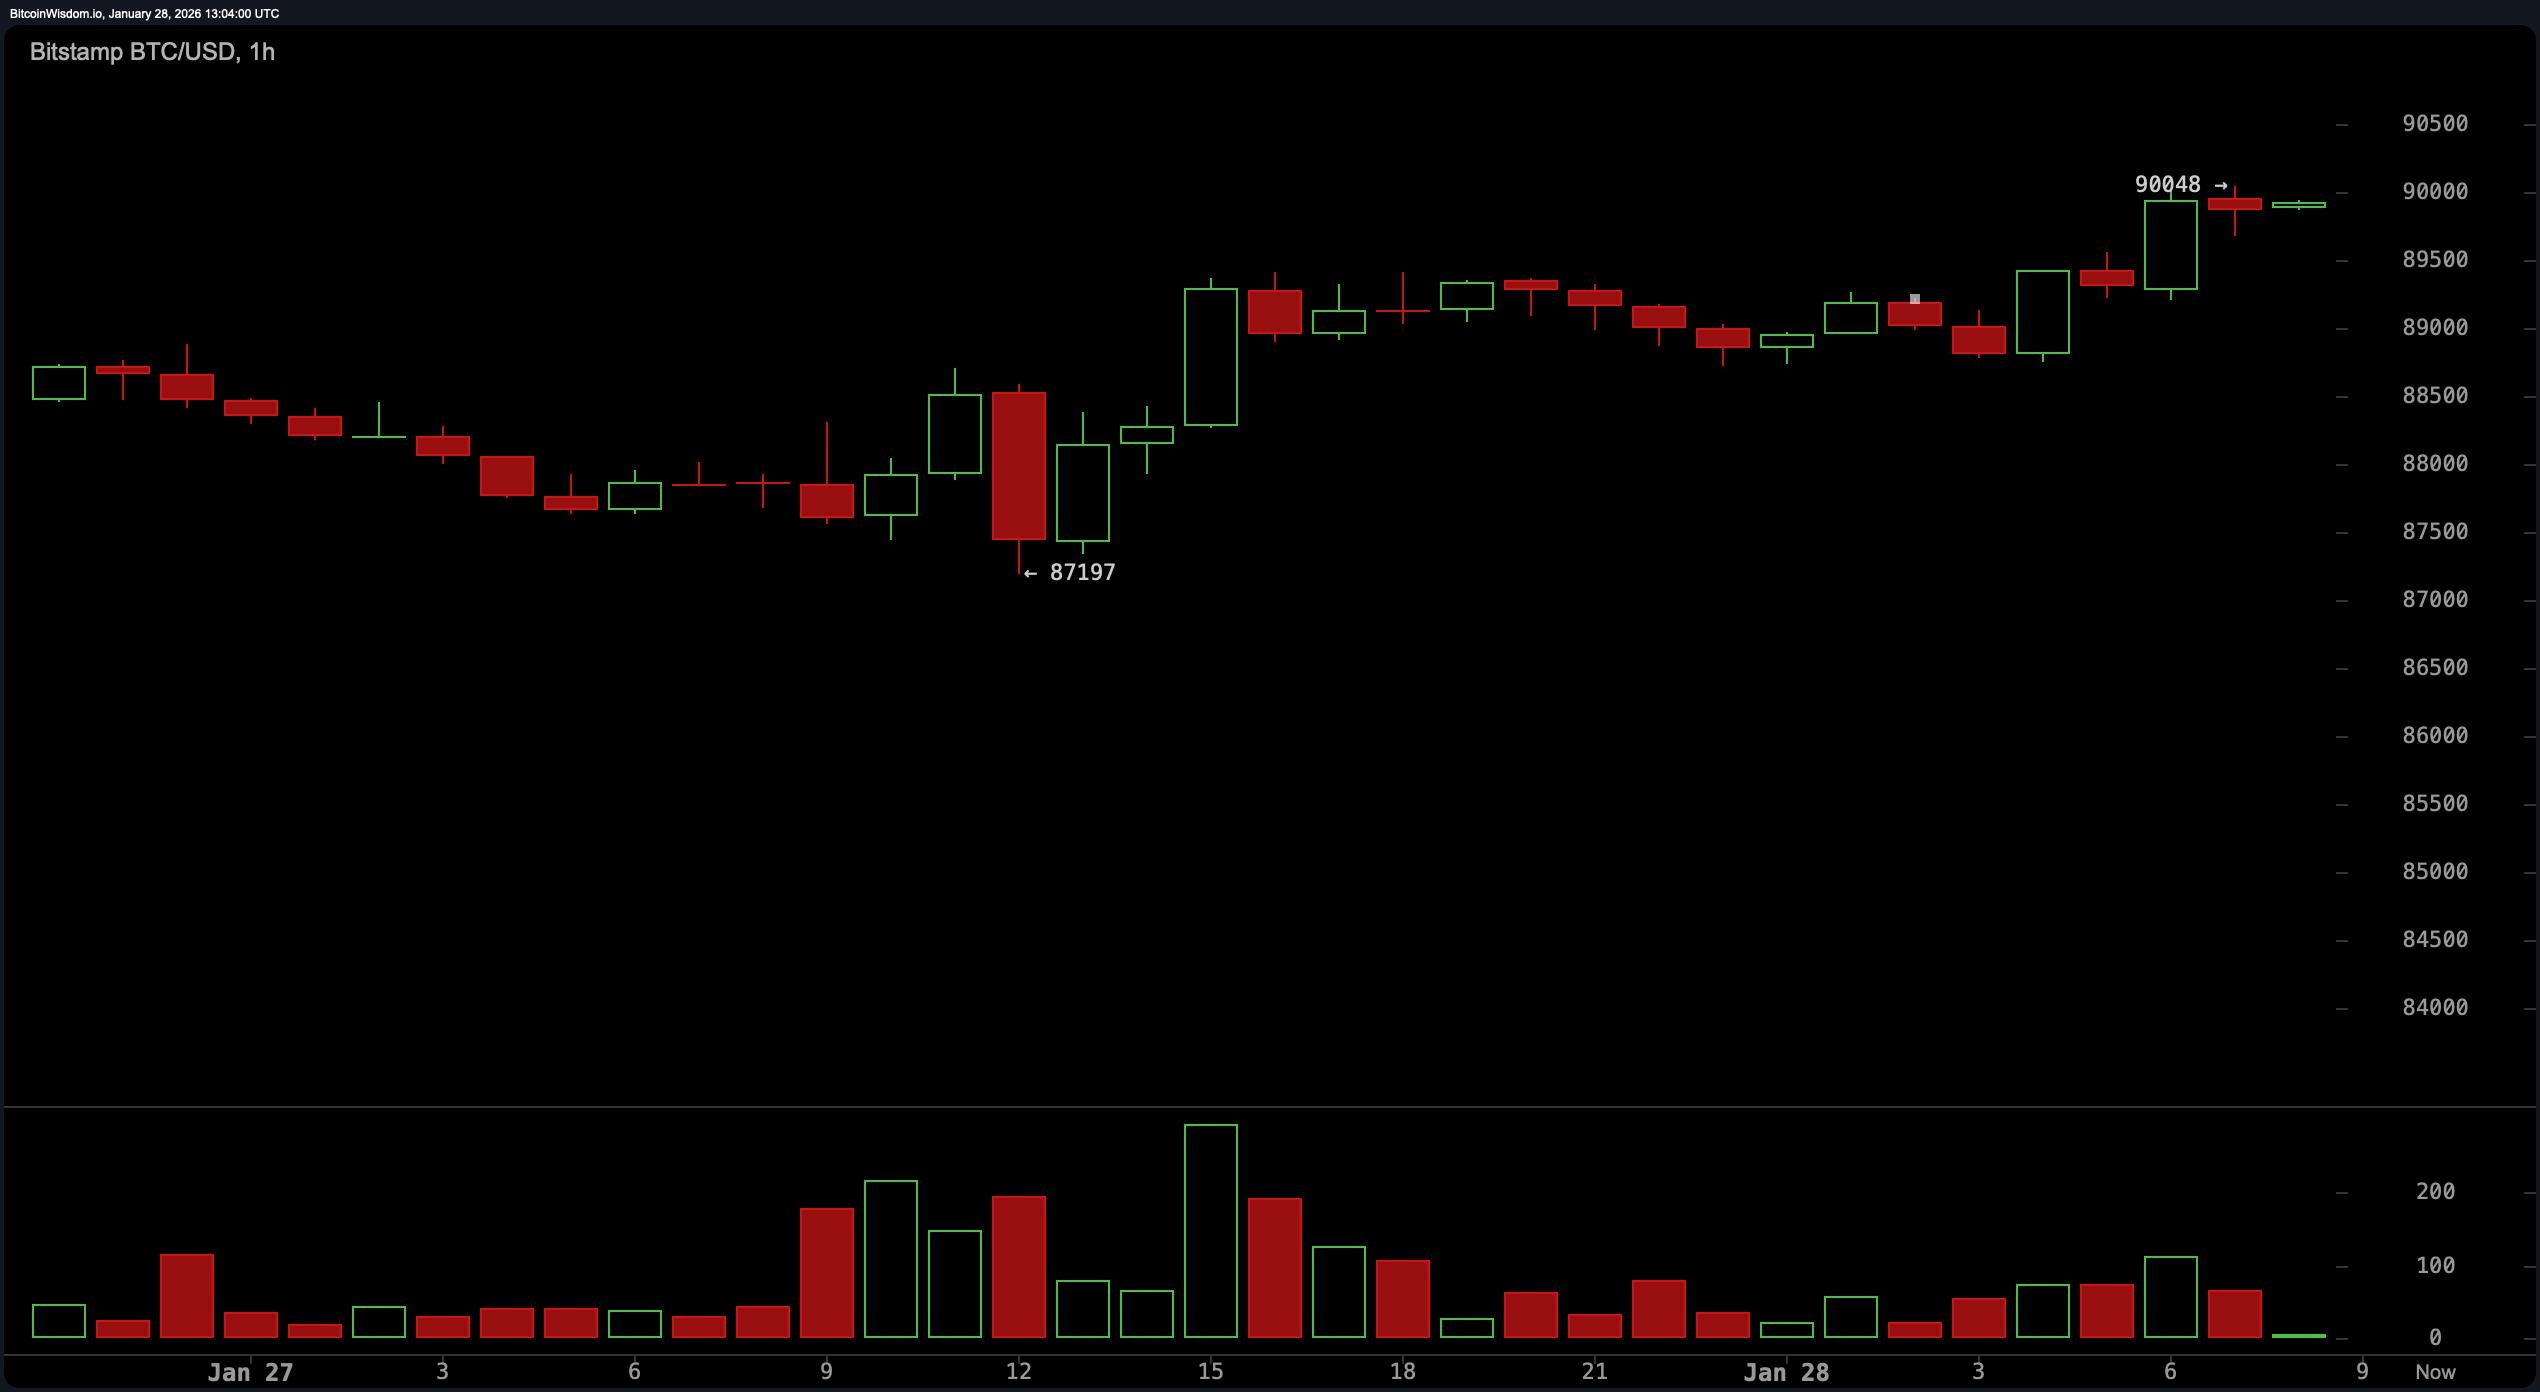
On the 1-hour chart, bitcoin’s behavior turns flirtatiously bullish. After bottoming at $87,197, the price has not only printed higher lows and highs but also formed a tight consolidation just under the recent high of $90,048. While momentum seems intact, the shrinking volume suggests a pause might be imminent—either a mild correction or just bitcoin catching its breath. Dip-buyers are eyeing the $88,700 to $89,000 range, provided it comes with a reversal candle as garnish. Short-term targets are clustered just above $90,000, although a strong breakout could send those ceiling tiles flying.
Oscillators are not giving away much either—each playing it cool with a neutral stance. The relative strength index ( RSI) sits at 48, neither overbought nor oversold, keeping the guessing game alive. The stochastic oscillator is down at 27, still neutral, while the commodity channel index (CCI) clocks in at a subdued −49. Meanwhile, the average directional index (ADX) holds a weak trend signal at 24, and the awesome oscillator is underwater at −2,200. Momentum, however, posts a contrarian move in the green zone, suggesting underlying strength, whereas the moving average convergence divergence ( MACD) spells out a different story altogether, dipping into bearish territory at −611.
Moving averages are practically at war with themselves. Short-term indicators, such as the 10-period exponential moving average (EMA) at 89,659 and the 10-period simple moving average (SMA) at 89,213, appear constructive. But the party ends quickly: the 20-period and 30-period EMAs and SMAs all point downward. The 50, 100, and 200-period moving averages aren’t offering any comfort either, hanging well above current price action and waving red flags from their lofty perches. It’s a split decision at best—short-term optimism meets long-term caution, and neither is backing down without a fight.
Bull Verdict:
If you’re rooting for bitcoin to charge ahead, the technicals offer enough breadcrumbs to follow. A bullish structure on lower timeframes, solid support at $86,000, and a spark of momentum indicate the bulls aren’t out of breath just yet. But they’ll need to punch through that $91,000 ceiling with volume and conviction to reclaim the spotlight.
Bear Verdict:
On the flip side, if this rally feels more like a sugar rush than sustained strength, you’re not alone. Momentum is thin, volume is cooling, and higher timeframe moving averages still cast a long shadow. Unless bitcoin can break above $91,000 with force, gravity may once again pull it toward the $86,000 support for a reality check.
FAQ ❓
- What is bitcoin’s current price? Bitcoin is trading at $89,884 to $90,136 as of Jan. 28, 2026, at 8 a.m. EST.
- What is the market sentiment around bitcoin today?Technical indicators show mixed momentum with key resistance at $91,000.
- Is bitcoin likely to break past $91,000 soon?Only a strong volume breakout can push bitcoin beyond that resistance.
- Where is bitcoin’s next support level?Key support remains near $86,000 following the recent bounce.