


 8
8
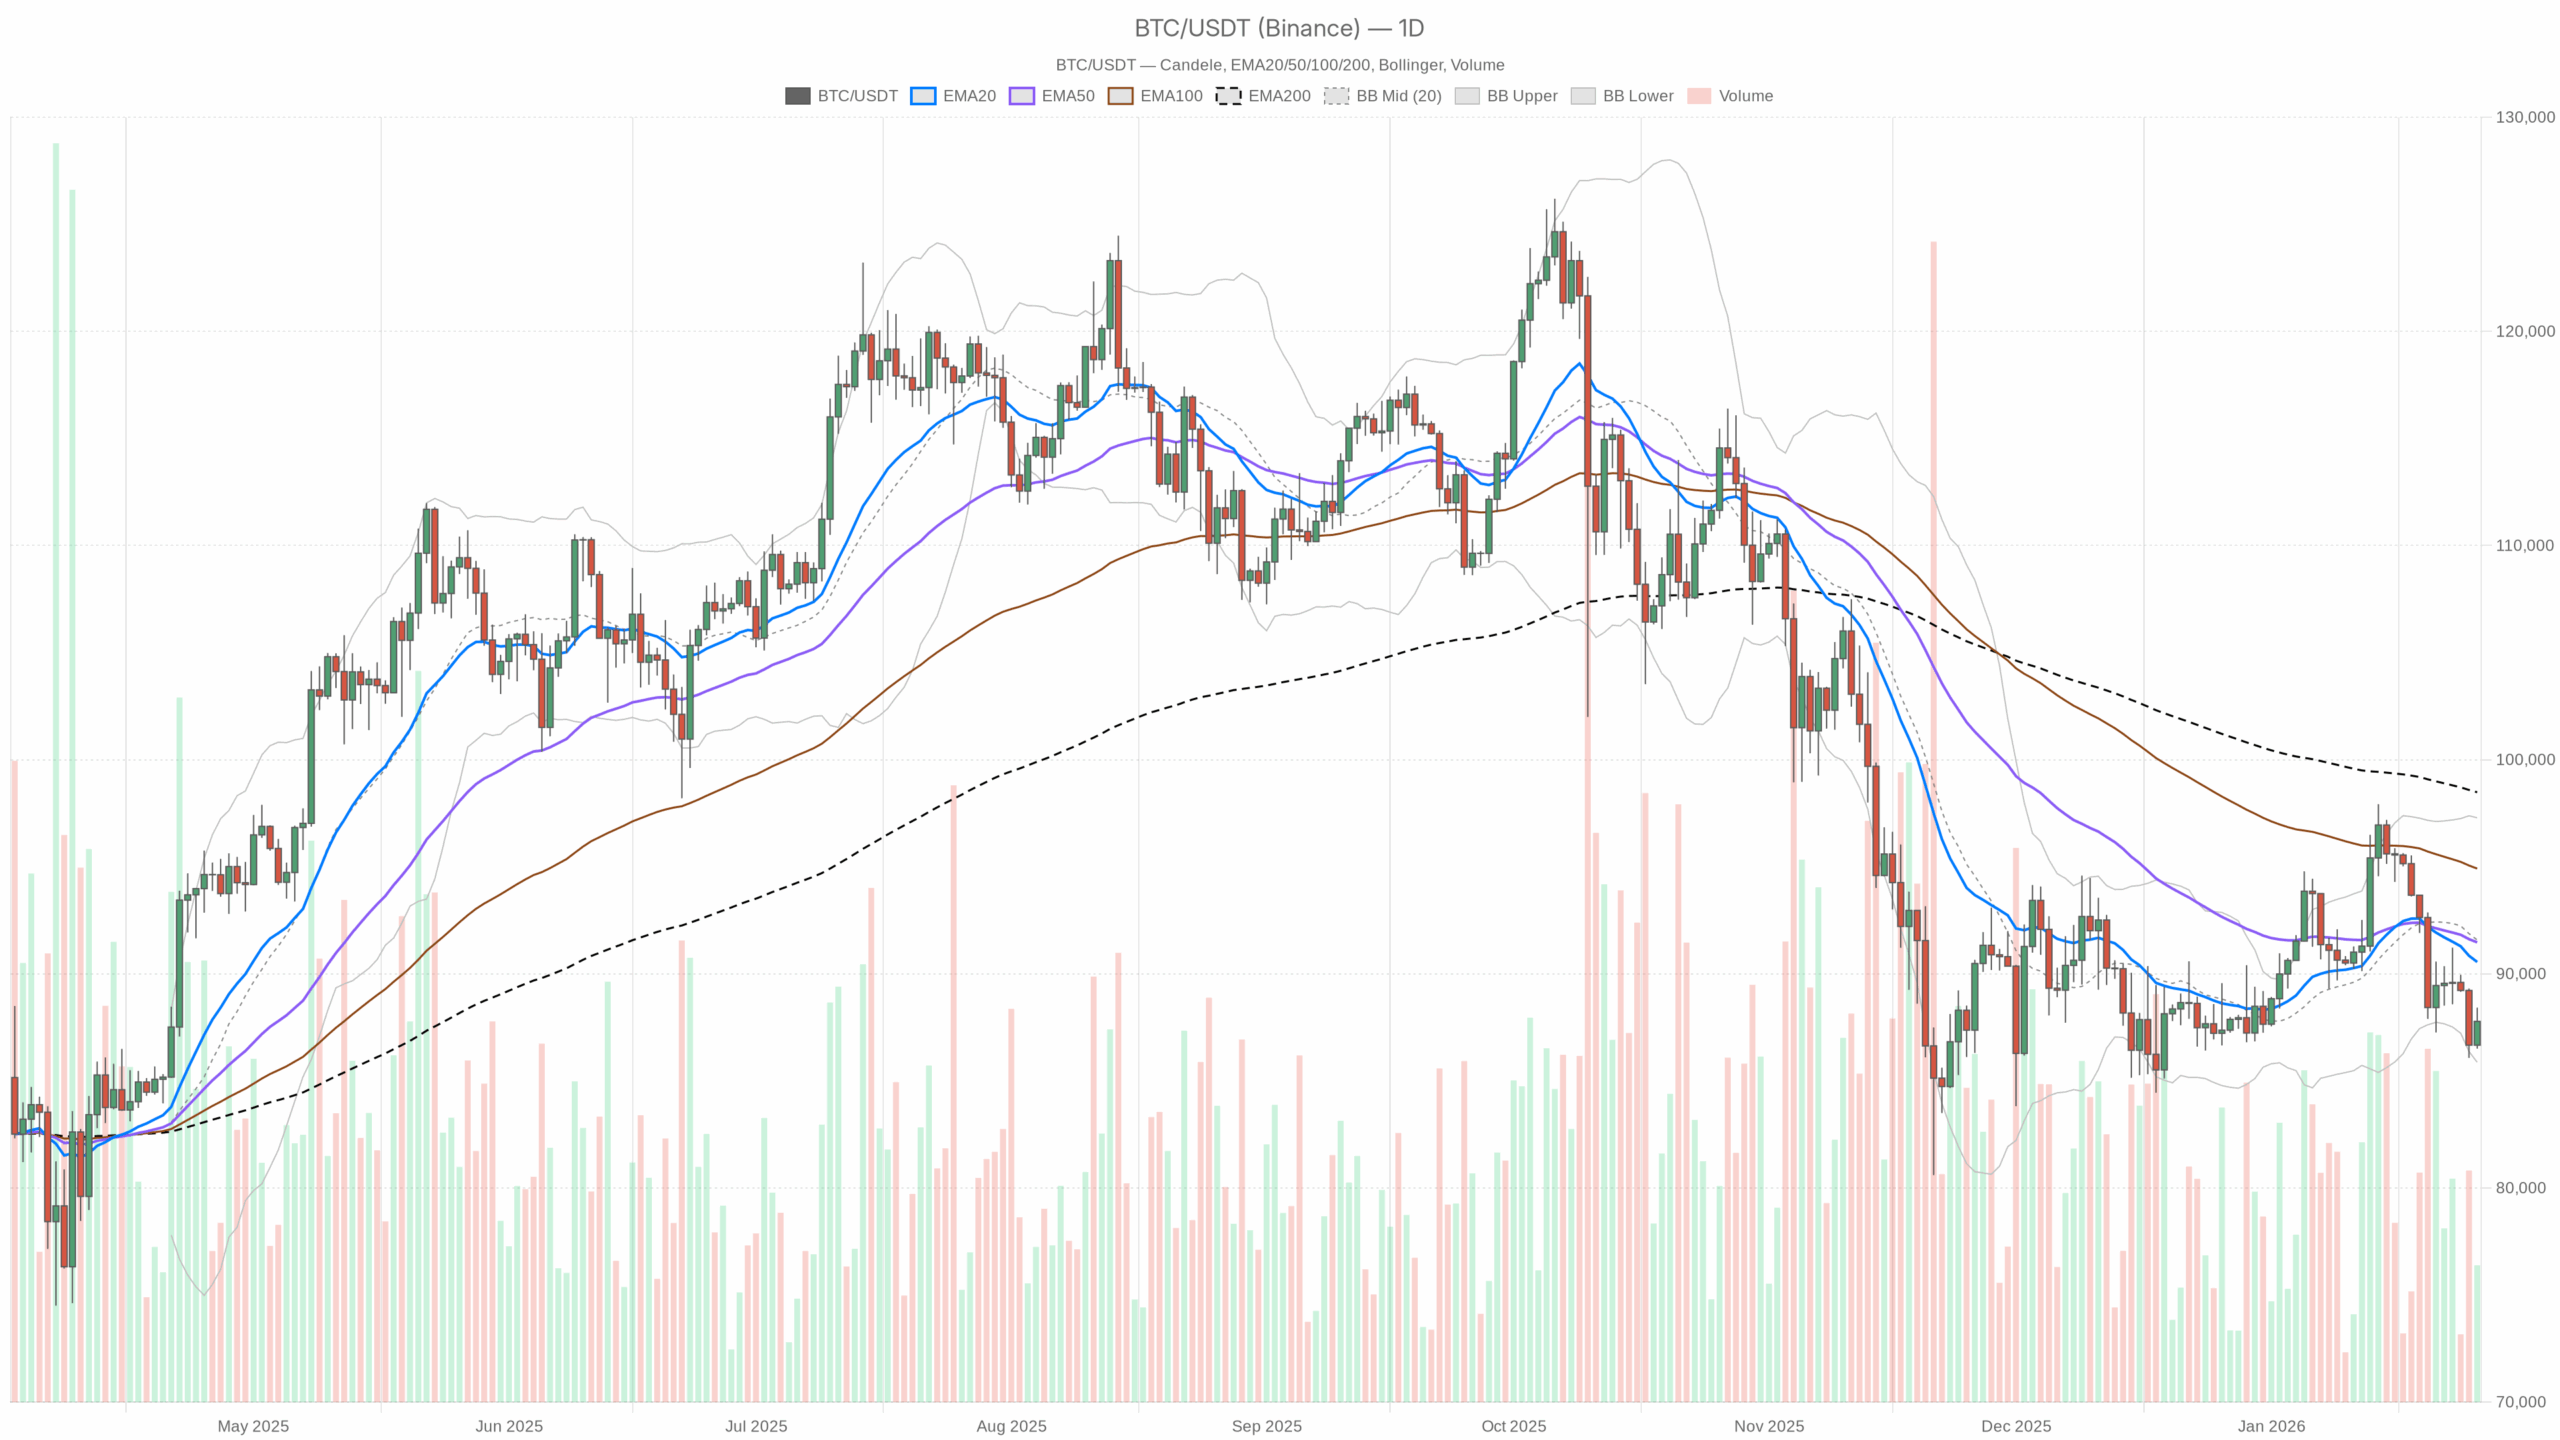
Market conditions are tense as the Bitcoin crypto price grinds lower, with BTCUSDT sitting below major resistance while sentiment plunges into Extreme Fear territory.
Summary
Daily chart (D1): Primary bias is bearish
The main scenario here is bearish based on the daily timeframe.
Trend structure – EMAs
• Daily close: $87,780.61
• EMA 20: $90,554.20
• EMA 50: $91,471.55
• EMA 200: $98,481.39
Price is trading below all three EMAs, with a clear downside stack (price < EMA20 < EMA50 < EMA200) and the system regime explicitly flagged as bearish. That is textbook downtrend behavior. Moreover, rallies into the 20–50 EMA band near $90.5k–$91.5k are, by default, sell zones unless proven otherwise. Bulls are currently playing defense, not offense.
Momentum – RSI (14)
• Daily RSI 14: 40.22
RSI is below 50 but not yet oversold. That is typical for a controlled downtrend, not a panic flush. There is still room for BTC to drop further before genuine oversold conditions kick in. In other words, the market is weak, but it has not capitulated. Sellers still have gas in the tank if something triggers a risk-off shove.
Momentum – MACD
• MACD line: -671.47
• Signal line: 91.82
• Histogram: -763.29
The MACD line is deeply negative and well below the signal, with a large negative histogram. That reflects strong, entrenched downside momentum on the daily. There is no sign yet of a proper bullish crossover or even a convincing slowdown in the downside impulse. Any bounce from here would still be trading against a heavy higher-timeframe trend.
Volatility and range – Bollinger Bands & ATR
• BB mid (20-period basis): $91,580.60
• BB upper: $97,290.12
• BB lower: $85,871.08
• ATR(14): $2,534.37
Price is sitting in the lower half of the band, not hugging the extreme but clearly below the midline. That aligns with a steady grind lower rather than a volatility blow-off. With daily ATR around $2.5k, the market is still moving, but this is moderate volatility by Bitcoin standards. There is enough room for meaningful intraday swings, but not a disorderly crash regime.
The lower band near $85.9k is your immediate downside reference. A clean daily close below that band would signal a transition from controlled selling into a more aggressive leg down. Conversely, reclaiming the mid-band around $91.6k would be the first technical sign that bears are losing grip.
Short-term levels – Daily pivots
• Pivot (PP): $87,571.56
• R1: $88,633.50
• S1: $86,718.68
Spot is hovering basically on top of the daily pivot. That is classic indecision right on fair value for the session. R1 around $88.6k is the first hurdle for any intraday bounce. Meanwhile, S1 at $86.7k is the first line of defense for bulls. Repeated failure at R1 would reinforce the bearish daily bias, while repeated tests of S1 raise the odds of a break lower.
Hourly chart (H1): Neutral pause inside a broader downtrend
On the 1-hour, the system flags a neutral regime, which is exactly what you would expect after a strong daily selloff trying to stabilize.
Trend structure – EMAs
• H1 close: $87,814.53
• EMA 20: $87,760.64
• EMA 50: $88,295.81
• EMA 200: $90,336.41
Price is aligned with the 20 EMA and slightly below the 50 and 200. That is a short-term balance zone; the market is catching its breath. The 50 EMA at about $88.3k and 200 EMA at roughly $90.3k are the key intraday supply layers. Bulls need to chew through those to turn this into a sustained rebound. Otherwise, every test of those levels risks becoming another lower high.
Momentum – RSI (14)
• H1 RSI 14: 48.68
Hourly RSI is essentially neutral. Momentum on this timeframe is neither stretched nor directional, which matches the idea of a consolidation after prior selling. There is no strong edge here for either side based solely on H1 RSI.
Momentum – MACD
• MACD line: -170.03
• Signal line: -324.13
• Histogram: +154.10
The MACD line is still below zero, but it has crossed above the signal with a positive histogram. That is a mild bullish inflection within a broader negative regime, consistent with a relief bounce or base-building attempt, not a confirmed trend reversal. It shows that intraday selling pressure has cooled, but the higher-timeframe bears are still in control.
Volatility and range – Bollinger Bands & ATR
• BB mid: $87,507.31
• BB upper: $88,813.24
• BB lower: $86,201.38
• ATR(14): $542.66
Price is trading close to the mid-band with an hourly ATR around $540. That signals a contained consolidation: there is intraday two-way trade, but no breakout. The upper band near $88.8k and lower band around $86.2k outline the immediate short-term battle zone. A push to the upper band would fit a short-term squeeze, while a drop back toward the lower band would mean bears are stepping back in.
Intraday reference – Hourly pivots
• Pivot (PP): $87,850.59
• R1: $87,963.94
• S1: $87,701.17
BTC is trading almost exactly on the H1 pivot, reinforcing the idea of a market in wait-and-see mode. As long as price chops around this pivot, you are in noise territory. A sustained hold above R1 would confirm intraday buyers have the upper hand, while consistent trading below S1 would swing the bias back to sellers.
15-minute chart (M15): Micro structure for execution
The 15-minute data is about execution context, not the bigger picture.
Trend structure – EMAs
• M15 close: $87,814.29
• EMA 20: $87,847.36
• EMA 50: $87,680.34
• EMA 200: $88,300.06
On M15, price is sandwiched between the short EMAs and below the 200 EMA. That is a very local chop zone inside a larger downtrend. Short-term, the market is balancing. Structurally, it is still below a key intraday trend gauge, the 200 EMA near $88.3k.
Momentum – RSI (14)
• M15 RSI 14: 51.08
RSI is basically flat around 50, which confirms micro-level neutrality. This is not a momentum edge environment. Execution here is more about levels and liquidity than momentum extremes.
Momentum – MACD
• MACD line: 139.79
• Signal line: 163.26
• Histogram: -23.47
MACD is slightly positive but sitting under its signal line with a tiny negative histogram. That is hesitant, fading upside momentum, compatible with a minor pause or topping attempt intra-bar rather than a strong thrust either way.
Volatility and range – Bollinger Bands & ATR
• BB mid: $87,893.48
• BB upper: $88,132.20
• BB lower: $87,654.77
• ATR(14): $234.11
M15 bands are tight, and ATR is just over $230. That is compressed short-term volatility, often a prelude to a small expansion move. For scalpers, that matters; for the higher-timeframe view, it just confirms a local equilibrium zone.
Very short-term pivots
• Pivot (PP): $87,850.51
• R1: $87,963.78
• S1: $87,701.01
Price is oscillating around the M15 pivot almost tick-for-tick. That is what you typically see when the market is waiting for new information or larger players to step in.
Market context: Fear is high, but BTC still dominates
The broader crypto data paints a consistent picture.
• BTC dominance at about 57.5% tells you Bitcoin remains the market’s base asset and is outperforming the average alt even in weakness.
• Total crypto market cap is around $3.05T, down about 0.8% in 24h, while 24h volume is up over 120%. That combination, a small net price drop with a big jump in volume, usually reflects aggressive repositioning and heightened two-way trade rather than a calm drift.
• The Fear & Greed Index at 20 (Extreme Fear) says sentiment is washed out. Historically, extreme fear often appears closer to late in down-moves, but it does not guarantee an immediate bottom. It does mean that marginal selling pressure could be from forced or emotional flows, which is where sharp reversals can eventually arise.
Overlay this with DeFi fee spikes, with Uniswap V3 and other DEXs showing large 1-day fee jumps, and you are looking at a market that is actively trading volatility, not quietly trending. That environment can cut both ways for Bitcoin. Strong reflex rallies and ugly downside follow-through are both on the table.
Bullish scenario for Bitcoin
For a credible bullish case from here, BTC needs to turn this intraday stalling into something more structural. The primary element is whether the Bitcoin crypto price can defend key supports and reclaim moving averages.
1. Hold above $86.7k–$87k
This zone, daily S1 and just above the lower daily Bollinger Band, is the first must-hold area. As long as BTC defends this pocket on daily closes, the market can frame the current move as a controlled pullback rather than an accelerating breakdown.
2. Reclaim the short EMAs on D1
Bulls need to push price back above the $90.5k–$91.5k band, daily EMA20 and EMA50, and hold there. That would signal the down-swing is losing dominance and the market is willing to pay up for Bitcoin again. It would not instantly flip the whole structure to bullish, but it would turn the daily picture from “sell the rip” to “two-way” at minimum.
3. MACD and RSI follow-through
On the daily, you would want to see RSI crawl back toward and above 50 and the MACD histogram start contracting, less negative, as price recovers. That would confirm that momentum is genuinely turning, not just short-squeezing.
Upside targets in a bullish scenario would be:
• First, the BB mid and EMA cluster around $91.5k–$92k.
• Next, the $97k–$98.5k zone, where the upper Bollinger Band and the 200-day EMA roughly reside. That is the bigger resistance band where medium-term sellers are likely waiting.
This bullish scenario is invalidated if BTC loses the $85.9k–$86.7k area on a daily closing basis and starts walking the lower Bollinger Band downward. That would signal that the pullback is not done and that bears are still firmly in charge.
Bearish scenario for Bitcoin
The bears currently have the higher-timeframe edge. The key for them is to prevent any sustained reclaim of the daily EMA cluster.
1. Fail lower at $88.5k–$91.5k
If rallies toward H1 resistance, $88.5k–$88.8k, and the daily EMA20 and EMA50 band, around $90.5k–$91.5k, keep getting sold, that confirms the market is in sell-the-bounce mode. The current H1 and M15 neutrality would then just be a consolidation before another leg down.
2. Break below the lower daily band
A decisive move and close under the lower Bollinger Band near $85.9k, especially accompanied by a pickup in ATR and a still-negative MACD histogram, would open the door for a trend-acceleration phase. With daily RSI not yet oversold, there is room for that kind of move.
3. Sentiment capitulation without reversal
With the Fear & Greed index already in Extreme Fear, a further drop that fails to quickly bounce would imply genuine capitulation, not just a quick stop run. In that environment, levels can overshoot and liquidity can thin, amplifying moves.
Downside zones in a bearish extension from here:
• Immediate: the $85k–$86k pocket just below the current lower band.
• Beyond that, the next logical targets would be prior structural supports from earlier swings, not in this dataset, but given current ATR, a $5k–$7k extension over a few sessions would not be extreme.
This bearish scenario is weakened if BTC can reclaim and hold above the $90.5k–$91.5k area on daily closes, with daily MACD momentum flattening and RSI heading back above 50. At that point, you would no longer be dealing with a clean downtrend. You would be trading a range or the early stages of a trend reversal.
Where the timeframes disagree – and what it means
There is a clear tension in the chart stack.
• Daily: firmly bearish, with price below all major EMAs, weak RSI, and negative MACD.
• Hourly: neutral with a mild bullish MACD cross, a pause and potential early bounce inside that downtrend.
• 15-minute: neutral to slightly tired on the upside, micro chop.
This mismatch is important for traders.
• If you are trading the trend, the daily still says the path of least resistance is down. Rallies toward the EMA cluster and upper intraday bands are suspect until proven otherwise.
• If you are trading mean reversion, the combination of Extreme Fear, strong daily selloff, and intraday stabilization offers a window for short-term counter-trend longs. However, the burden of proof is on the bulls to reclaim levels, not just bounce a few hundred dollars.
Positioning, risk, and uncertainty
BTCUSDT is at a point where the long-term trend and short-term structure are at odds. The higher timeframe still leans bearish, but the market is no longer in straight-line liquidation. Instead, it is probing for where real demand comes in.
Two practical implications stand out.
• Volatility is active, not explosive. Daily ATR around $2.5k and hourly ATR around $540 mean ranges are wide enough to matter for sizing and stops, but this is not a blow-off environment yet. A break of the lower daily band with rising ATR would change that.
• Conviction should match timeframe. Trend traders will treat bounces into $88.5k–$91.5k as potential entries or add-zones on the short side unless daily structure meaningfully improves. Short-term traders can work the intraday ranges, but they are trading against a bearish macro backdrop and need to be ruthless with risk management.
Regardless of bias, this is not a spot to ignore risk. Sentiment is fragile, liquidity is moving, and extreme fear can evolve into either a sharp rebound or a deeper flush. Position size, leverage, and clear invalidation levels matter more here than trying to be right at the exact turning point.
This section contains a sponsored affiliate link. We may earn a commission at no additional cost to you.
This article is a market commentary and expresses a technical view on the Bitcoin crypto price based on the data provided. It is not investment advice or a recommendation to buy or sell any asset. Cryptoassets are highly volatile and can result in total loss of capital. Always conduct your own research and consider your risk tolerance before making any trading decisions.


