


 15
15
There are no reversal signals on the last day of the week, according to CoinStats.
BTC/USD
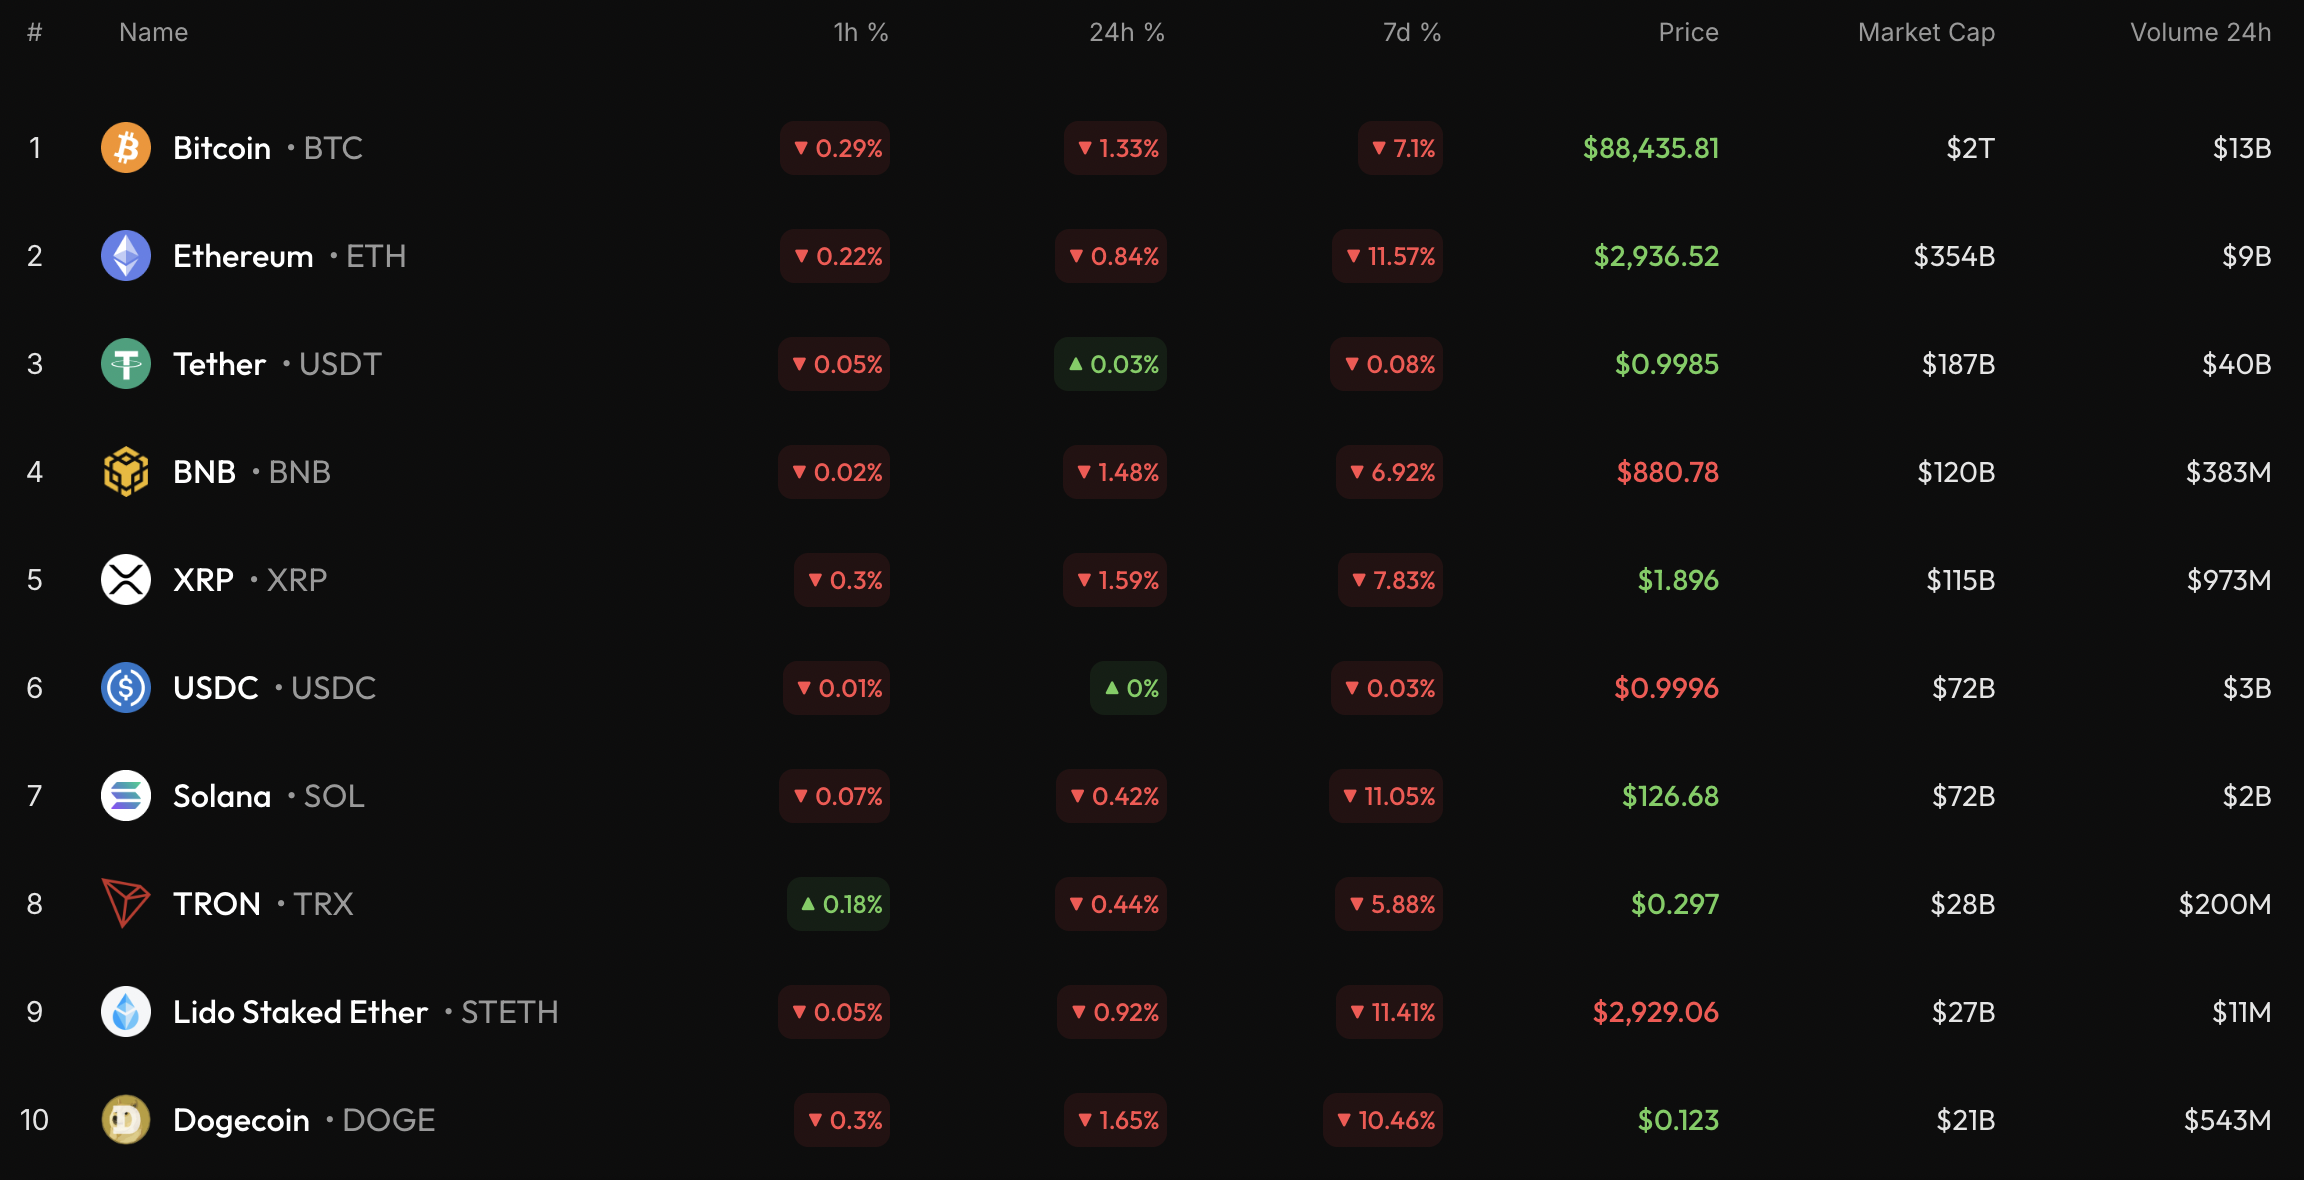
The rate of Bitcoin (BTC) has declined by 1.33% since yesterday. Over the last week, the price has fallen by 7.1%.
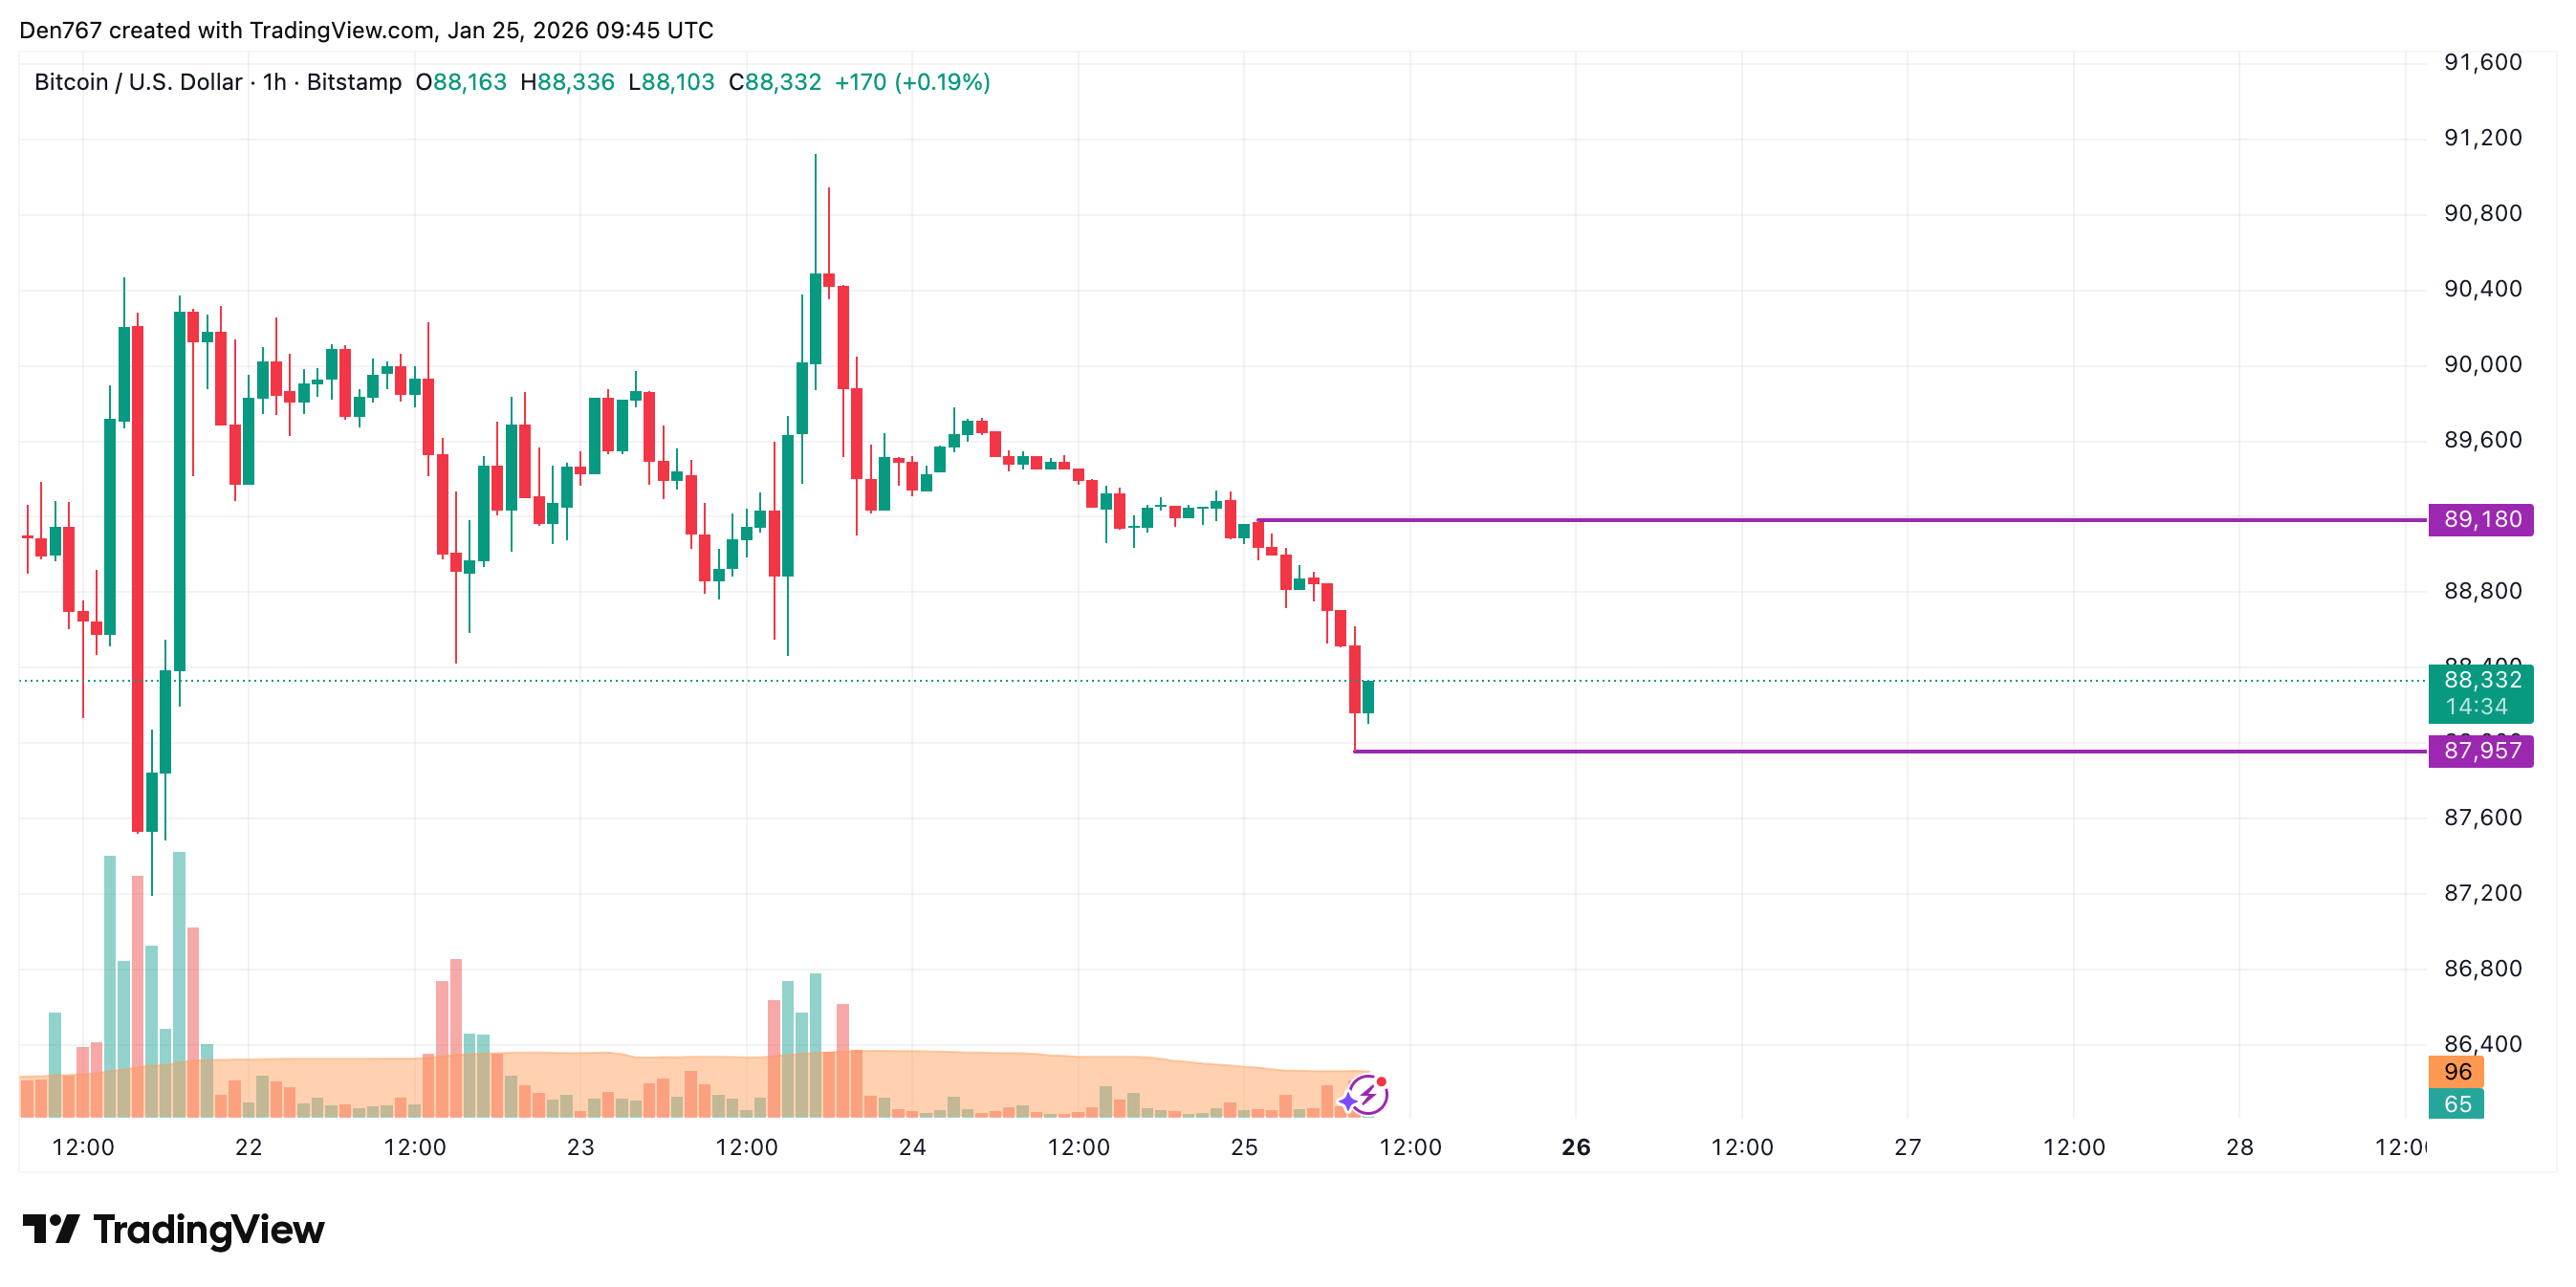
On the hourly chart, the price of BTC is going up after setting a local support at $87,957. As most of the daily ATR has been passed, there are low chances to see sharp moves by tomorrow.
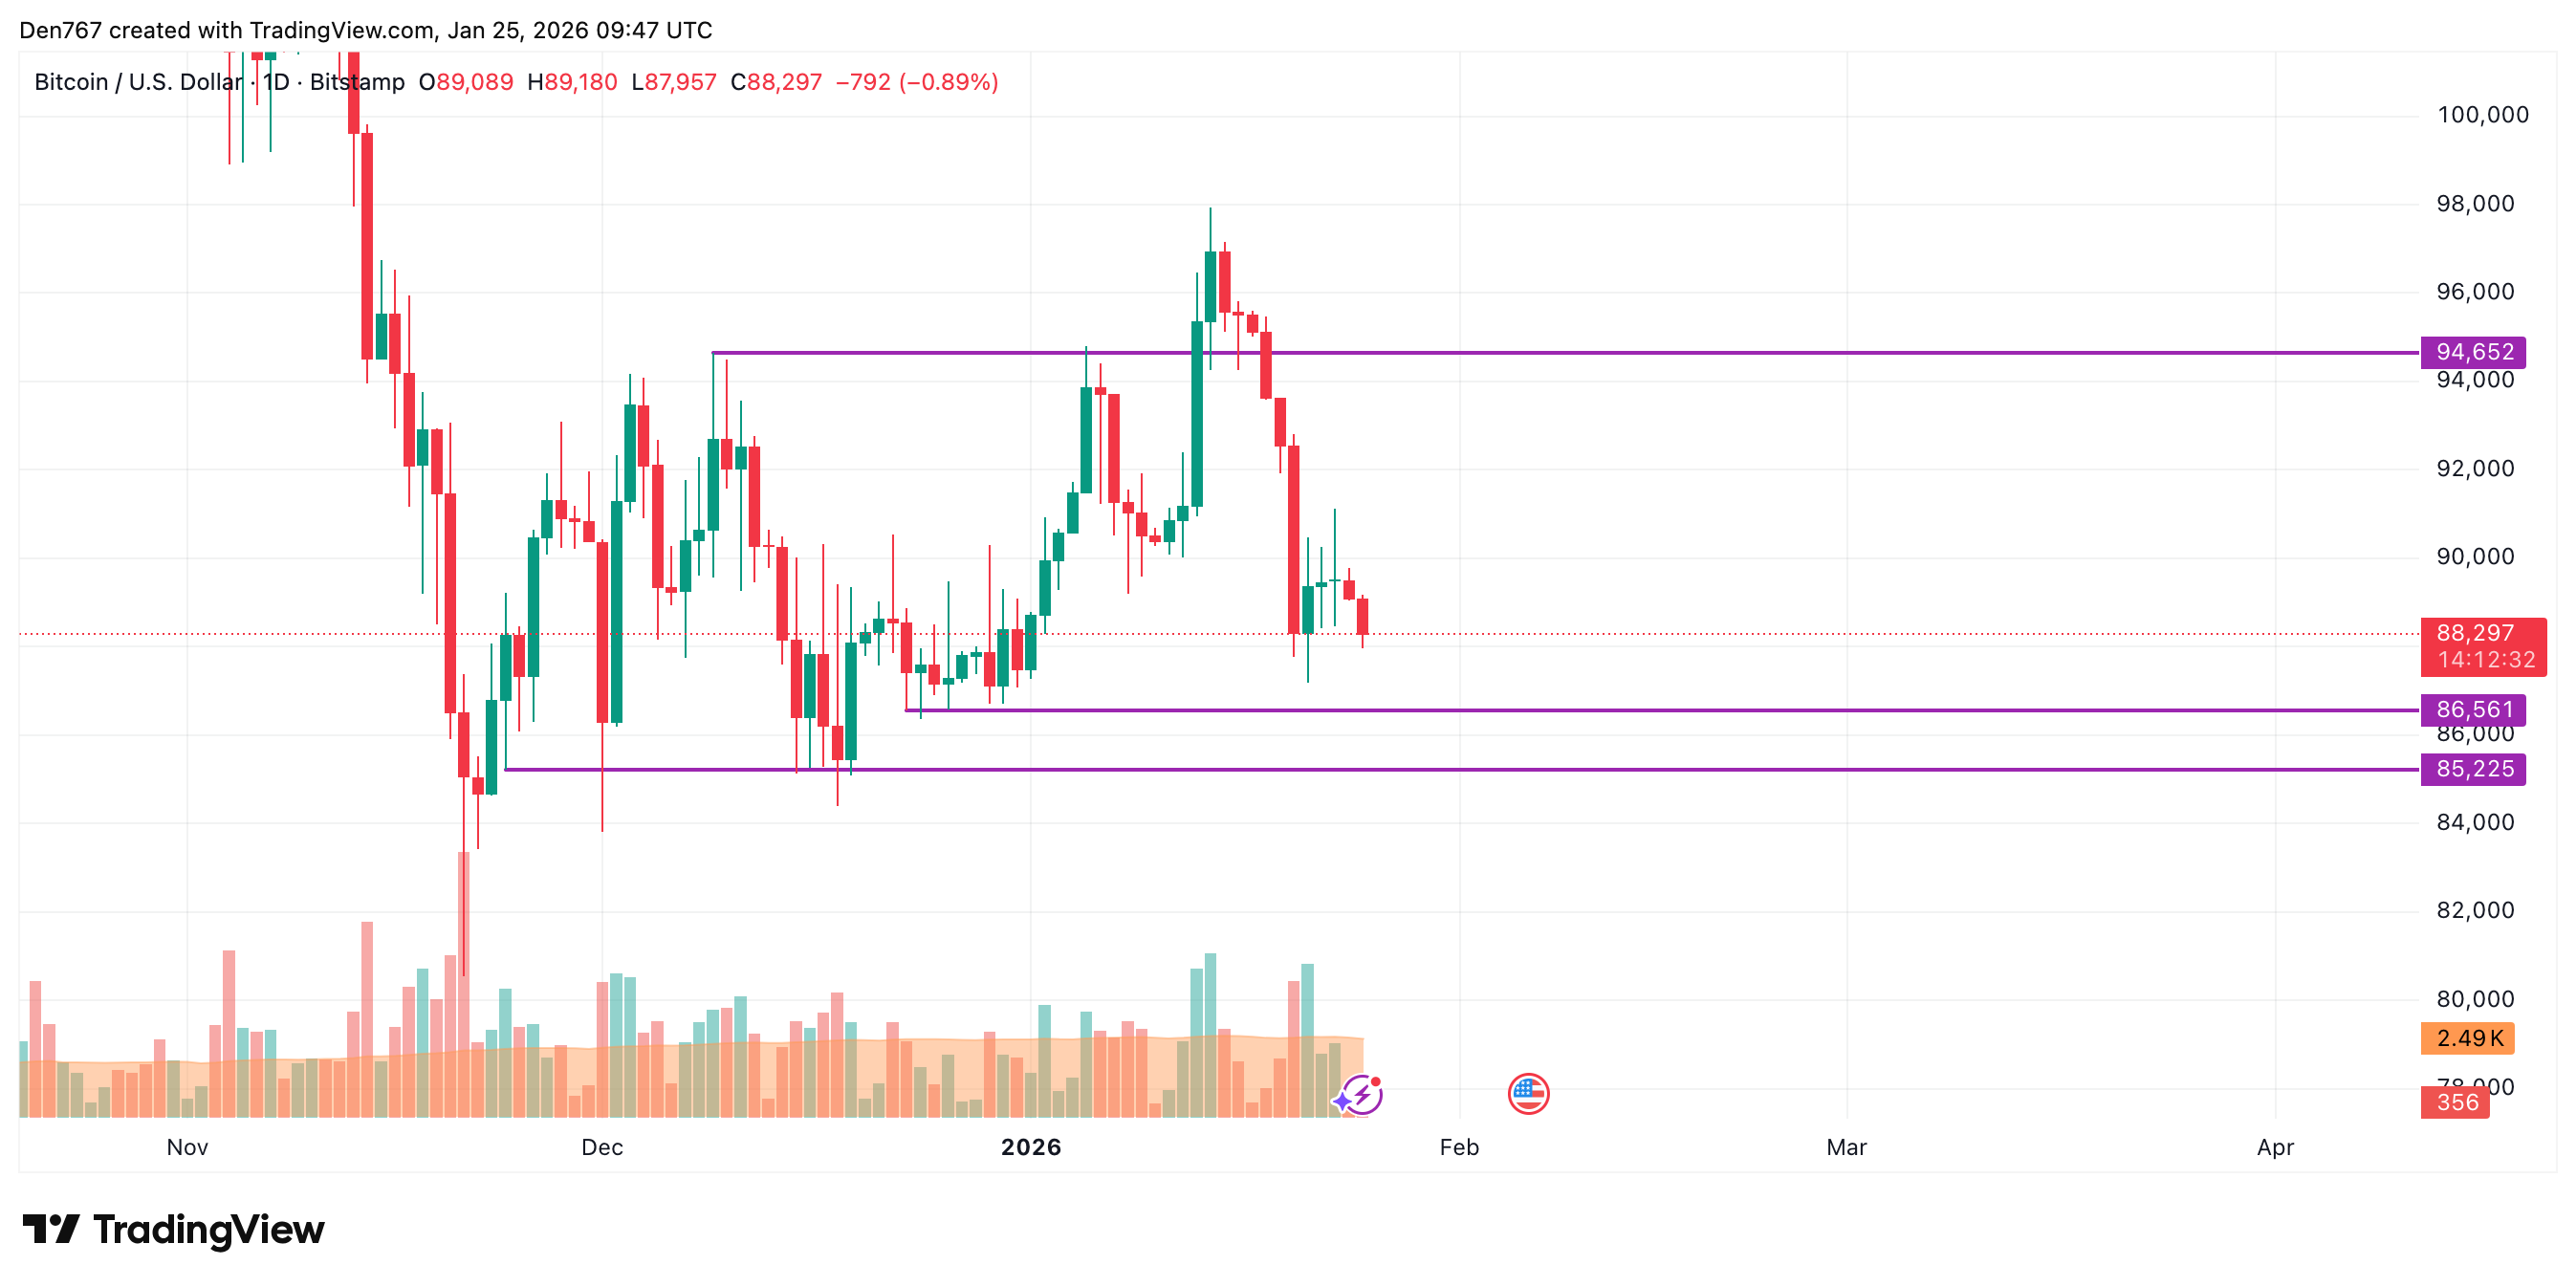
On the bigger time frame, bears are controlling the situation on the market. If the candle closes around the current prices, traders may see a test of the interim level at $86,561 in the upcoming week.
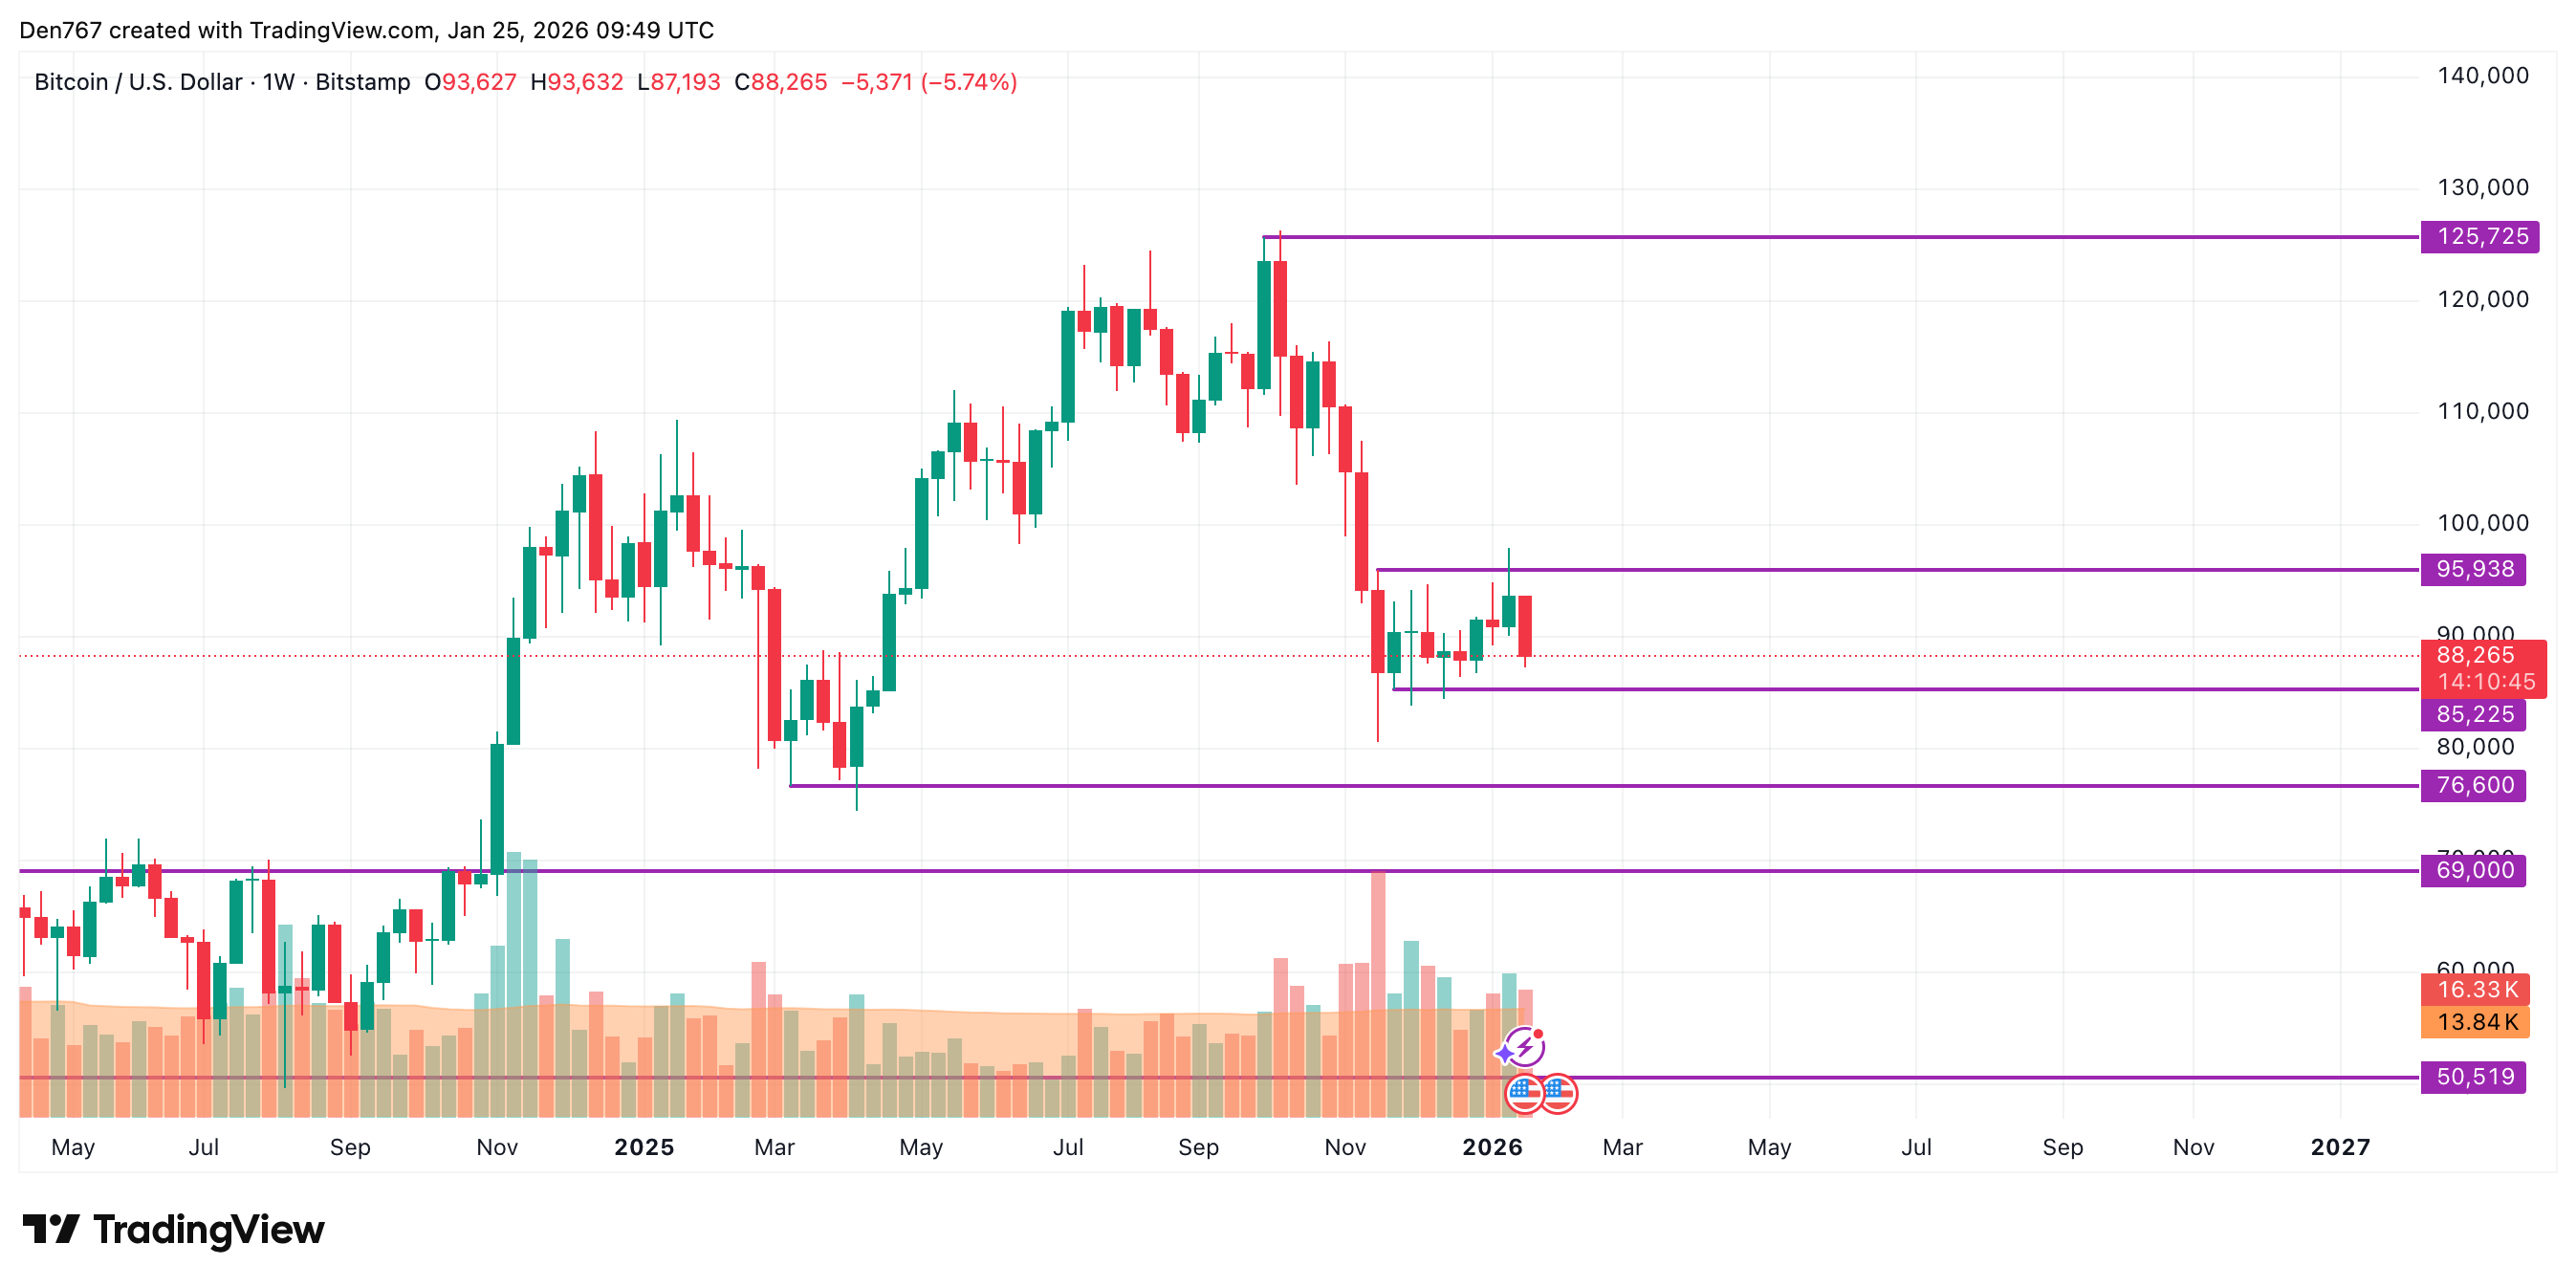
From the midterm point of view, the rate of the main crypto is going down after a false breakout of the resistance at $95,938.
If the decline continues to the support, the accumulated energy might be enough for a dump to the $80,000 area.
Bitcoin is trading at $88,265 at press time.

