


 8
8
Bitcoin strutted into Dec. 26, 2025, wearing a shiny $88,630 price tag and a not-so-subtle smirk, but behind that swagger is a market that’s walking on eggshells. With a market cap brushing against $1.76 trillion and trading volume floating at $38.17 billion, the real story lies in the tense tango between consolidation and breakout tension—wrapped in a price band barely wider than a hopscotch square.
Bitcoin Chart Outlook
The daily chart tells the tale of a gladiator recovering from a hit—range-bound between support at $86,000 and resistance around $89,500 to $91,000, bitcoin has been dancing sideways since a drop from highs near $94,652. The recent price action has been less of a sprint and more of a shuffle, with the bears still lurking.
While volume is quietly picking up, it’s most noticeable during red candles—an uninviting sign that supply zones are still in control. The bias here is clear: without a close above $89,500 with conviction ( volume), the bulls are just doing warm-up stretches in the locker room.

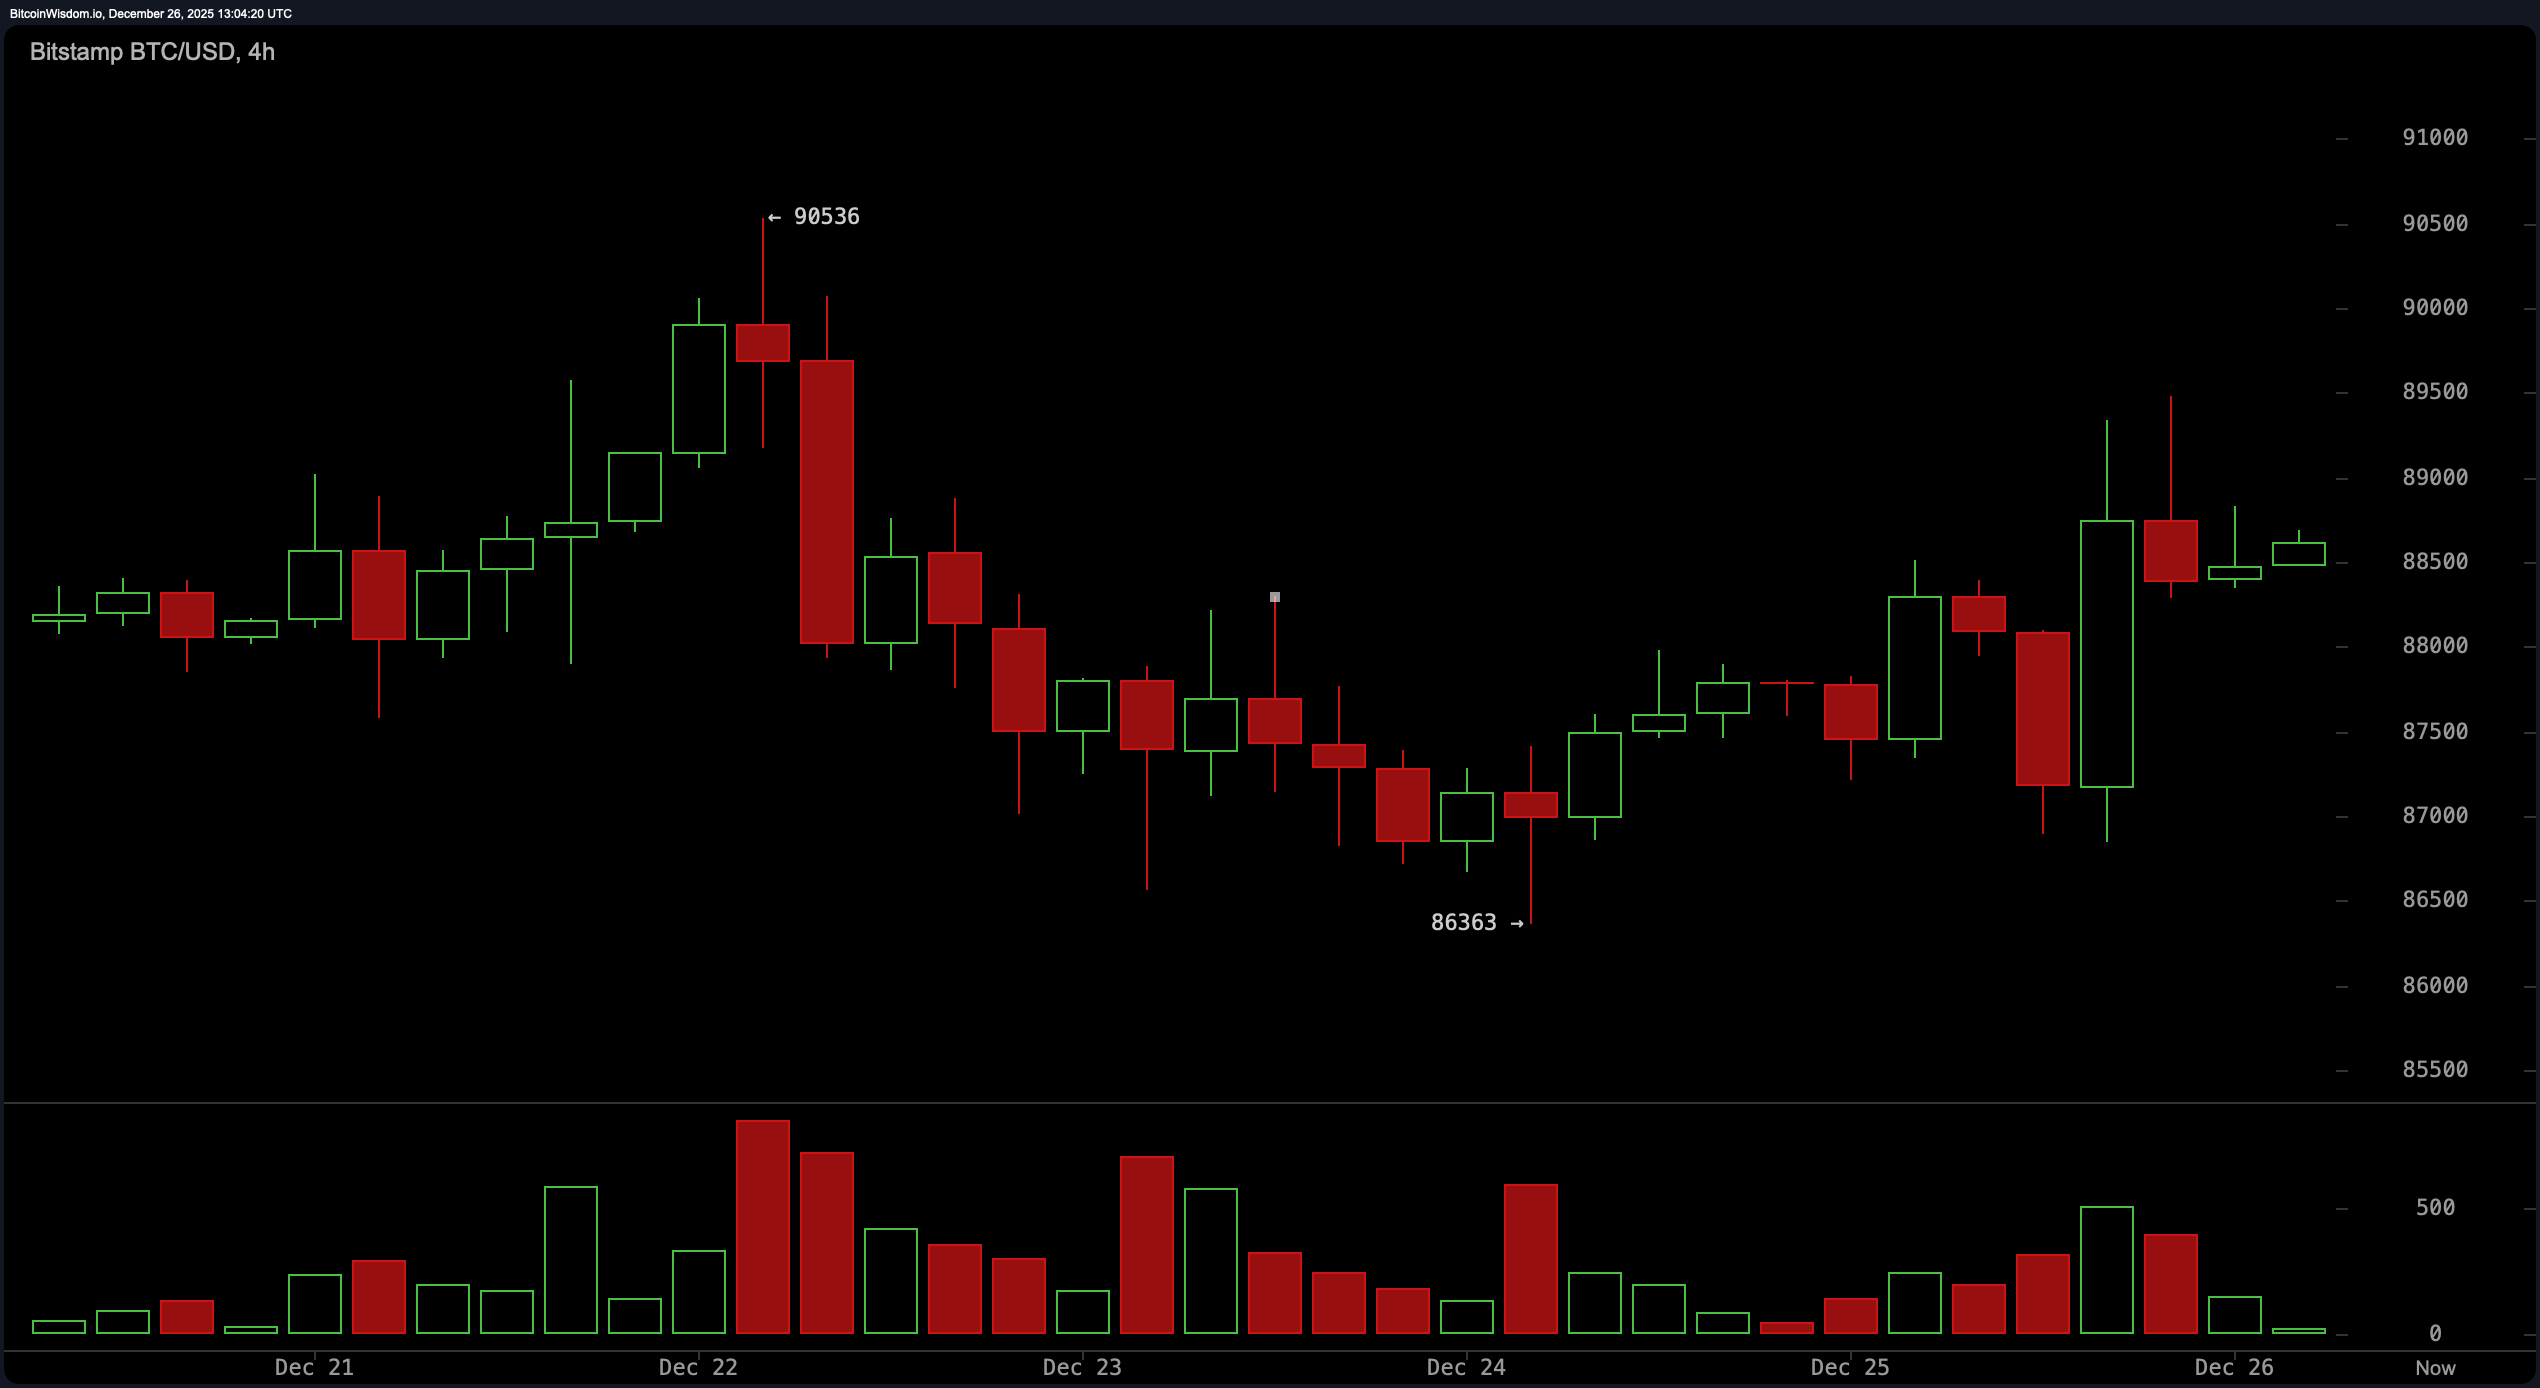
Zooming into the 4-hour chart, there’s a visible recovery attempting to crawl its way out of a sharp drop from $90,536 to $86,363. The bounce looks promising but lacks the decisive energy that usually sparks sustained upswings. The volume discrepancy—heavy during the fall, meek during the rise—makes this feel more like a hesitant toe-dip than a cannonball into the bullish pool. Short-term optimism is budding, especially if bitcoin can hold above the $88,800 to $89,000 resistance zone. But let’s not pop the champagne until momentum proves it’s got more than just a temporary caffeine boost.
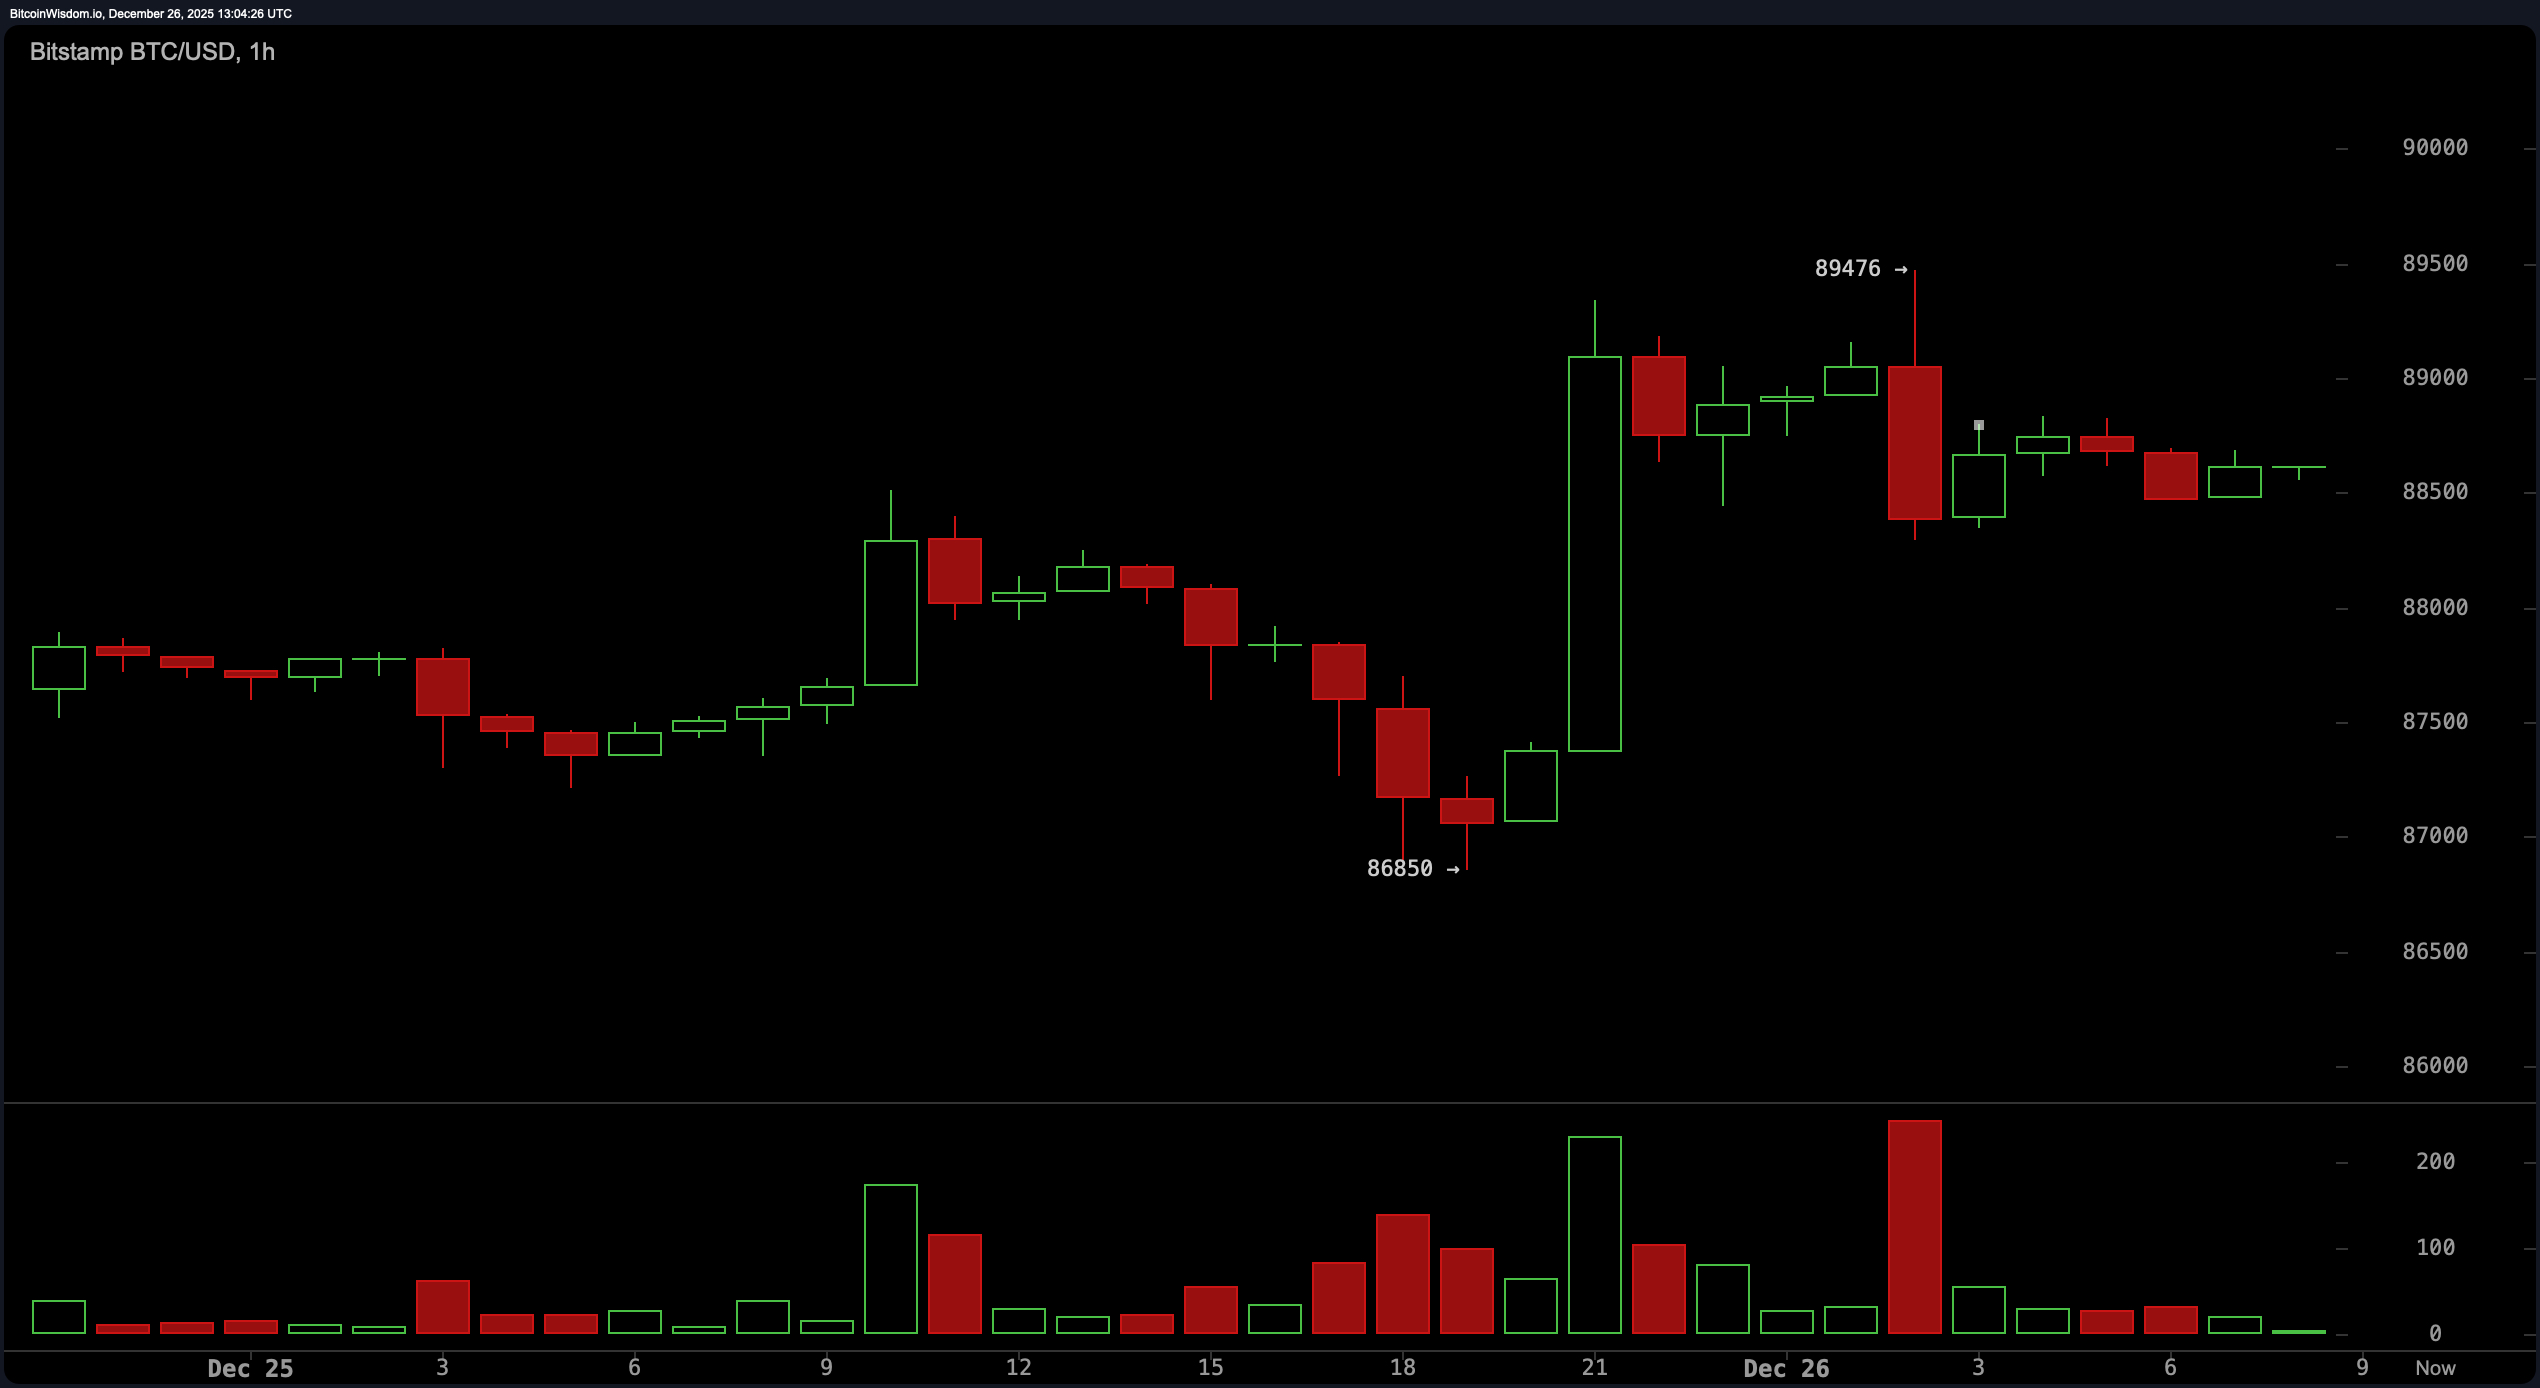
The 1-hour chart, however, is where the short-term crowd is cheering. After a bounce from $86,850 to $89,476, bitcoin pulled back, only to show signs of a bullish engulfing candle that whispers, “I’m not done yet.” Currently consolidating just below the psychological $89,000, it’s tempting to think a pop is imminent—but without volume, that’s just hopium in disguise. Micro support is parked at $88,500, while $89,500 stands tall as the barrier to beat. A move above this could open a quick path toward $90,500, but any stutter might send the price sliding faster than a greased sled.
Oscillators aren’t exactly singing in harmony. The relative strength index ( RSI) is at a cool 47, the Stochastic oscillator holds at 45, and the commodity channel index (CCI) lingers at -27—all indicating a market that’s shrugging its shoulders. The average directional index (ADX) at 21 is practically yawning, suggesting no dominant trend. The Awesome oscillator is currently at -1,291, not looking so awesome, while momentum posts 758—still leaning bearish. Meanwhile, the moving average convergence divergence ( MACD) level of -1,209 surprisingly nods to possible upside. It’s a split jury, with no unanimous vote on direction.
Moving averages (MAs), meanwhile, might as well be holding a sign that says, “We’ve seen better days.” While the 10-period exponential (EMA) and simple moving averages (SMA) cling to short-term optimism at $88,028 and $87,607, respectively, the longer-term crew is mostly headed south. From the 20-period all the way to the 200-period indicators—both exponential and simple—it’s a sea of red flags, with values climbing all the way up to $107,501. The trend? Not your friend—unless you’re rooting for resistance.
In summary, bitcoin is in a chess match with its own momentum following yesterday’s Christmas tape. While the short-term crowd may see glimmers of strength, the broader landscape suggests a market still chewing over its next move. For now, all eyes remain on that elusive $89,500 level—the glass ceiling separating hesitation from conviction.
Bull Verdict:
If bitcoin decisively breaks above $89,500 with strong volume, short-term momentum could accelerate toward the $94,000 zone. The 1-hour chart’s bullish behavior, combined with supportive short-term moving averages and a positive moving average convergence divergence ( MACD), suggests bulls may be sharpening their horns for another charge—if they can just wake up the volume.
Bear Verdict:
Failure to breach $89,500 with conviction—especially with weak volume on rebounds—leaves bitcoin vulnerable to another pullback toward $86,000 or lower. With most medium-to-long-term moving averages leaning downward and oscillators stuck in neutral or bearish zones, the broader trend remains weighted against any overenthusiastic rallies.
FAQ ❓
- What is bitcoin’s price today?Following yesterday’s Xmas day trading, bitcoin is trading at $88,630 as of Dec. 26, 2025.
- What is the key resistance level for bitcoin?The critical resistance sits at $89,500, with momentum building below it.
- Where is bitcoin’s support zone?Strong support holds between $86,000 and $86,500 across major timeframes.
- Is bitcoin trending up or down? Bitcoin is consolidating sideways with mixed technical signals across charts.


