


 6
6
Bitcoin faces downward pressure and must hold key support levels, with an analyst highlighting the true test for a momentum shift.
Bitcoin (BTC) is currently experiencing some downward pressure, trading at $86,729 after a 0.8% drop in the last 24 hours. Over the past 7 days, Bitcoin has decreased by 0.3%, and a more significant drop of 6.4% has been seen over the last 14 days.
This reflects the broader market weakness and concerns, including upcoming events such as initial U.S. jobless claims and market closures during Christmas, which may reduce liquidity and heighten volatility. If Bitcoin fails to hold the current levels, further declines may follow, especially as liquidity issues persist during the holiday period.
Will Bitcoin Fall Further?
Checking technical indicators, Bitcoin is currently testing a critical support level, as seen in the Fibonacci retracement chart. The price is hovering above the 0.236 Fibonacci level at $86,835, suggesting that this level is currently providing support. A breakdown below this level could push the price further down toward the next support at $84,440, aligning with the 0 Fibonacci level.
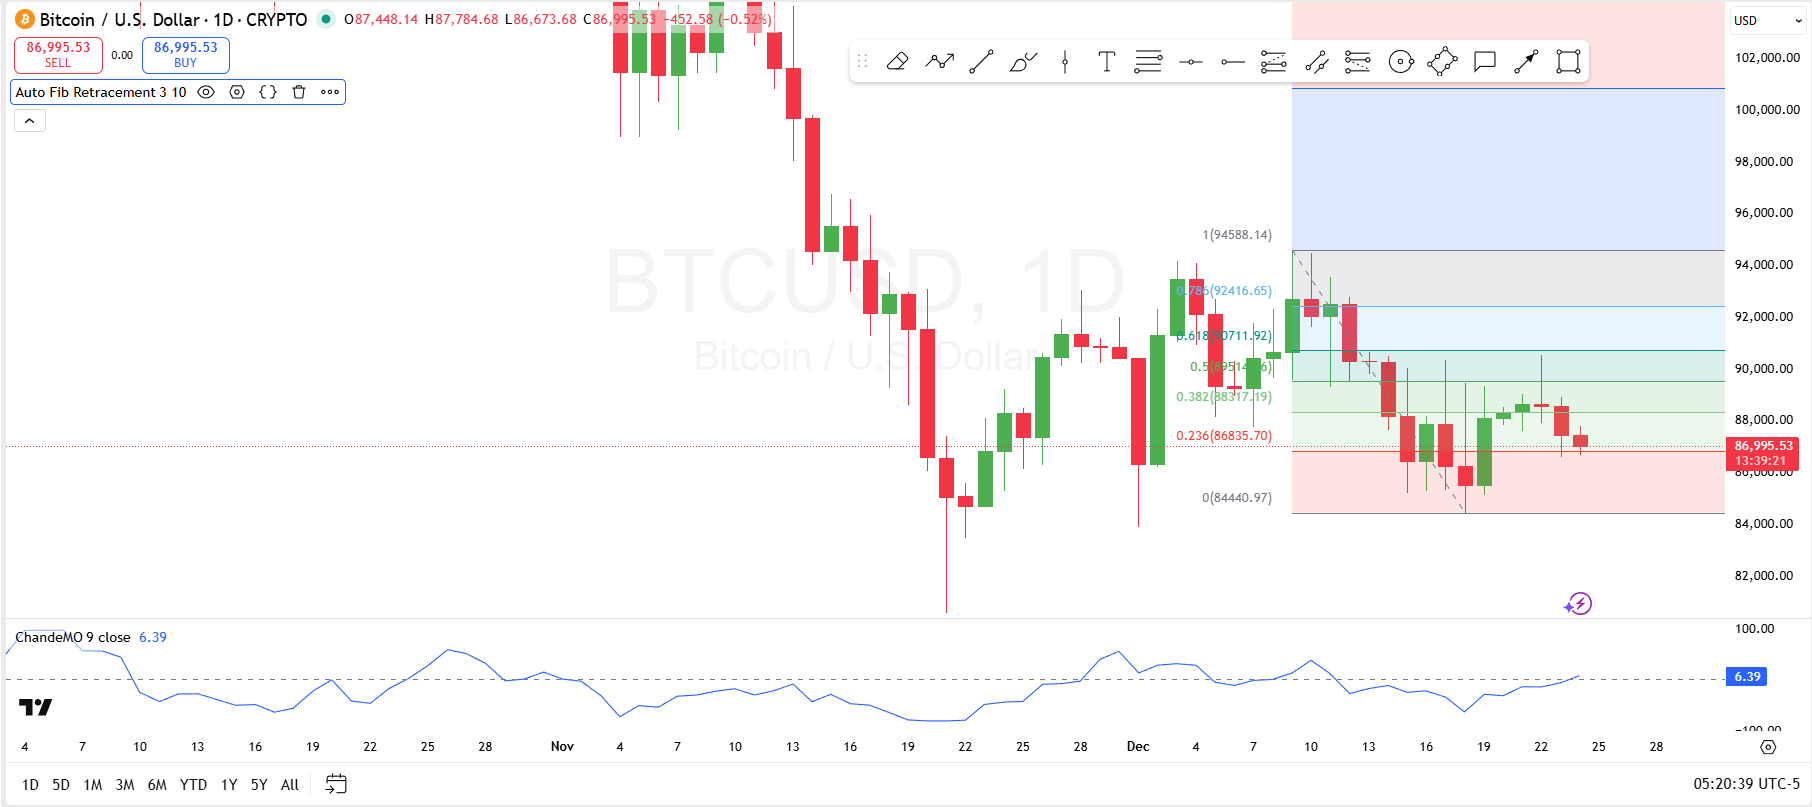
On the other hand, the immediate resistance rests at the 0.382 level around $88,317. If Bitcoin can break above this resistance, the price could aim for the 0.5 level at $89,415 or further up to $90,711 at the 0.618 Fibonacci level. This range offers a clear path for both bullish and bearish scenarios.
Further, the Chande Momentum Oscillator (ChandeMO) is currently at 6.39, suggesting a neutral to slightly positive momentum for Bitcoin in the short term. However, since it has surged above 0 from levels around -65, the market sentiment is likely recovering.
If Bitcoin can hold its current support levels and break above the immediate resistance, it might see a short-term recovery. Otherwise, continued downward movement could occur if Bitcoin closes below the 0.236 Fibonacci support.
Real Bitcoin Test is at $98.5k
Elsewhere, Titan of Crypto, an analyst on X, has observed Bitcoin trading within two key liquidity zones between $80,701 and $94,595. To shift the market’s momentum, he notes that the price must first reclaim the Kijun line (represented in blue on the chart), break the ongoing downtrend line, and successfully move above the Kumo cloud.

He further emphasizes that the true test for Bitcoin will come when the price attempts to break the $98.5k level. To reach $98.5K from the current price of $86,729, Bitcoin would need to surge by approximately 13.6%.
