

Elon Musk’s “energy is the true currency” comment reignited Bitcoin speculation, even as no new backing surfaced. At the same time, separate TradingView charts flagged a $90,000 resistance test and a key weekly support line that traders are watching.
Elon Musk Links Energy to Value as Bitcoin Speculation Resurfaces
Elon Musk said energy, not fiat money, functions as the real form of currency, a comment that renewed debate around Bitcoin but stopped short of any endorsement.
Musk made the remark during a public conversation, where he argued that energy underpins all economic activity and ultimately defines value. He described fiat systems as fragile in earlier remarks, framing his criticism around long term sustainability rather than near term policy. As a result, the quote spread quickly across X, where users linked it to Bitcoin’s energy based design.
Forbes reported that the comment fueled speculation among Bitcoin supporters who see the statement as aligned with Bitcoin’s proof of work model. However, the outlet noted that the discussion reflects interpretation, not confirmation of Musk backing Bitcoin or increasing exposure to it.
Musk has previously acknowledged that Bitcoin relies on energy consumption while distancing himself from day to day market narratives. He has not announced any new Bitcoin holdings or strategy changes. At present, the renewed speculation centers on commentary rather than disclosed action involving Bitcoin.
Wyckoff Accumulation Targets a $90K Break as BTC Holds Its Range
Meanwhile, Gert van Lagen mapped a Wyckoff accumulation setup on Bitcoin’s 1 hour chart and said a clean break above the ±$90,000 resistance area would mark a “sign of strength” and complete Phase D. The chart, created on TradingView on Dec. 21, 2025, shows BTC grinding sideways beneath a thick resistance band after a sharp selloff and recovery.

Bitcoin Wyckoff Accumulation 1 Hour Chart: Source: TradingView, Gert van Lagen (X)
The structure highlights classic Wyckoff waypoints. Price forms a selling climax near the mid $80,000s, then rebounds into an automatic rally, and later revisits the lows through a spring and test. After that, BTC prints multiple last points of support near the upper range, while candles keep closing back inside the band, which signals buyers defend dips but still face overhead supply.
Key levels sit clearly on the right side. The upper resistance line sits near $89,531, while a lower range line sits around $88,332, with nearby reference marks around $88,167. On the downside, the main support lines sit near $85,616 and $84,484, which define the lower boundary of the accumulation area.
The breakout condition stays simple in his read. BTC needs to push through the ±$90,000 zone and then hold above it, and volume needs to expand to confirm the move. Without a visible volume surge, the chart’s “SOS” call remains unvalidated, and price can slip back into the range before any Phase E continuation.
Bitcoin Holds Gaussian Channel Support as Weekly Structure Stays Intact
Man of Bitcoin said Bitcoin remains constructive as long as price stays above the lower boundary of the Gaussian channel on the weekly chart. The TradingView chart shows BTC trading near $88,400 while holding above the green band that has guided the broader uptrend since the 2023 recovery.
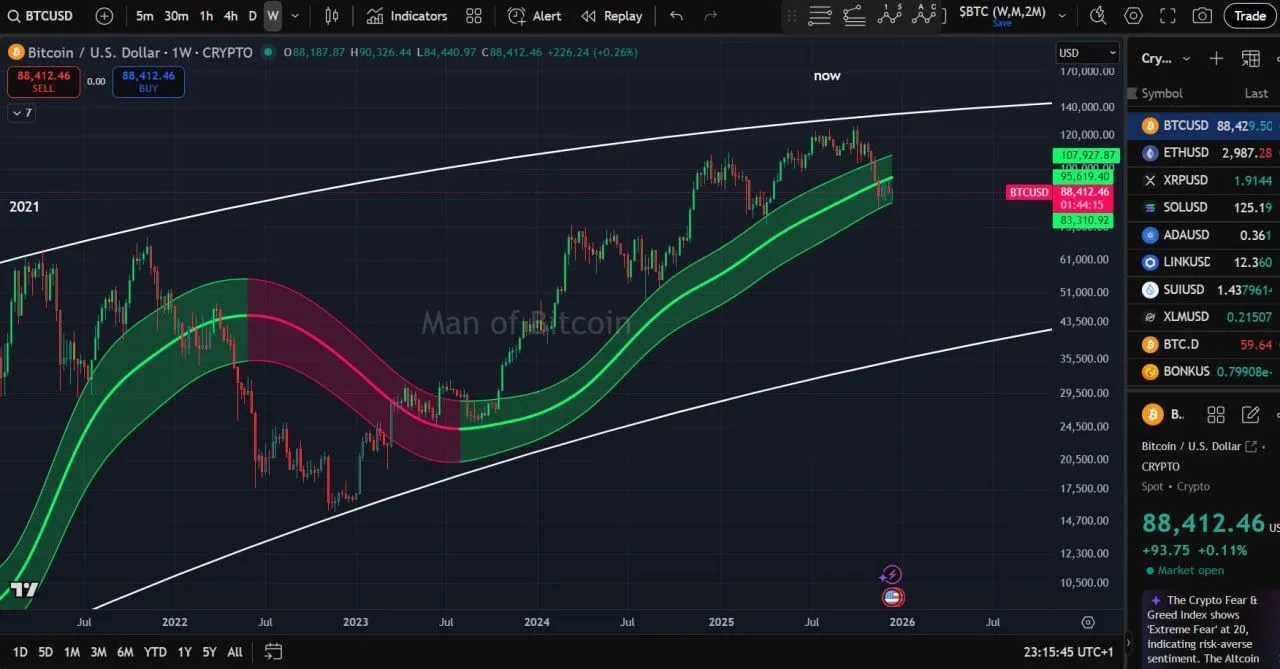
Bitcoin Gaussian Channel Weekly Chart: Source: TradingView, Man of Bitcoin (X)
The Gaussian channel tracks trend strength by smoothing price into dynamic support and resistance zones. In this case, the lower band sits just below current price and acts as a key technical threshold. As long as weekly candles continue to close above that boundary, the structure signals trend continuation rather than breakdown.
The chart also shows BTC trading well inside a long term rising channel drawn from the 2021 cycle. While price recently pulled back from higher levels near $110,000, it has not violated the lower Gaussian band or the broader channel floor. That positioning suggests consolidation within trend, not a confirmed reversal.
The analyst stressed that the weekly close matters more than intraday moves. A sustained close below the lower Gaussian boundary would weaken the bullish structure and shift focus toward deeper support levels. Until then, the trend framework remains intact for Bitcoin.