
Bitcoin is dancing in tight shoes today, hovering just under the psychological $90,000 level like it’s flirting with commitment. With a 24-hour price range as narrow as a New Year’s diet plan, the asset is channeling sideways vibes with a market cap that would make some nations blush. The $18.29 billion in trading volume suggests traders are either indecisive or too hungover from recent volatility to make a move.
Bitcoin Chart Outlook
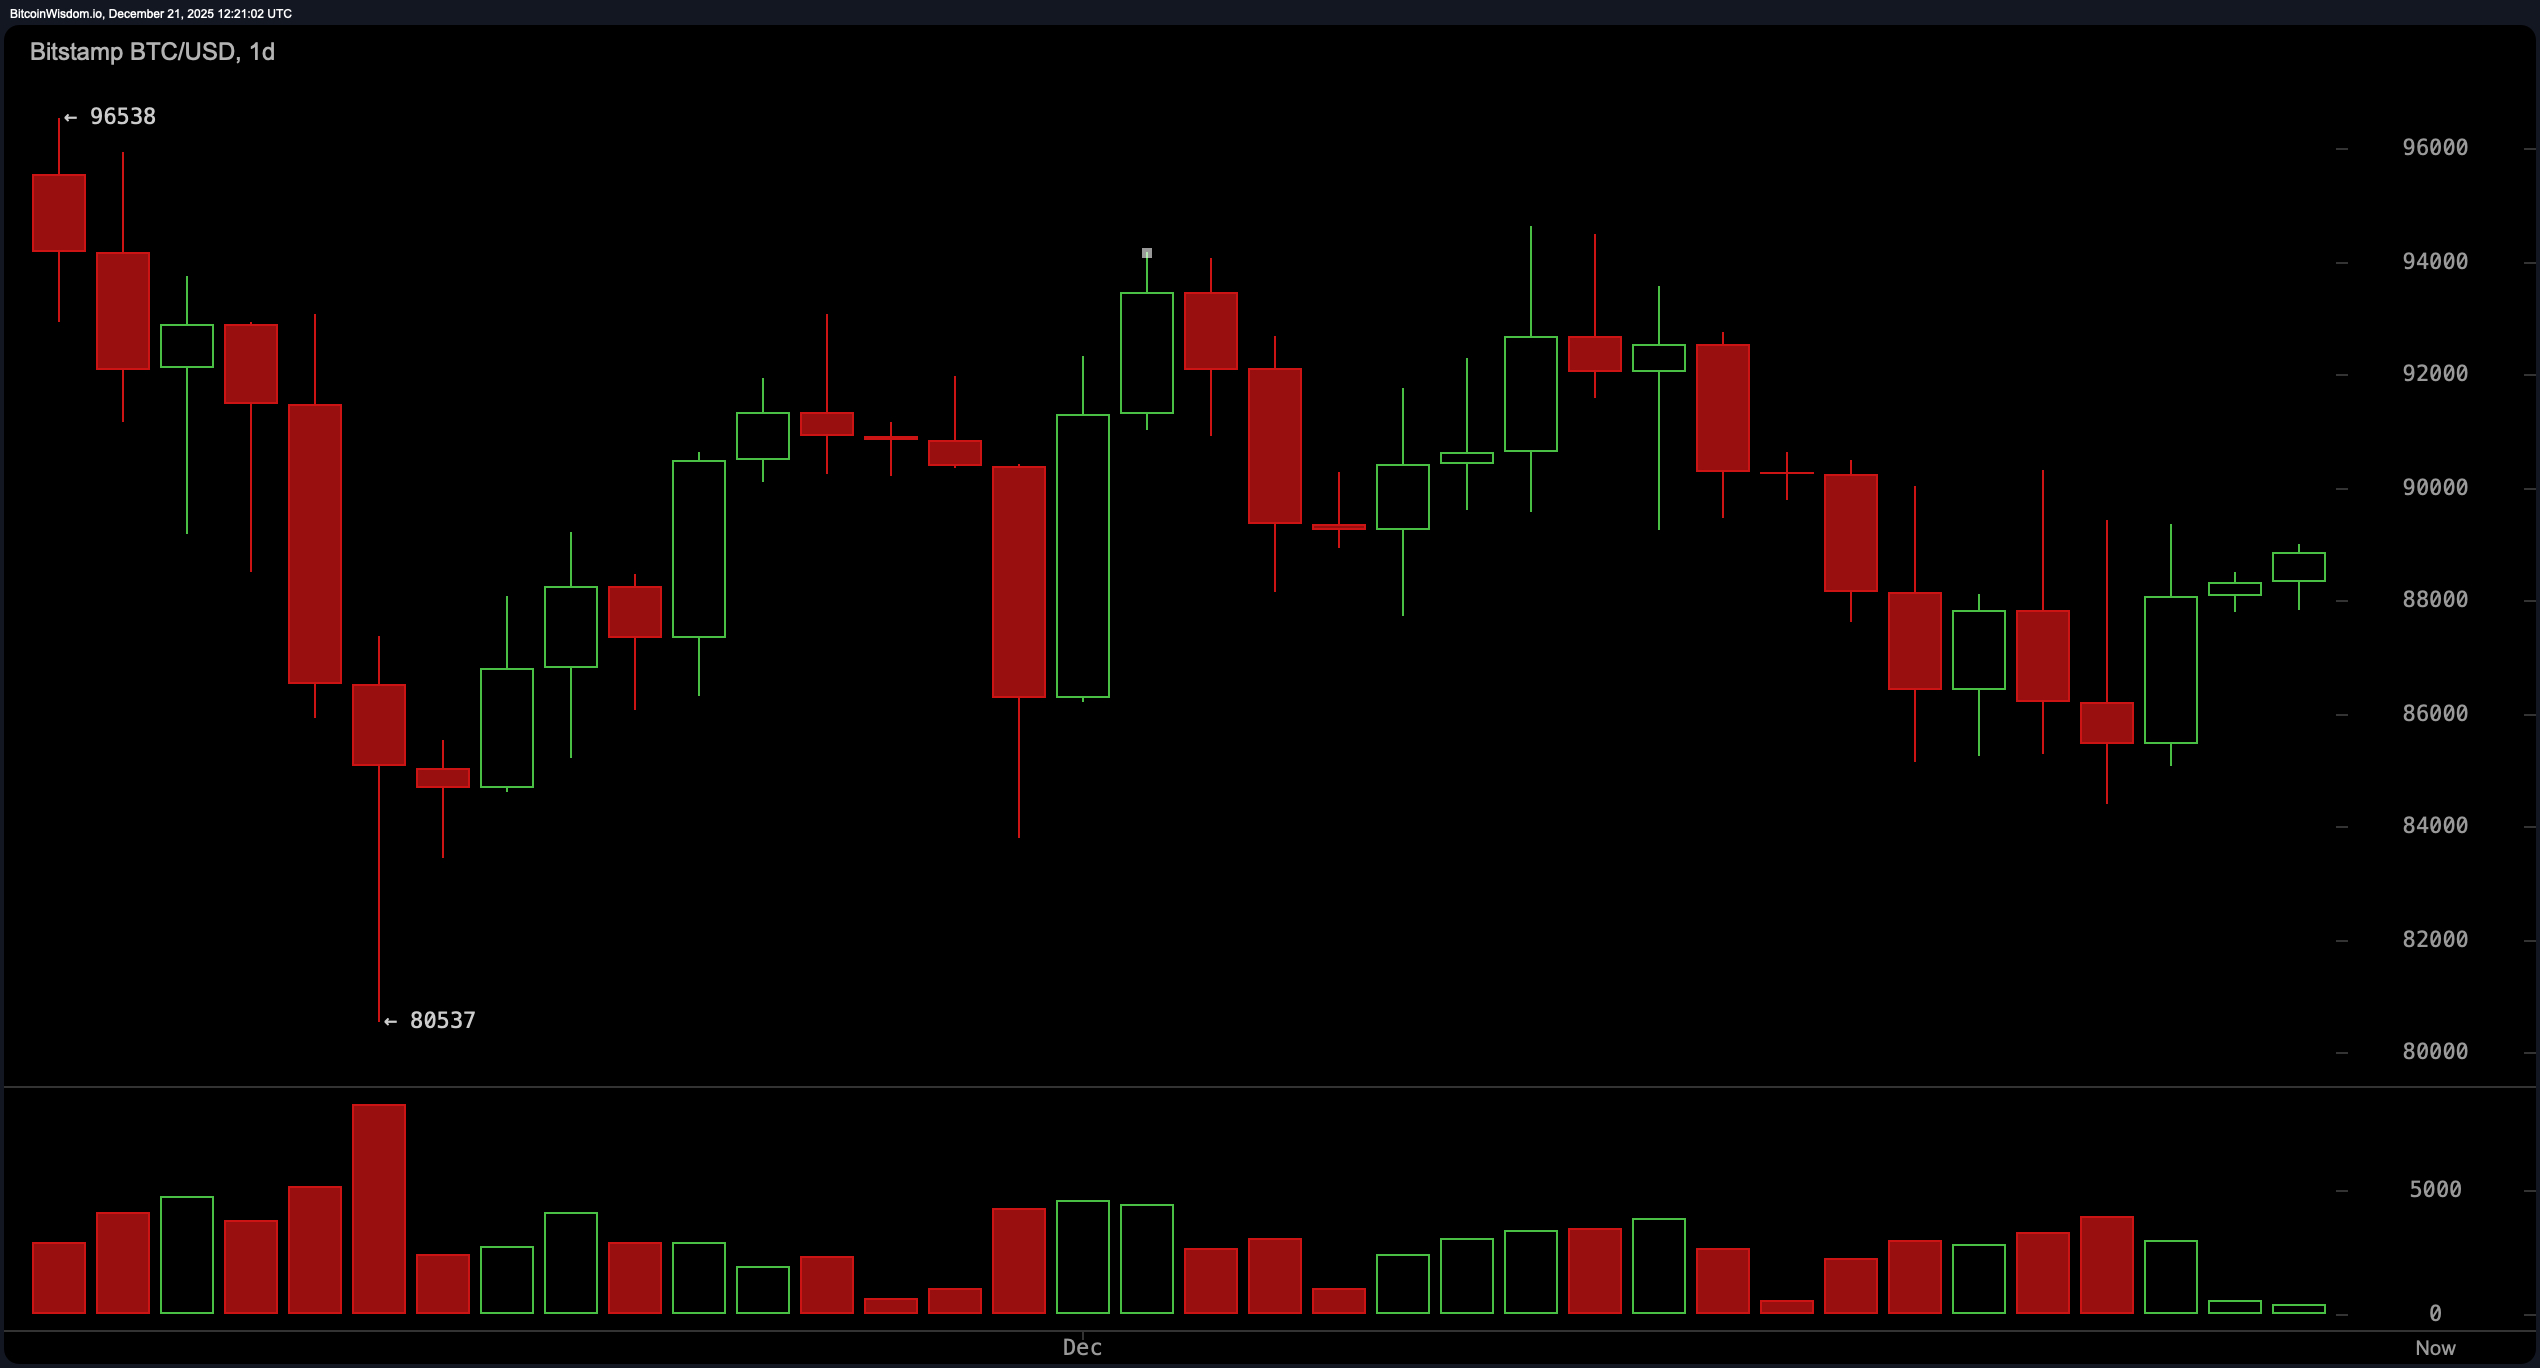
Bitcoin‘s daily chart is trying to compose itself after a melodramatic plunge from approximately $96,538 to around $80,537. The price has been cobbling together higher lows in a valiant attempt at stabilization, now coiling between $86,000 and $90,000.
The relative strength index ( RSI) sits at 46, reflecting indecision rather than enthusiasm, while the moving average convergence divergence ( MACD) level at −1,561 nudges slightly more optimistic, diverging from the otherwise neutral pack of oscillators. The 10-period exponential moving average (EMA) and simple moving average (SMA) support the current price, but the 20-, 30-, 50-, 100-, and 200-period variants? Not so generous—they’re all parked comfortably above current levels, forming a resistance phalanx worthy of Sparta.
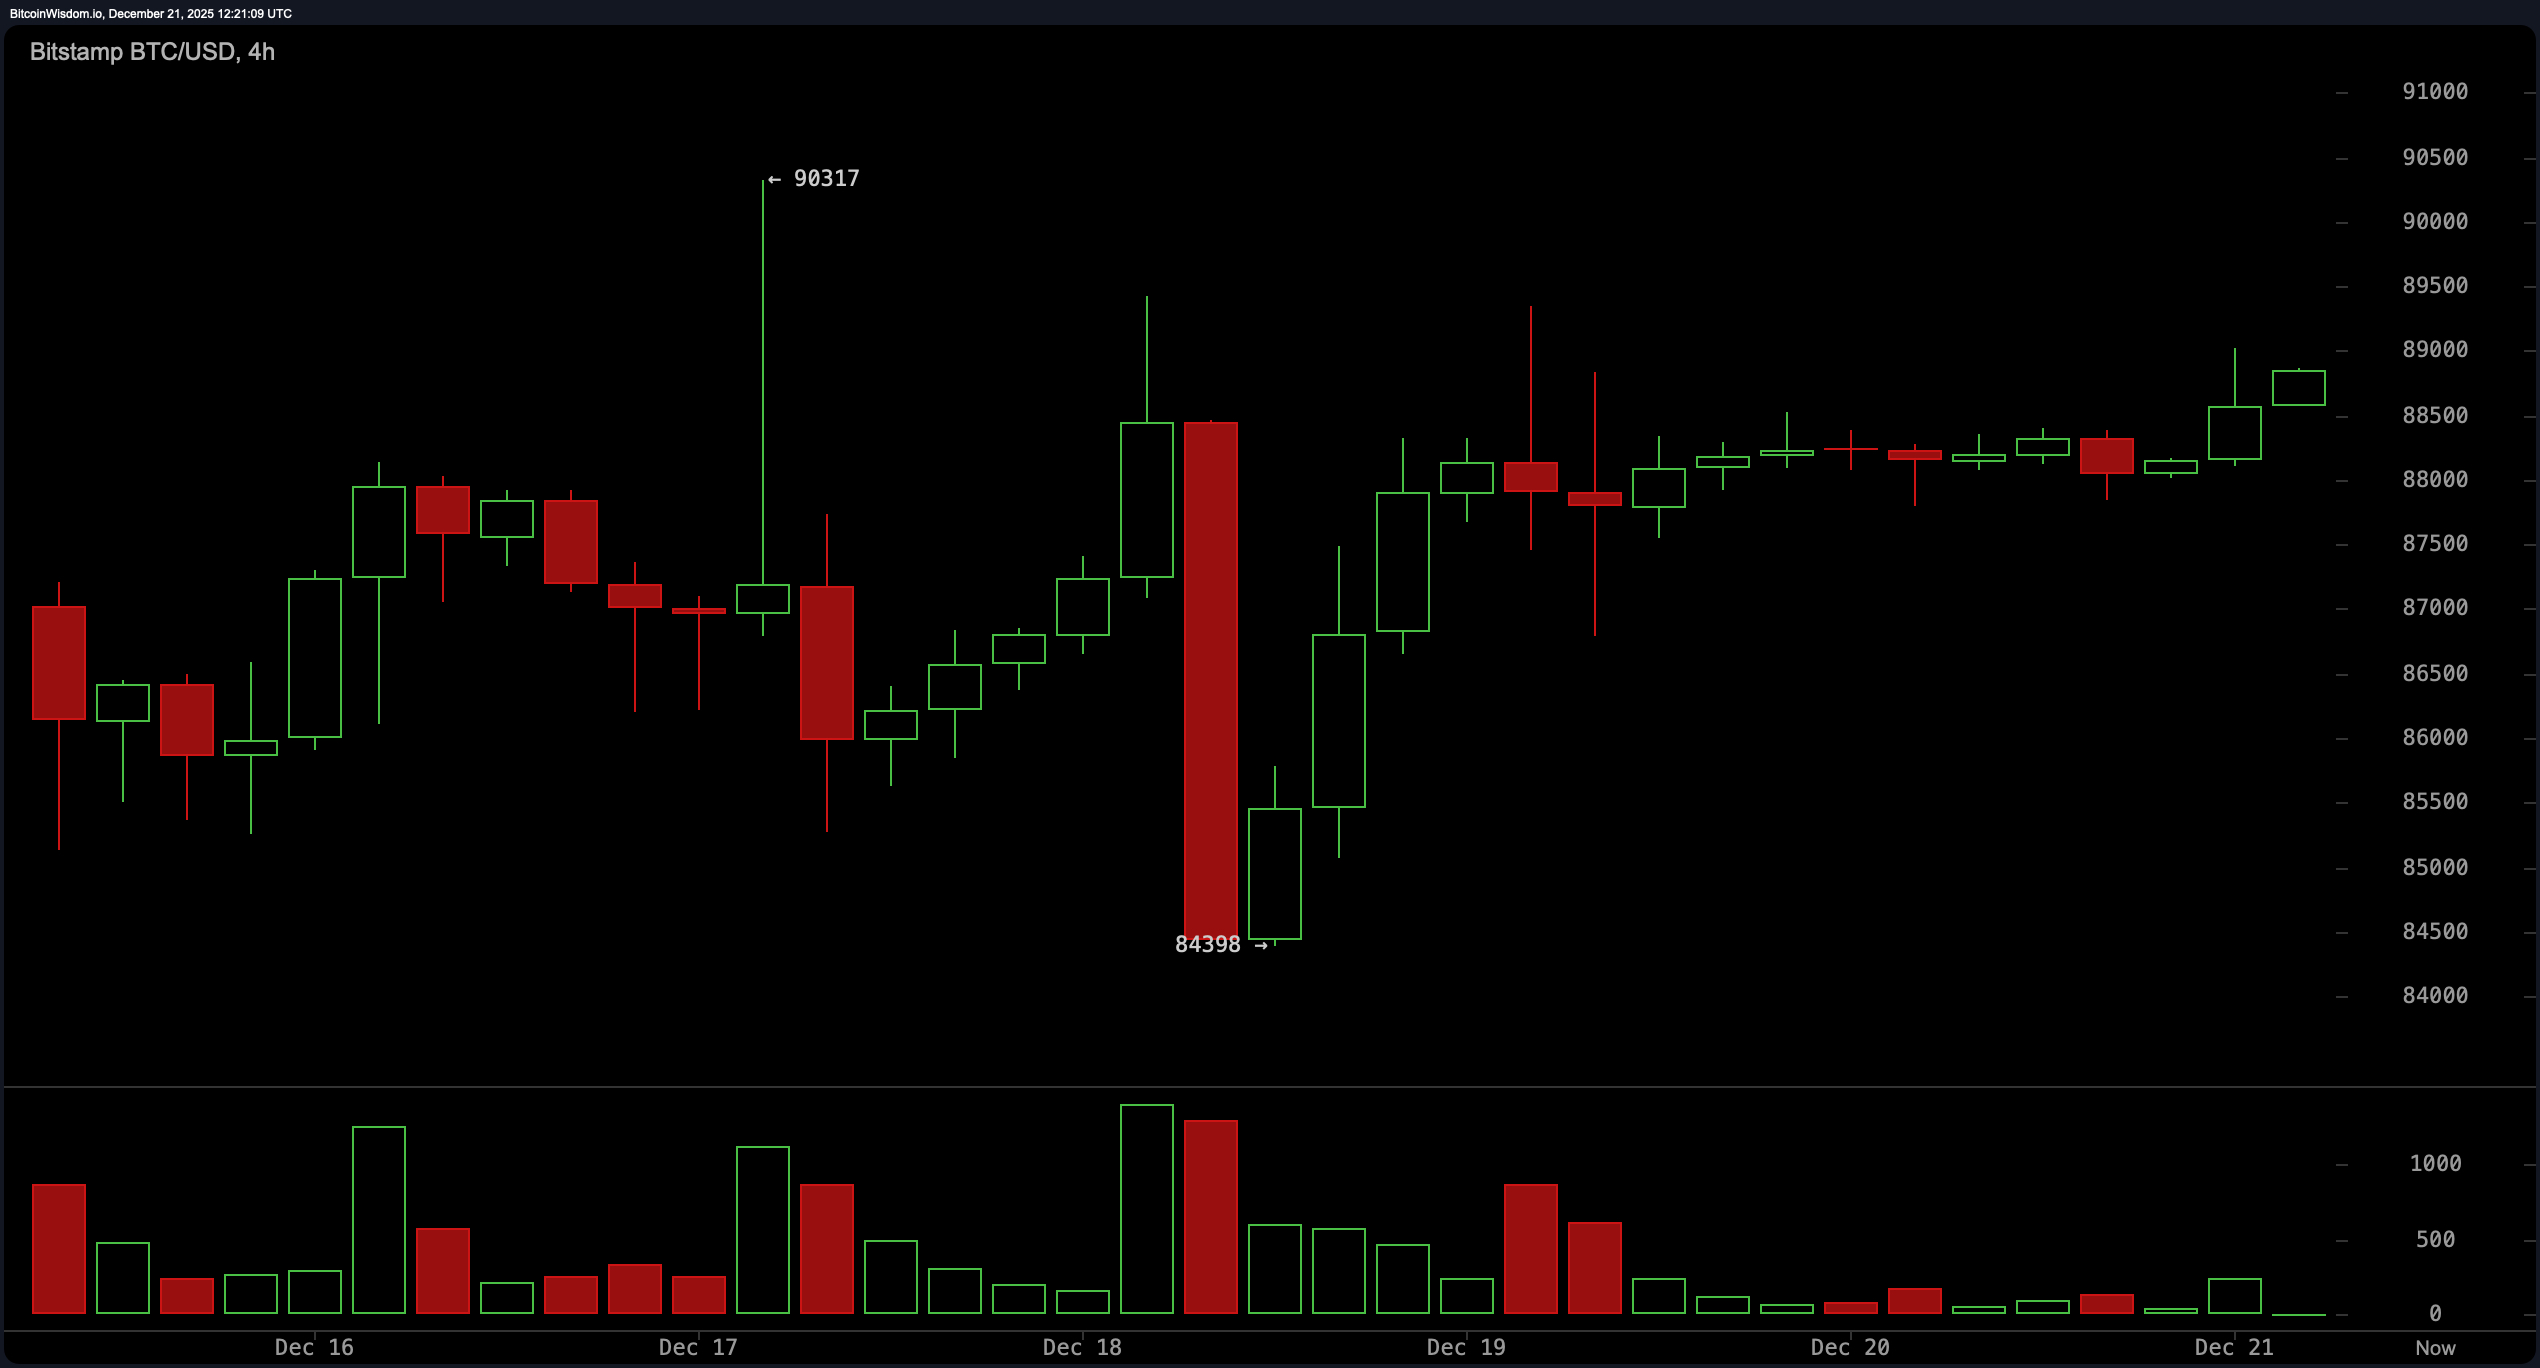
Zooming into the 4-hour chart, bitcoin’s short-term tale reads like a story of recovery with unresolved trauma. After a rude liquidation candle knocked it down from 90,317 to 84,398 on Dec. 18, it’s been crawling back with higher highs and higher lows. This structured rebound, now testing the 88,500 to 90,000 supply zone, lacks the gusto of strong volume—suggesting that while the price wants to rally, the conviction hasn’t RSVP’d. The stochastic oscillator at 39 and the commodity channel index (CCI) at −47 are whispering, not shouting, giving traders more room to interpret than a modern art gallery.
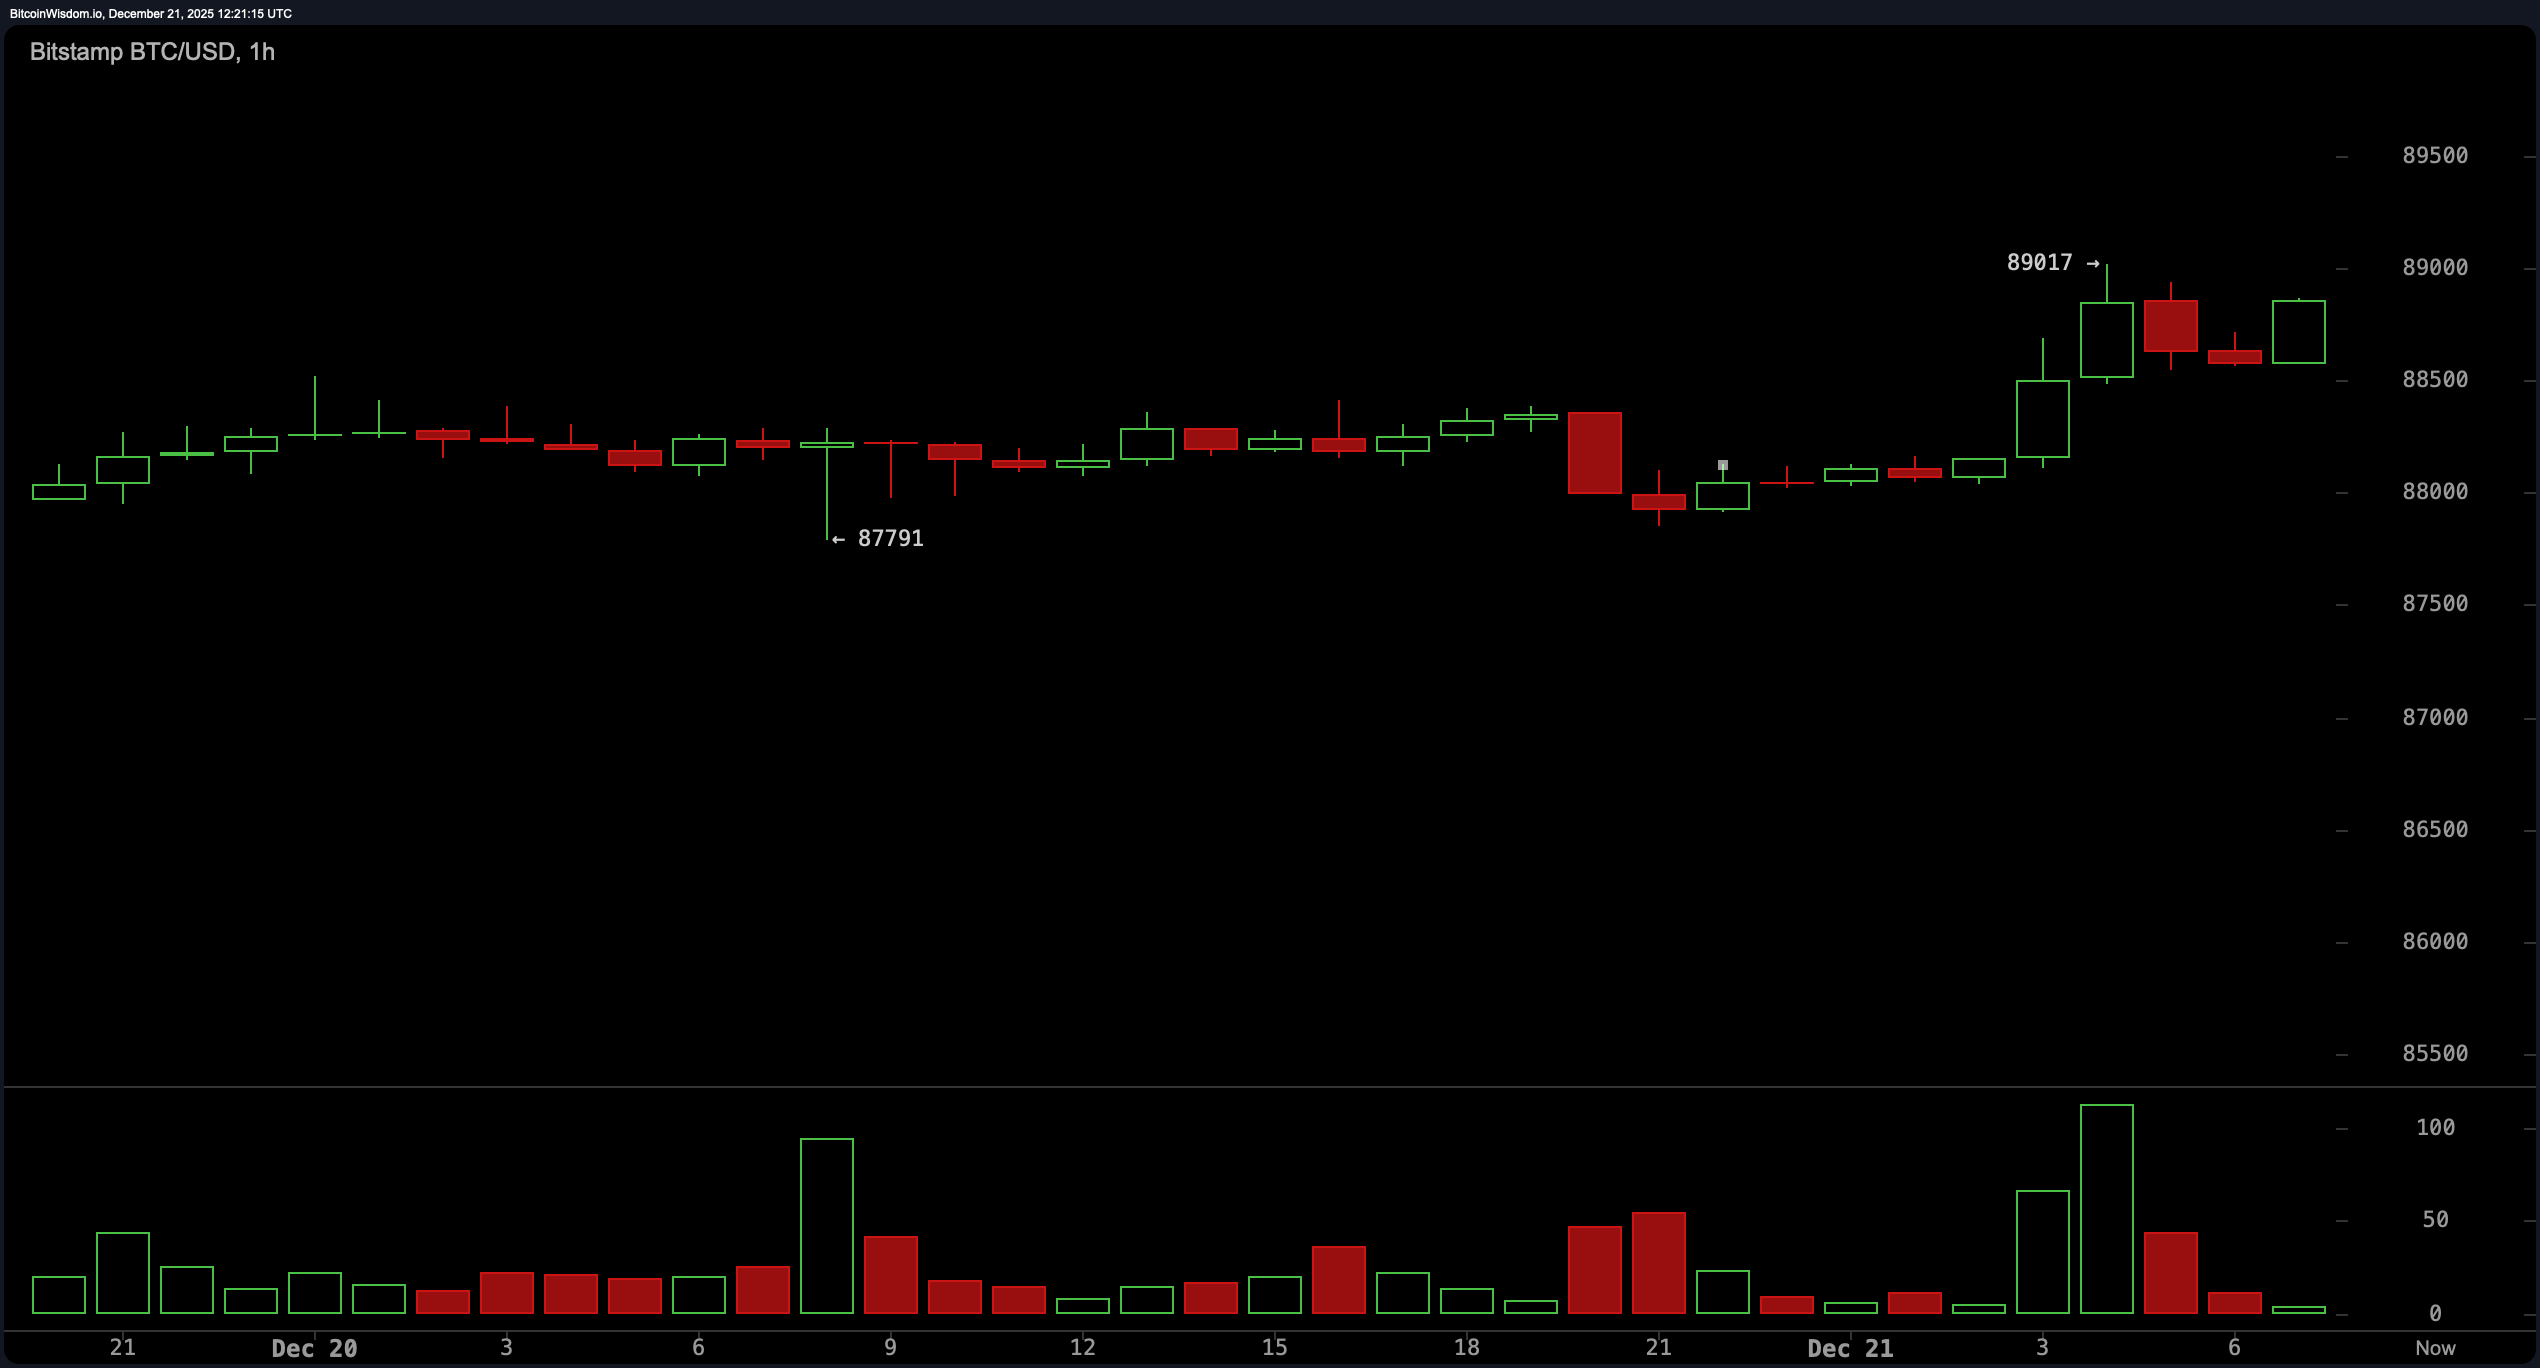
At the hourly level, bitcoin is curled up in a cozy consolidation pattern, trading tightly between $88,000 and $89,000. The awesome oscillator at −1,590 and momentum reading of −3,804 add a bit of a grimace to the picture, indicating the asset might be catching its breath—or just tired. Low volume is the uninvited guest here, so any breakout above $89,500 would need to be backed by some serious participation. Until then, this micro-range action might feel more like watching paint dry—albeit very expensive paint.
From a structural standpoint, bitcoin has the skeleton of a bullish narrative but lacks the muscle to flex confidently. The higher lows are encouraging, and support at $86,000 is acting like a firm mattress. But macro resistance at $90,000 remains the velvet rope at the nightclub—price wants in, but the bouncer ( volume) isn’t budging. If volume finally wakes up and price breaks that ceiling, we could see momentum shift decisively. Until then, the setup favors patient strategies over impulsive heroics.
Bottom line: bitcoin is playing a careful game of balance on Dec. 21. With mixed signals across oscillators and moving averages, and price consolidation that screams “wait for confirmation,” this isn’t the time for reckless decision-making. Instead, it’s a moment to watch the charts, respect the ranges, and keep an eye on the 90,000 mark like it owes you money. Because if that breaks with conviction, bitcoin might just have a lot more to say.
Bull Verdict:
If the price closes above $90,000 with strong volume support, the bullish case builds undeniable momentum. With higher lows forming across all timeframes and early support from short-term moving averages, bitcoin could be gearing up for a fresh leg upward. Confirmation of breakout structure would tilt the bias toward continued upside—granted the volume finally decides to show up to the party.
Bear Verdict:
Failure to break above $90,000—especially if paired with a drop below $85,000 on rising volume—could indicate that the recent bounce was merely a dead-cat wiggle. Persistent resistance across all long-term moving averages, along with weakening momentum and neutral oscillator readings, suggests bulls are on probation. A break below $84,000 would invalidate the recovery narrative and open the door for deeper correction.
FAQ 🧠
- What is bitcoin’s price today? Bitcoin is trading at $88,787 as of December 21, 2025.
- Is bitcoin expected to rise above $90,000?A breakout above $90,000 depends on strong volume confirmation.
- What are the key support and resistance levels?Support is near $86,000, with resistance at $90,000.
- Is now a good time to trade bitcoin?Current technicals suggest waiting for clearer trend confirmation.