
Bitcoin’s been in a mood lately—dipping, bouncing, and teasing chartists with every candle. Hovering just below $88,000 on Thursday morning around 8:30 a.m. EST, the king of crypto seems caught in a flirtation between bears reluctant to let go and bulls trying to gather their courage.
Bitcoin Chart Outlook
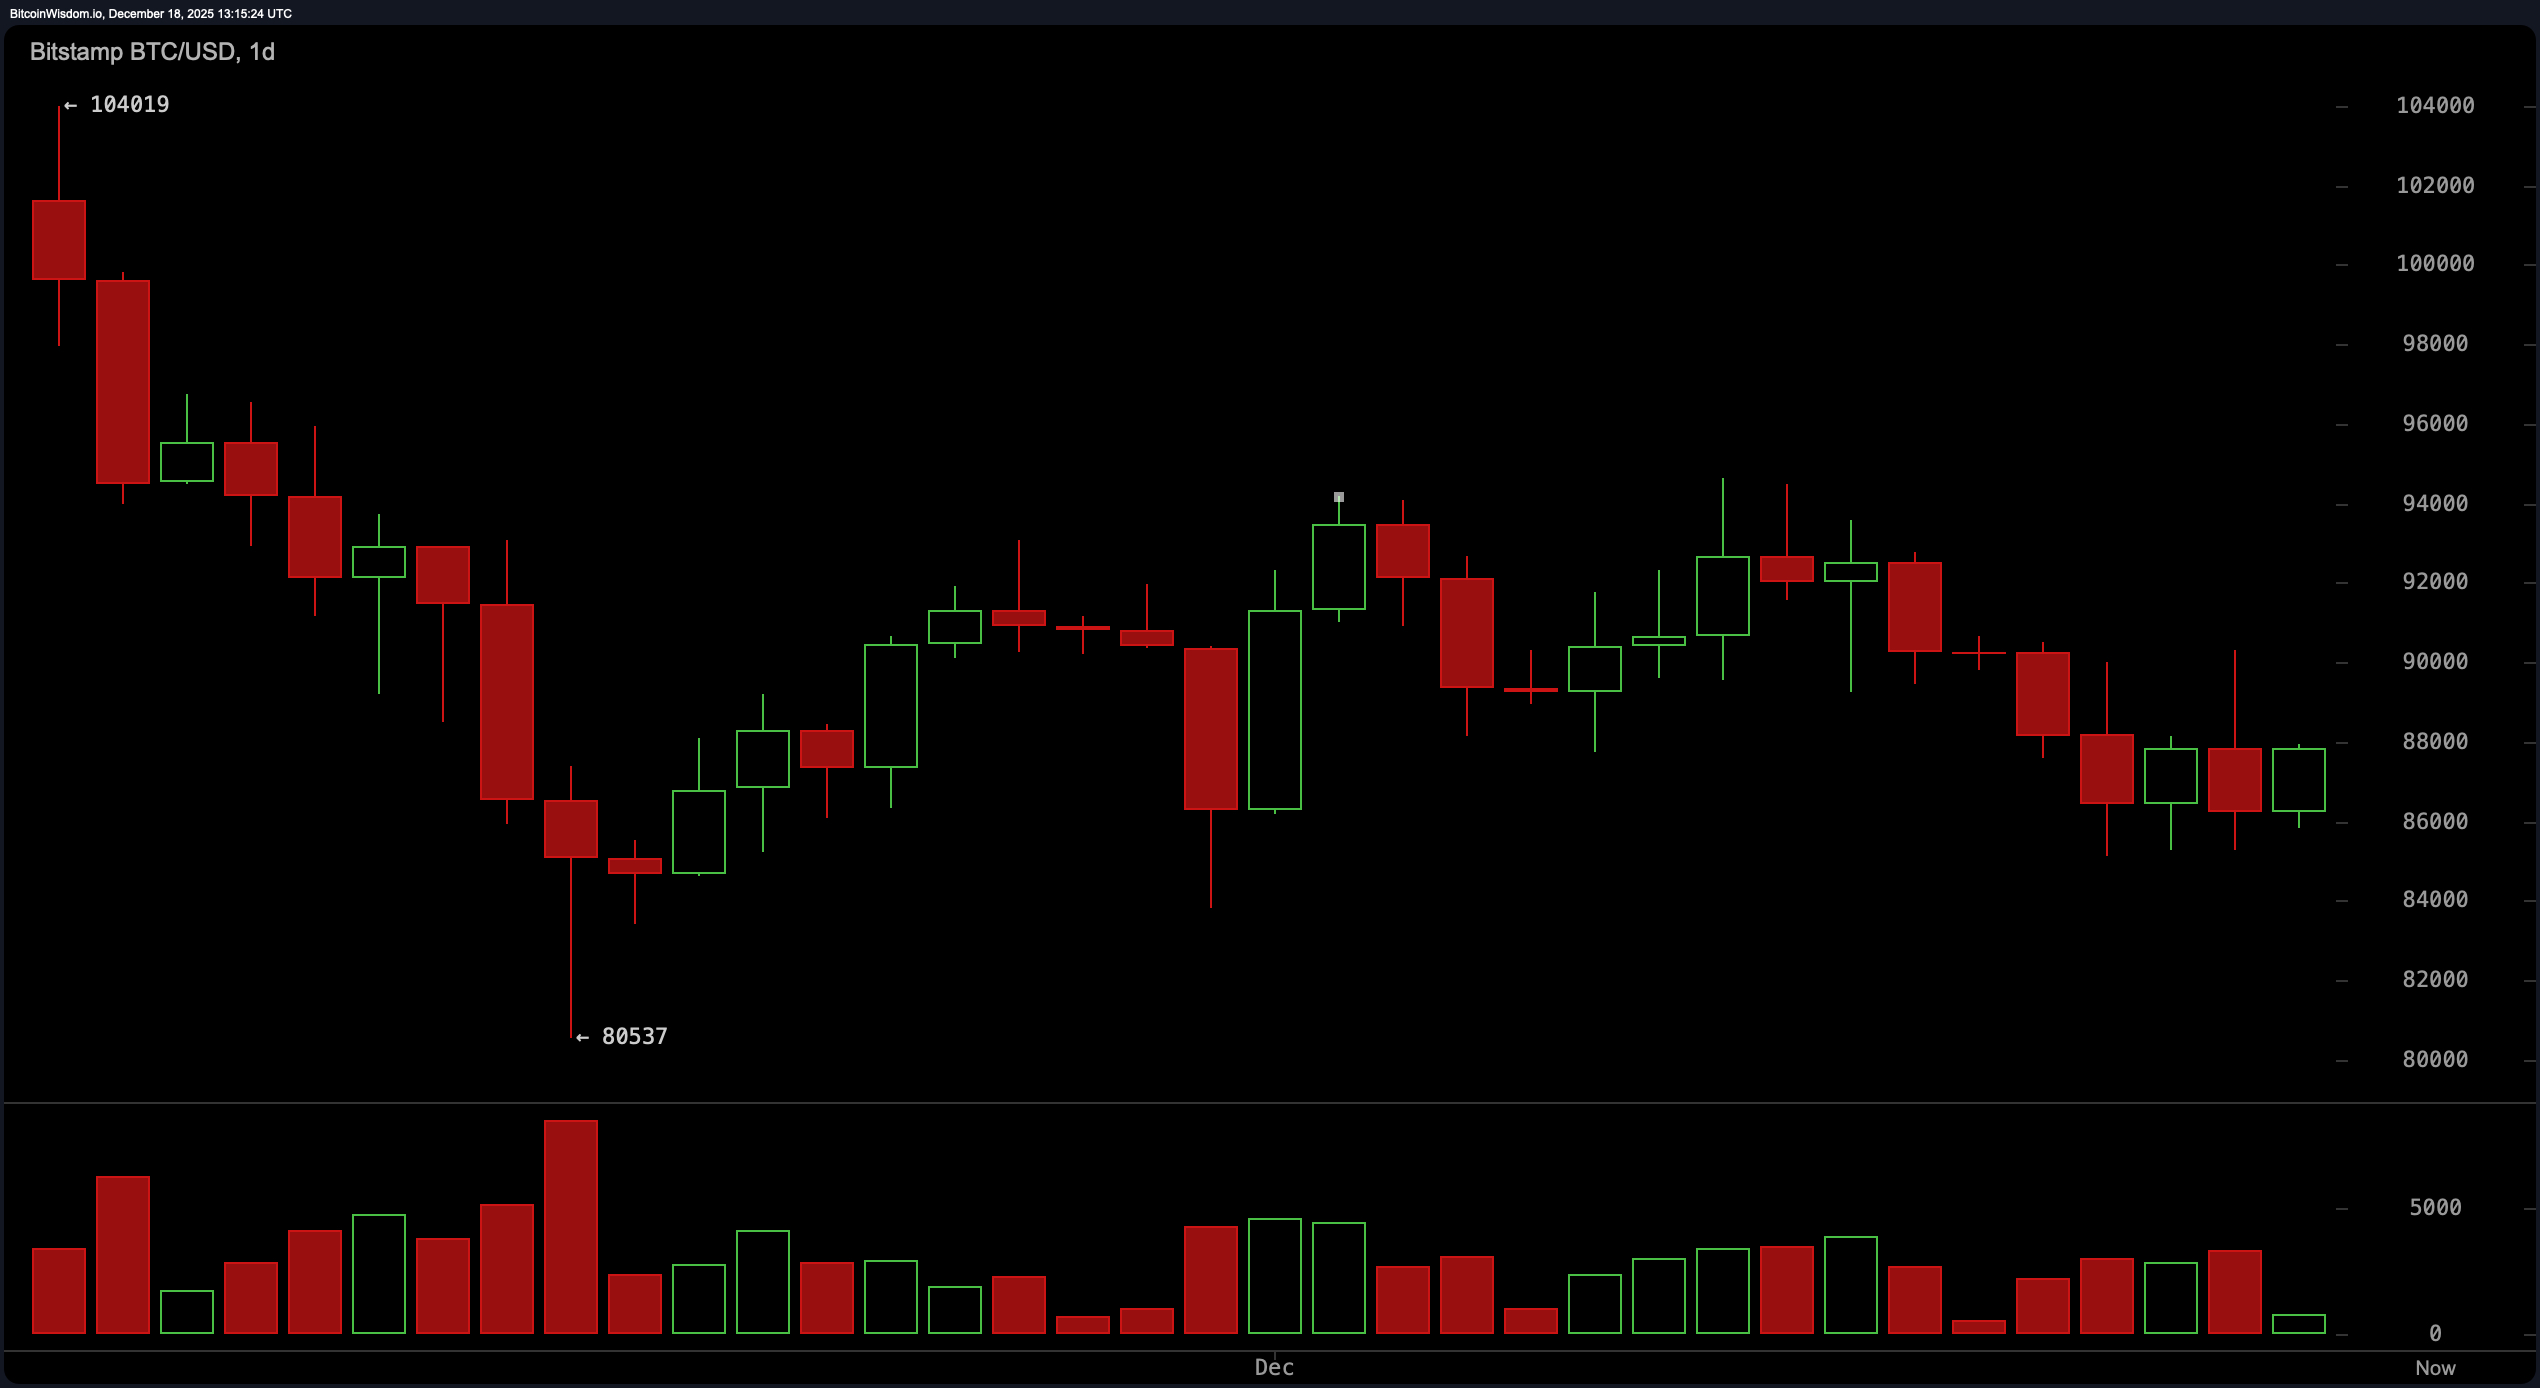
Relative strength index ( RSI) on the 1-day chart is sitting at 41, squarely in neutral territory, and echoing what many traders feel: indecision. The moving average convergence divergence ( MACD), however, is playing the cynic, with a negative reading of −1,799, hinting at downward momentum.
Meanwhile, the momentum (10) oscillator and commodity channel index (CCI 20) are waving small contrarian flags from the bullish camp. Add in an average directional index (ADX 14) at 26, and you’ve got confirmation of the market’s identity crisis—a trend too weak to inspire, yet not broken enough to ignore.
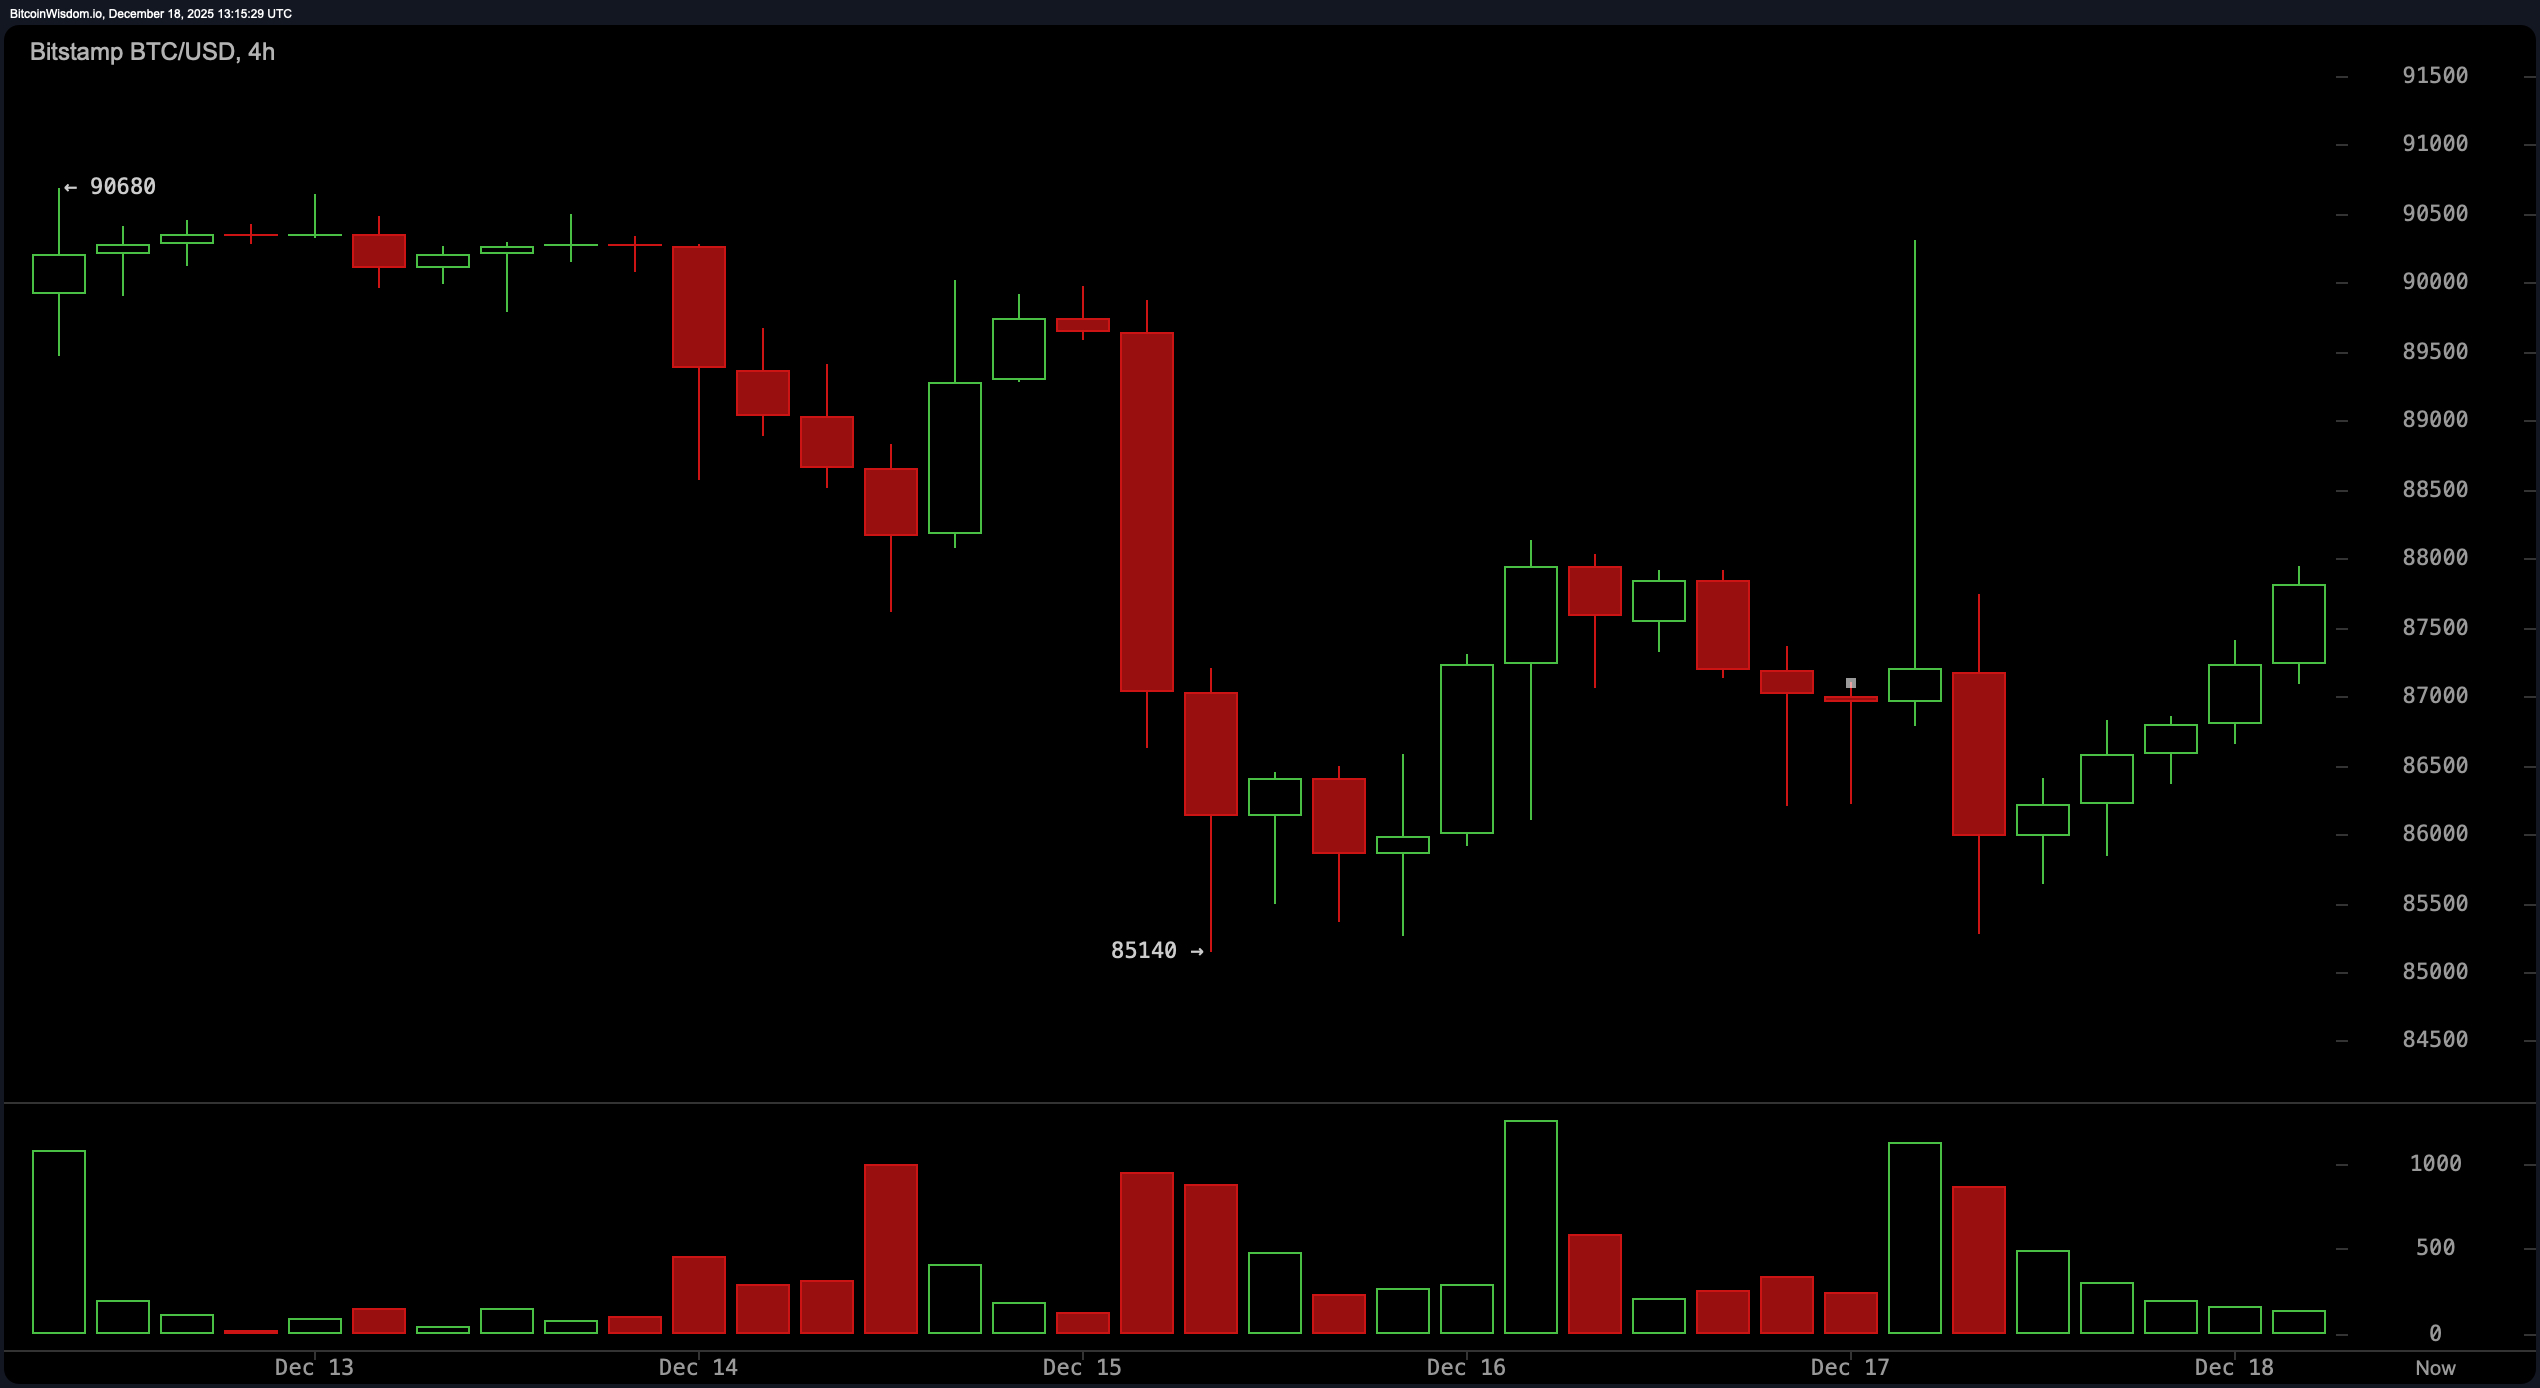
The 4-hour chart is where the plot thickens. After a sharp nosedive from approximately $90,600 to around $85,140, bitcoin appears to be crafting a bullish reversal setup, possibly a double bottom or a higher low. Price has since climbed back toward the $87,500–$88,000 range, with sporadic volume pulses suggesting the bulls are testing the waters. Despite the improved structure, the exponential moving average (EMA 20) and simple moving average (SMA 20) still cast a bearish shadow above at $89,752 and $89,891, respectively, making that 88K zone a critical resistance belt.
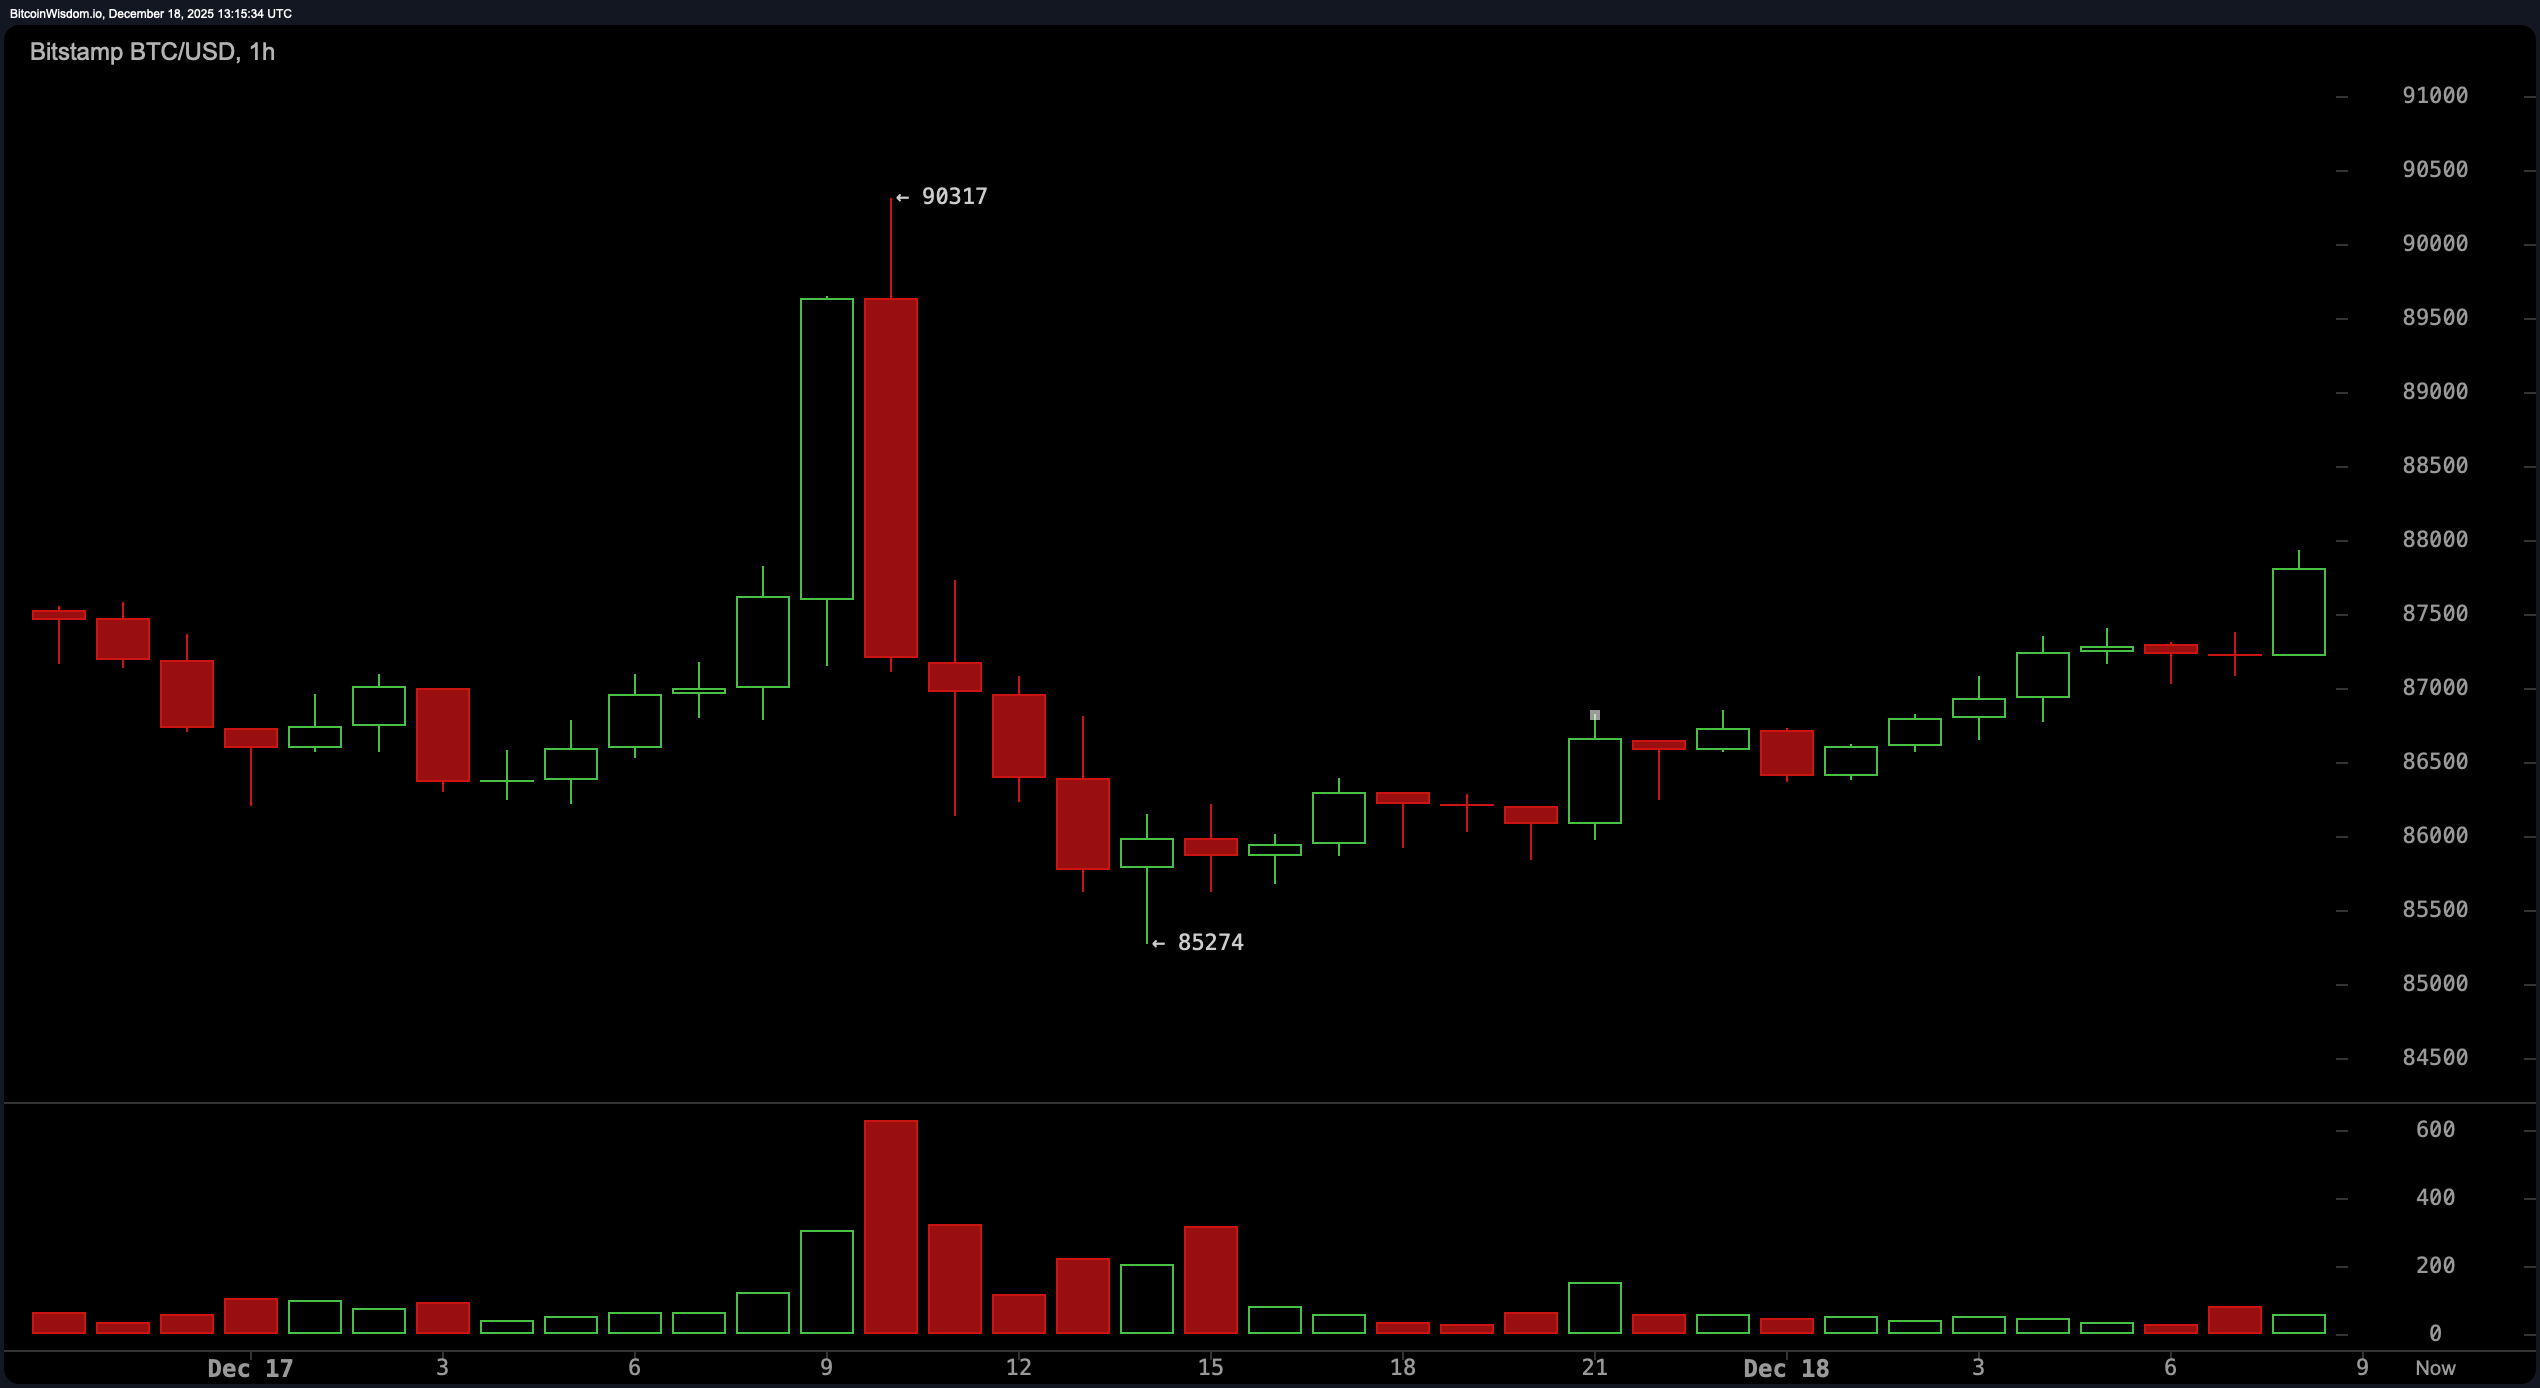
Short-term action on the 1-hour chart offers more optimism, albeit with a dash of caution. After a dramatic drop from $90,300 to just above $85,000, bitcoin has been building a modest uptrend, forming higher highs and higher lows. Yet the volume isn’t exactly backing the movement with conviction—it’s more of a polite nod than a full-throated cheer. With the exponential moving average (EMA 10) and simple moving average (SMA 10) hovering near $88,540 and $89,379, this trend’s next test lies just above current levels. A pullback toward $87,000 may provide a low-risk inflection point for those paying close attention.
Zooming out to the broader landscape of moving averages reveals a rather icy terrain. The 100-period and 200-period EMAs, sitting at $100,157 and $102,559, respectively, are firmly positioned above current price action. Even the 50-period simple moving average (SMA 50) at $94,441 isn’t offering any near-term support. The message from these moving averages is loud and clear: the long-term trend is still working through its hangover from the recent highs, and bitcoin needs a serious momentum jolt to get back in favor.
In sum, bitcoin is navigating an awkward growth spurt between bear fatigue and bull hesitation. The one-hour chart is whispering sweet nothings to intraday traders, while the daily chart demands proof before believing in any turnaround story. A clean break above $90,000 with muscle behind the move could shift the narrative, but until then, the price action remains a chess match played in slow motion, one careful candle at a time.
Bull Verdict:
The short-term charts are humming with potential, showcasing a resilient structure of higher lows and recovery bids from recent dips. If bitcoin can push past the $88,500–$90,000 range with decisive volume, the stage could be set for a broader reversal. The one-hour and four-hour setups suggest a market poised for continuation—provided momentum doesn’t fizzle.
Bear Verdict:
Despite flashes of recovery, bitcoin remains boxed in below critical resistance levels, with the daily trend still favoring the downside. The moving averages are stacked ominously overhead, and the MACD’s bearish reading alongside subdued volume underscores structural weakness. Until $90,000 is convincingly reclaimed, any rally may be short-lived and subject to whiplash.
FAQ 🐂 🐻
- What is bitcoin’s price today? Bitcoin is trading at $87,122 as of December 18, 2025.
- Is bitcoin in a bullish or bearish trend?Short-term charts show bullish signs, but the overall trend remains bearish.
- What is bitcoin’s intraday price range?The 24-hour trading range is between $85,373 and $90,164.
- What do technical indicators say about bitcoin now?Indicators are mixed, with weak momentum and heavy resistance near $90K.