
Bitcoin is fighting to regain its footing after taking a not-so-graceful tumble from the $89,500 range. While it’s found temporary support, the current market action suggests this bounce may be more of a breather than a comeback.
Bitcoin Chart Outlook
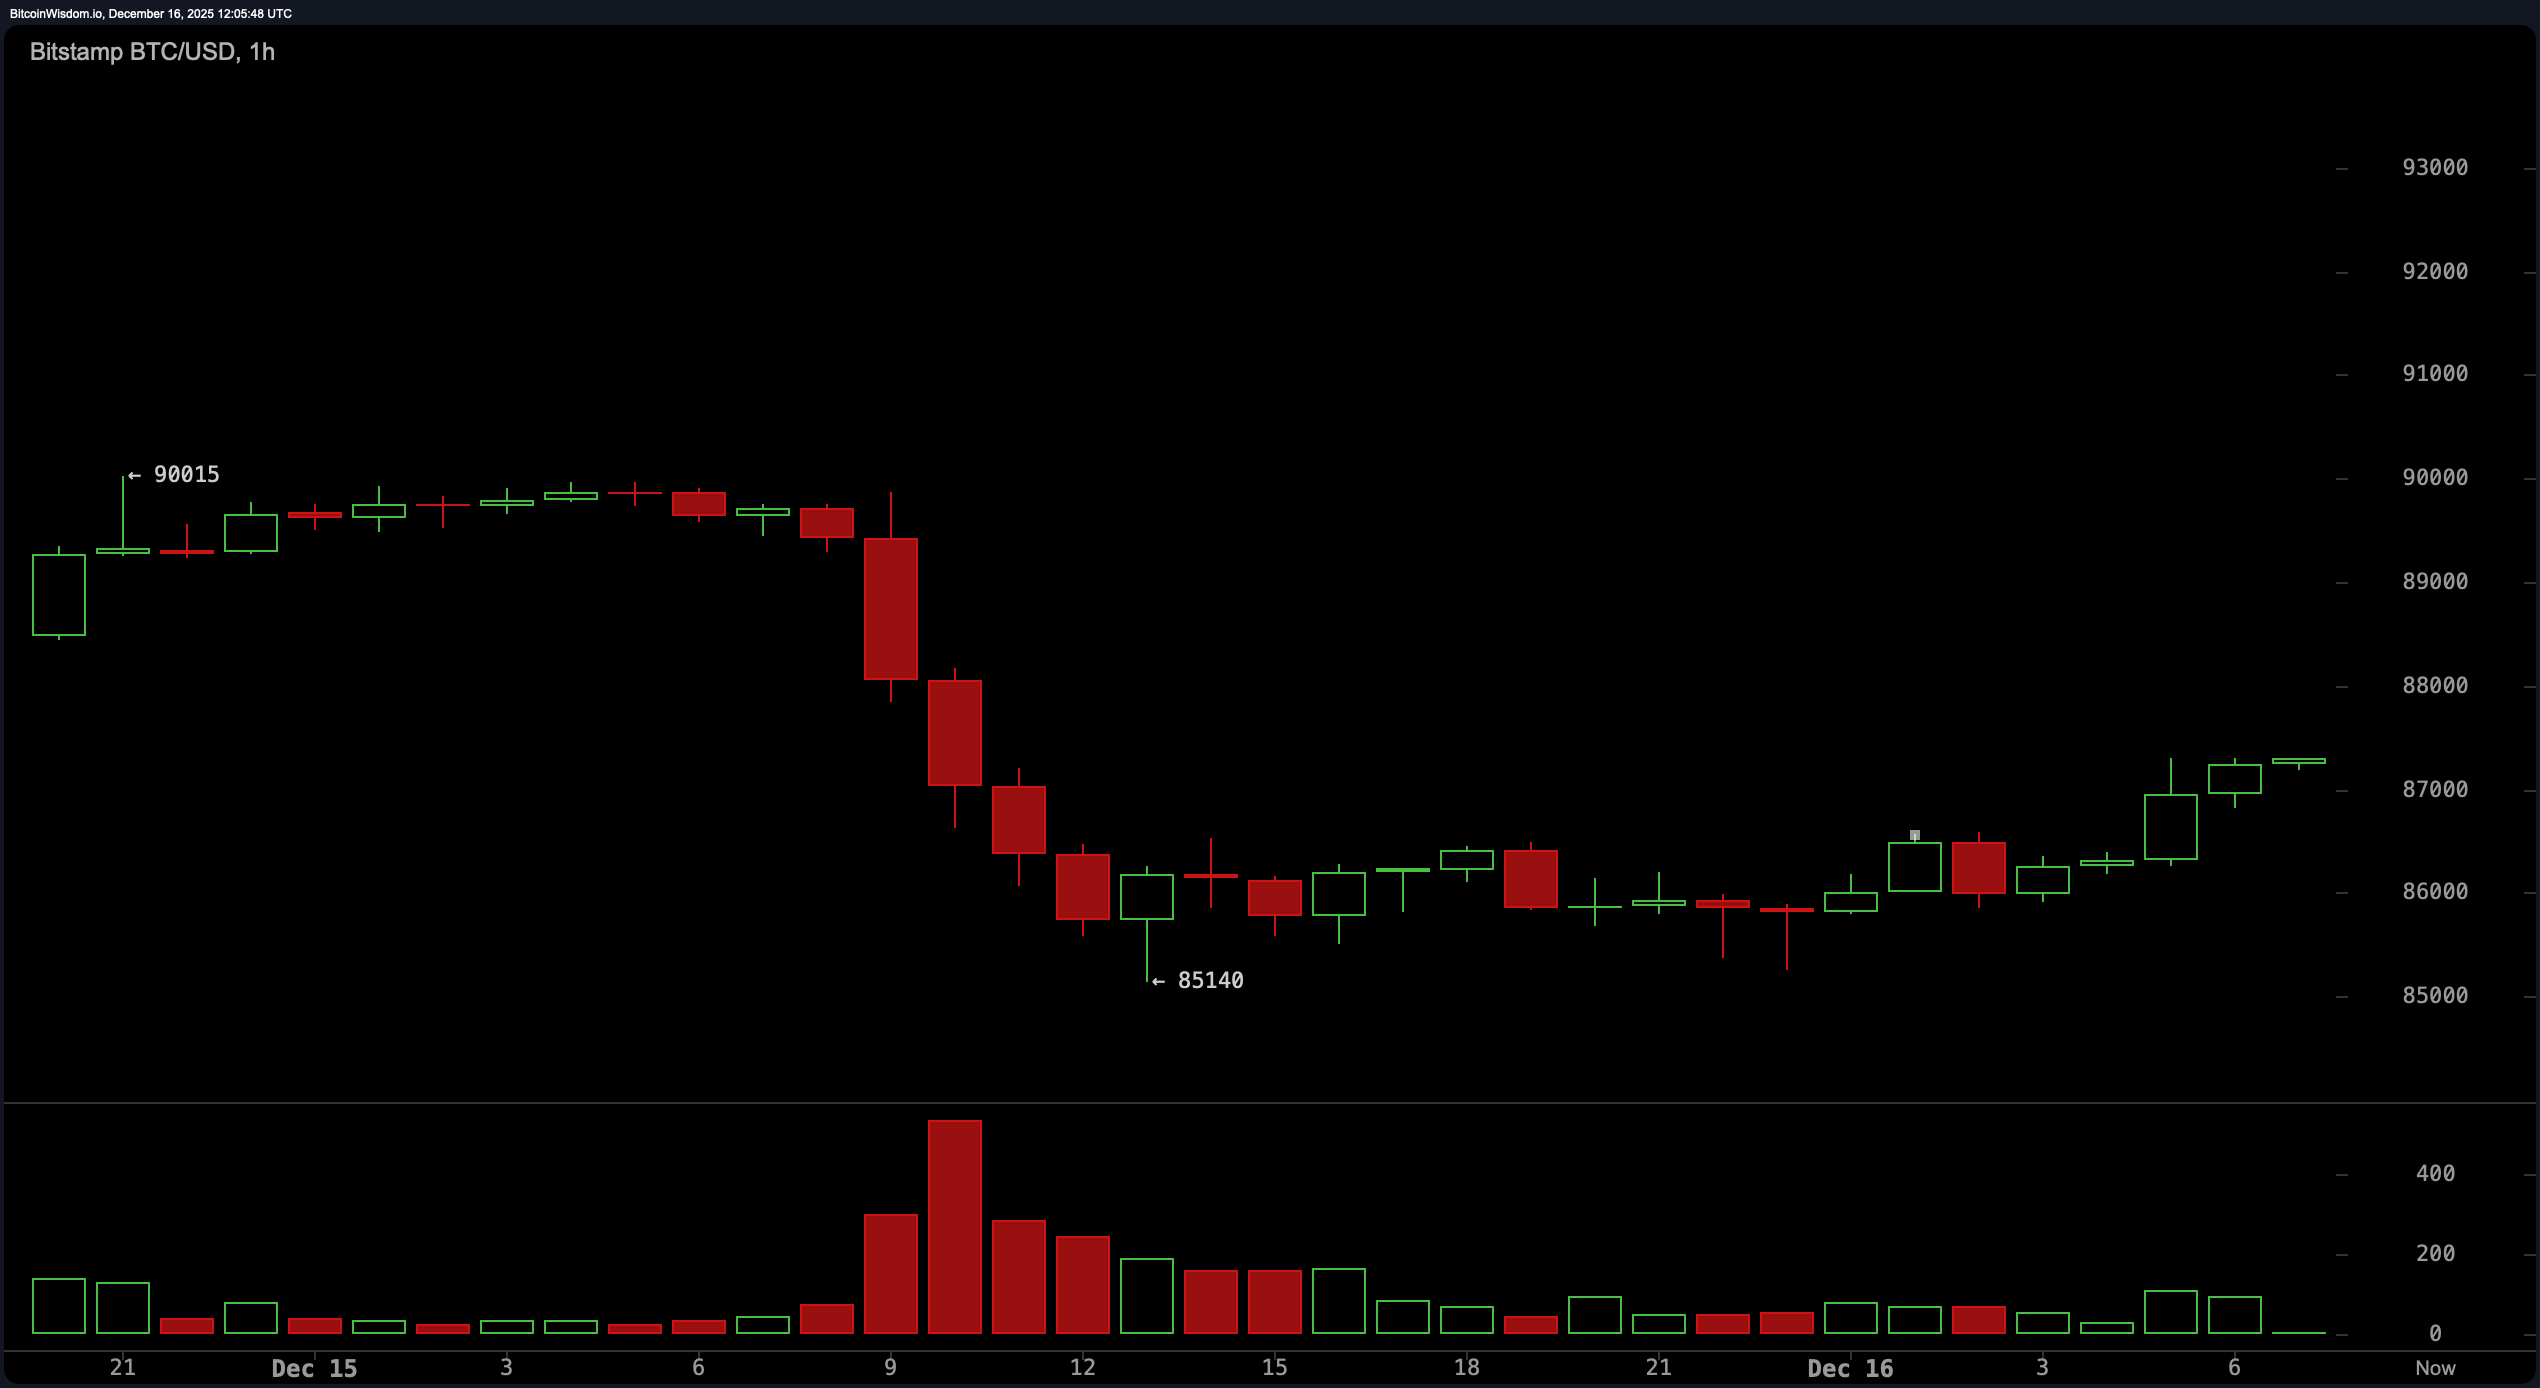
Starting with the one-hour chart, the price plunged from approximately $90,000 down to $85,000, before attempting to claw its way back. However, the pattern resembles a bear flag—a classic weak recovery formation with low volume and even lower enthusiasm.
Green candles lack follow-through, indicating that buyers might just be sightseeing. The next leg down seems likely unless a significant breakout above $88,500 occurs with high volume and confirmation from the four-hour chart.
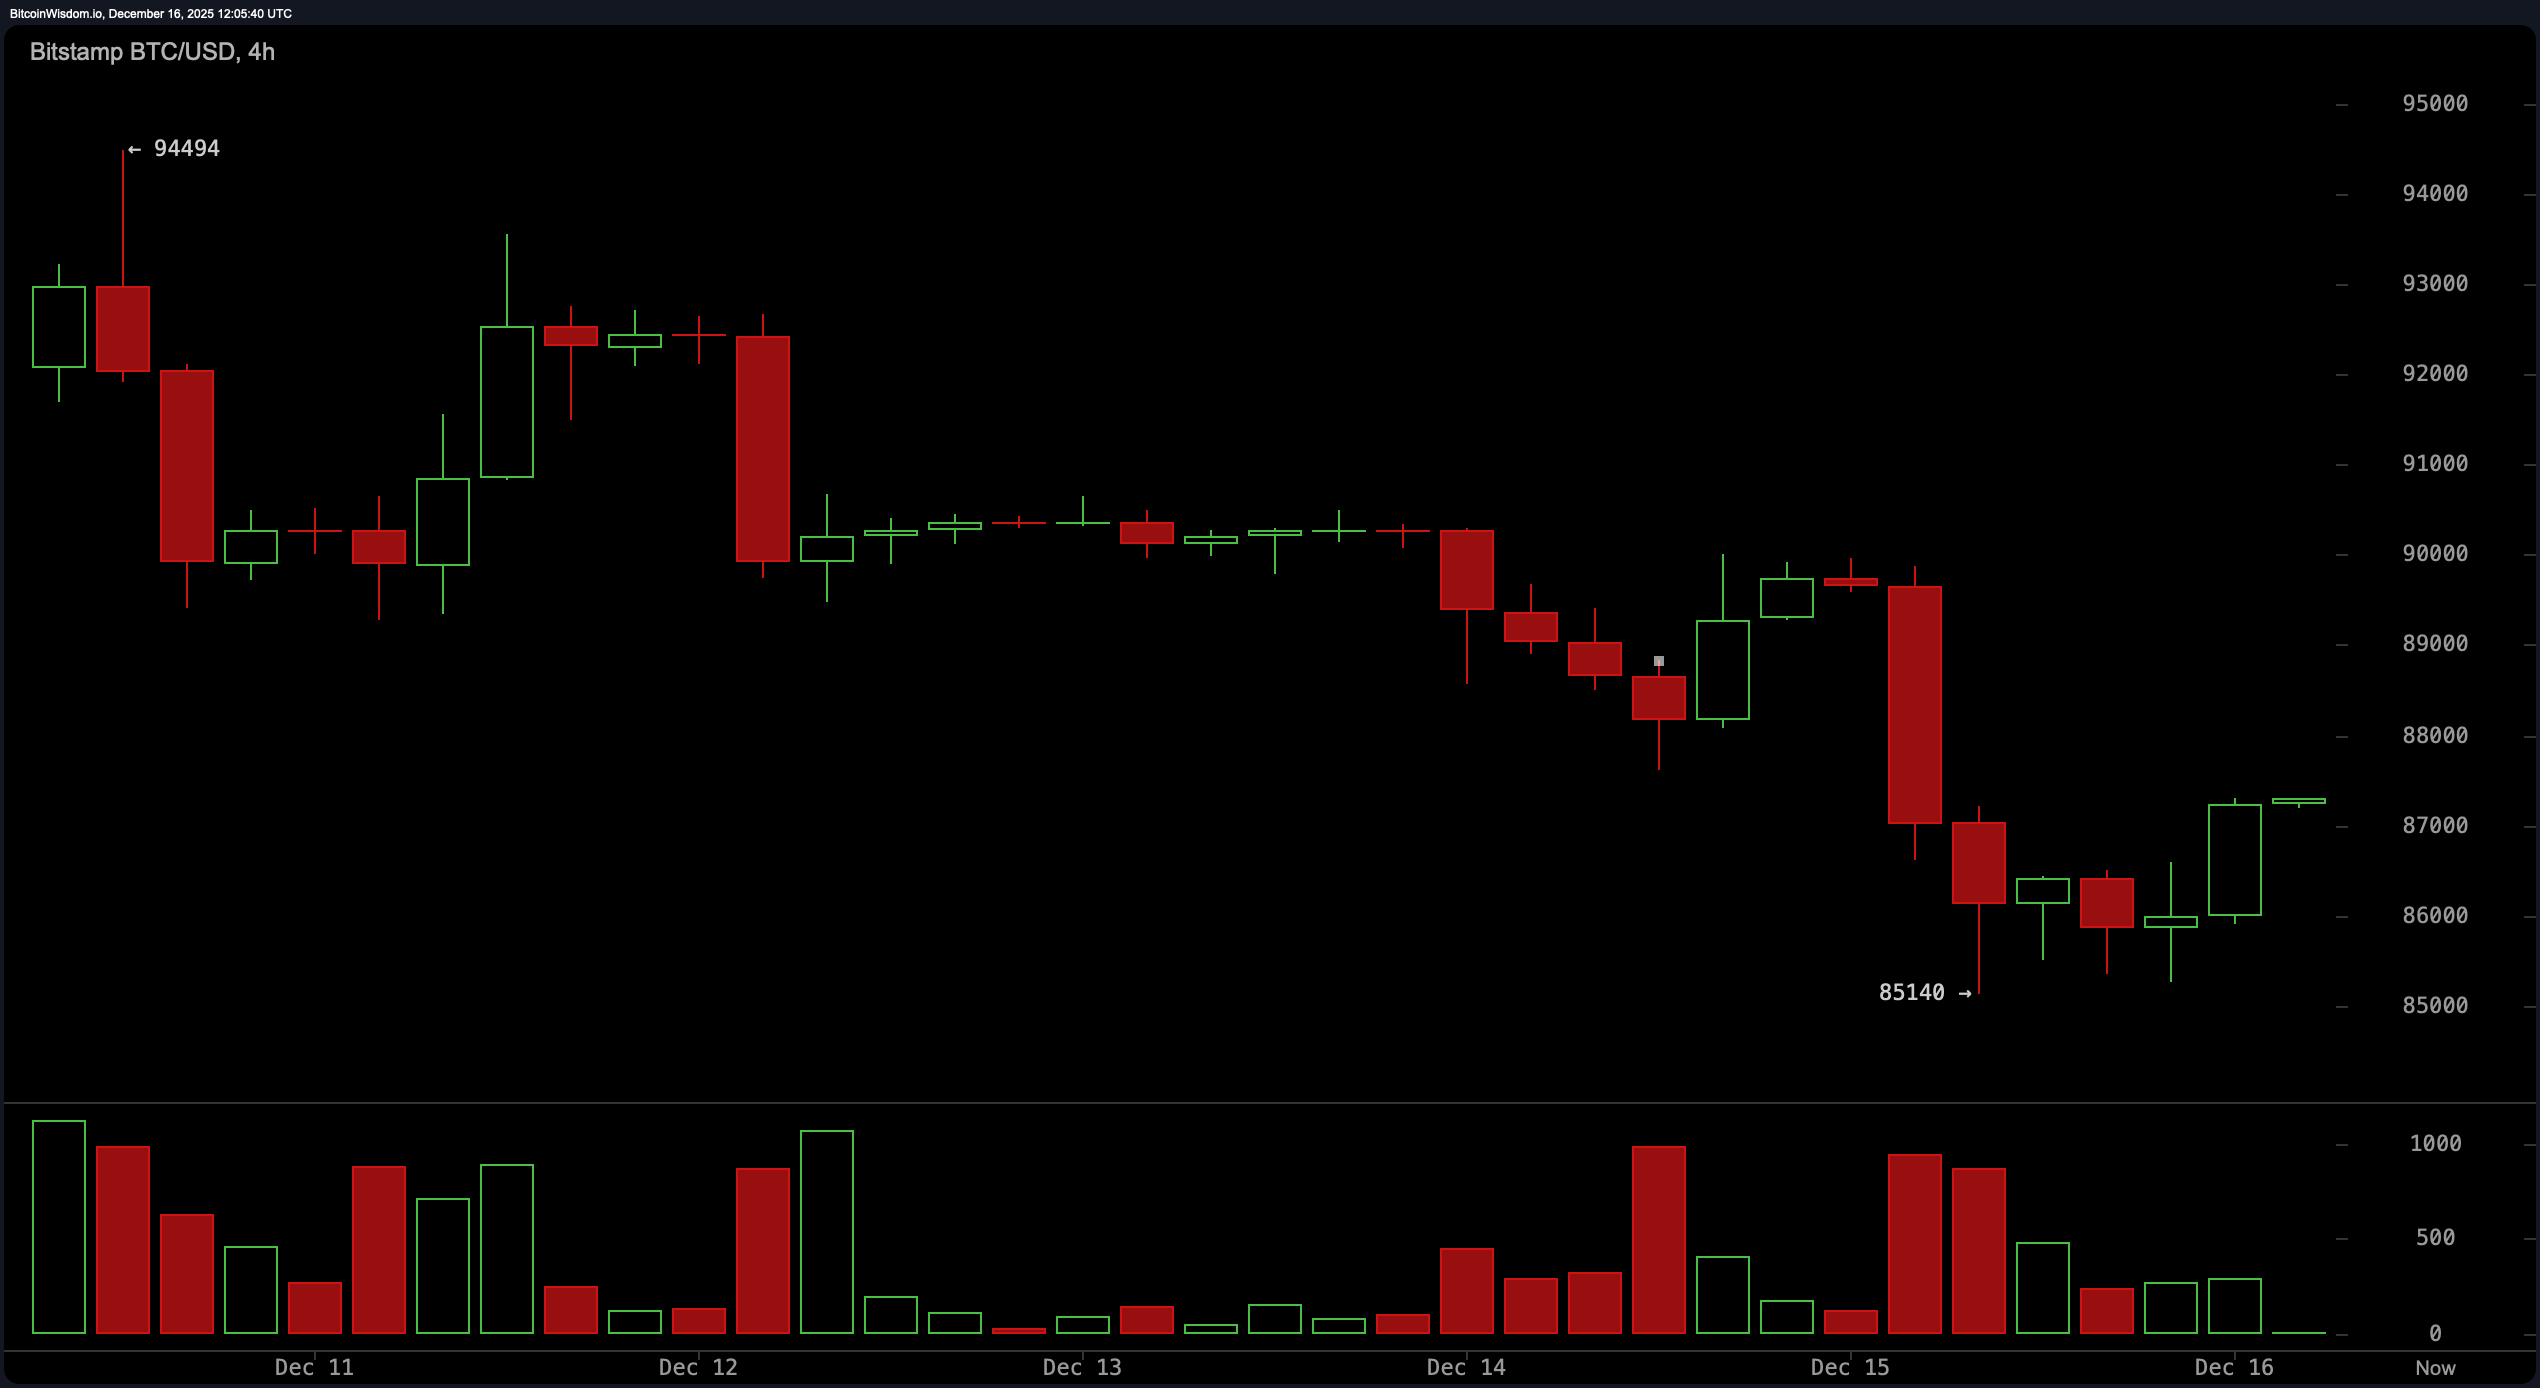
Zooming out to the four-hour chart, bitcoin staged a modest rebound from the $85,000 region, nudging up toward $87,500 to $88,000. But let’s not pop the champagne just yet. Resistance between $88,000 and $89,000 looms large, and sellers are expected to reappear like clockwork. Volume dynamics show a prior capitulation sell-off, followed by this low-energy bounce—classic signs of a market digesting a downtrend rather than reversing it. Should price falter below $86,000 again, more downside could be in store.
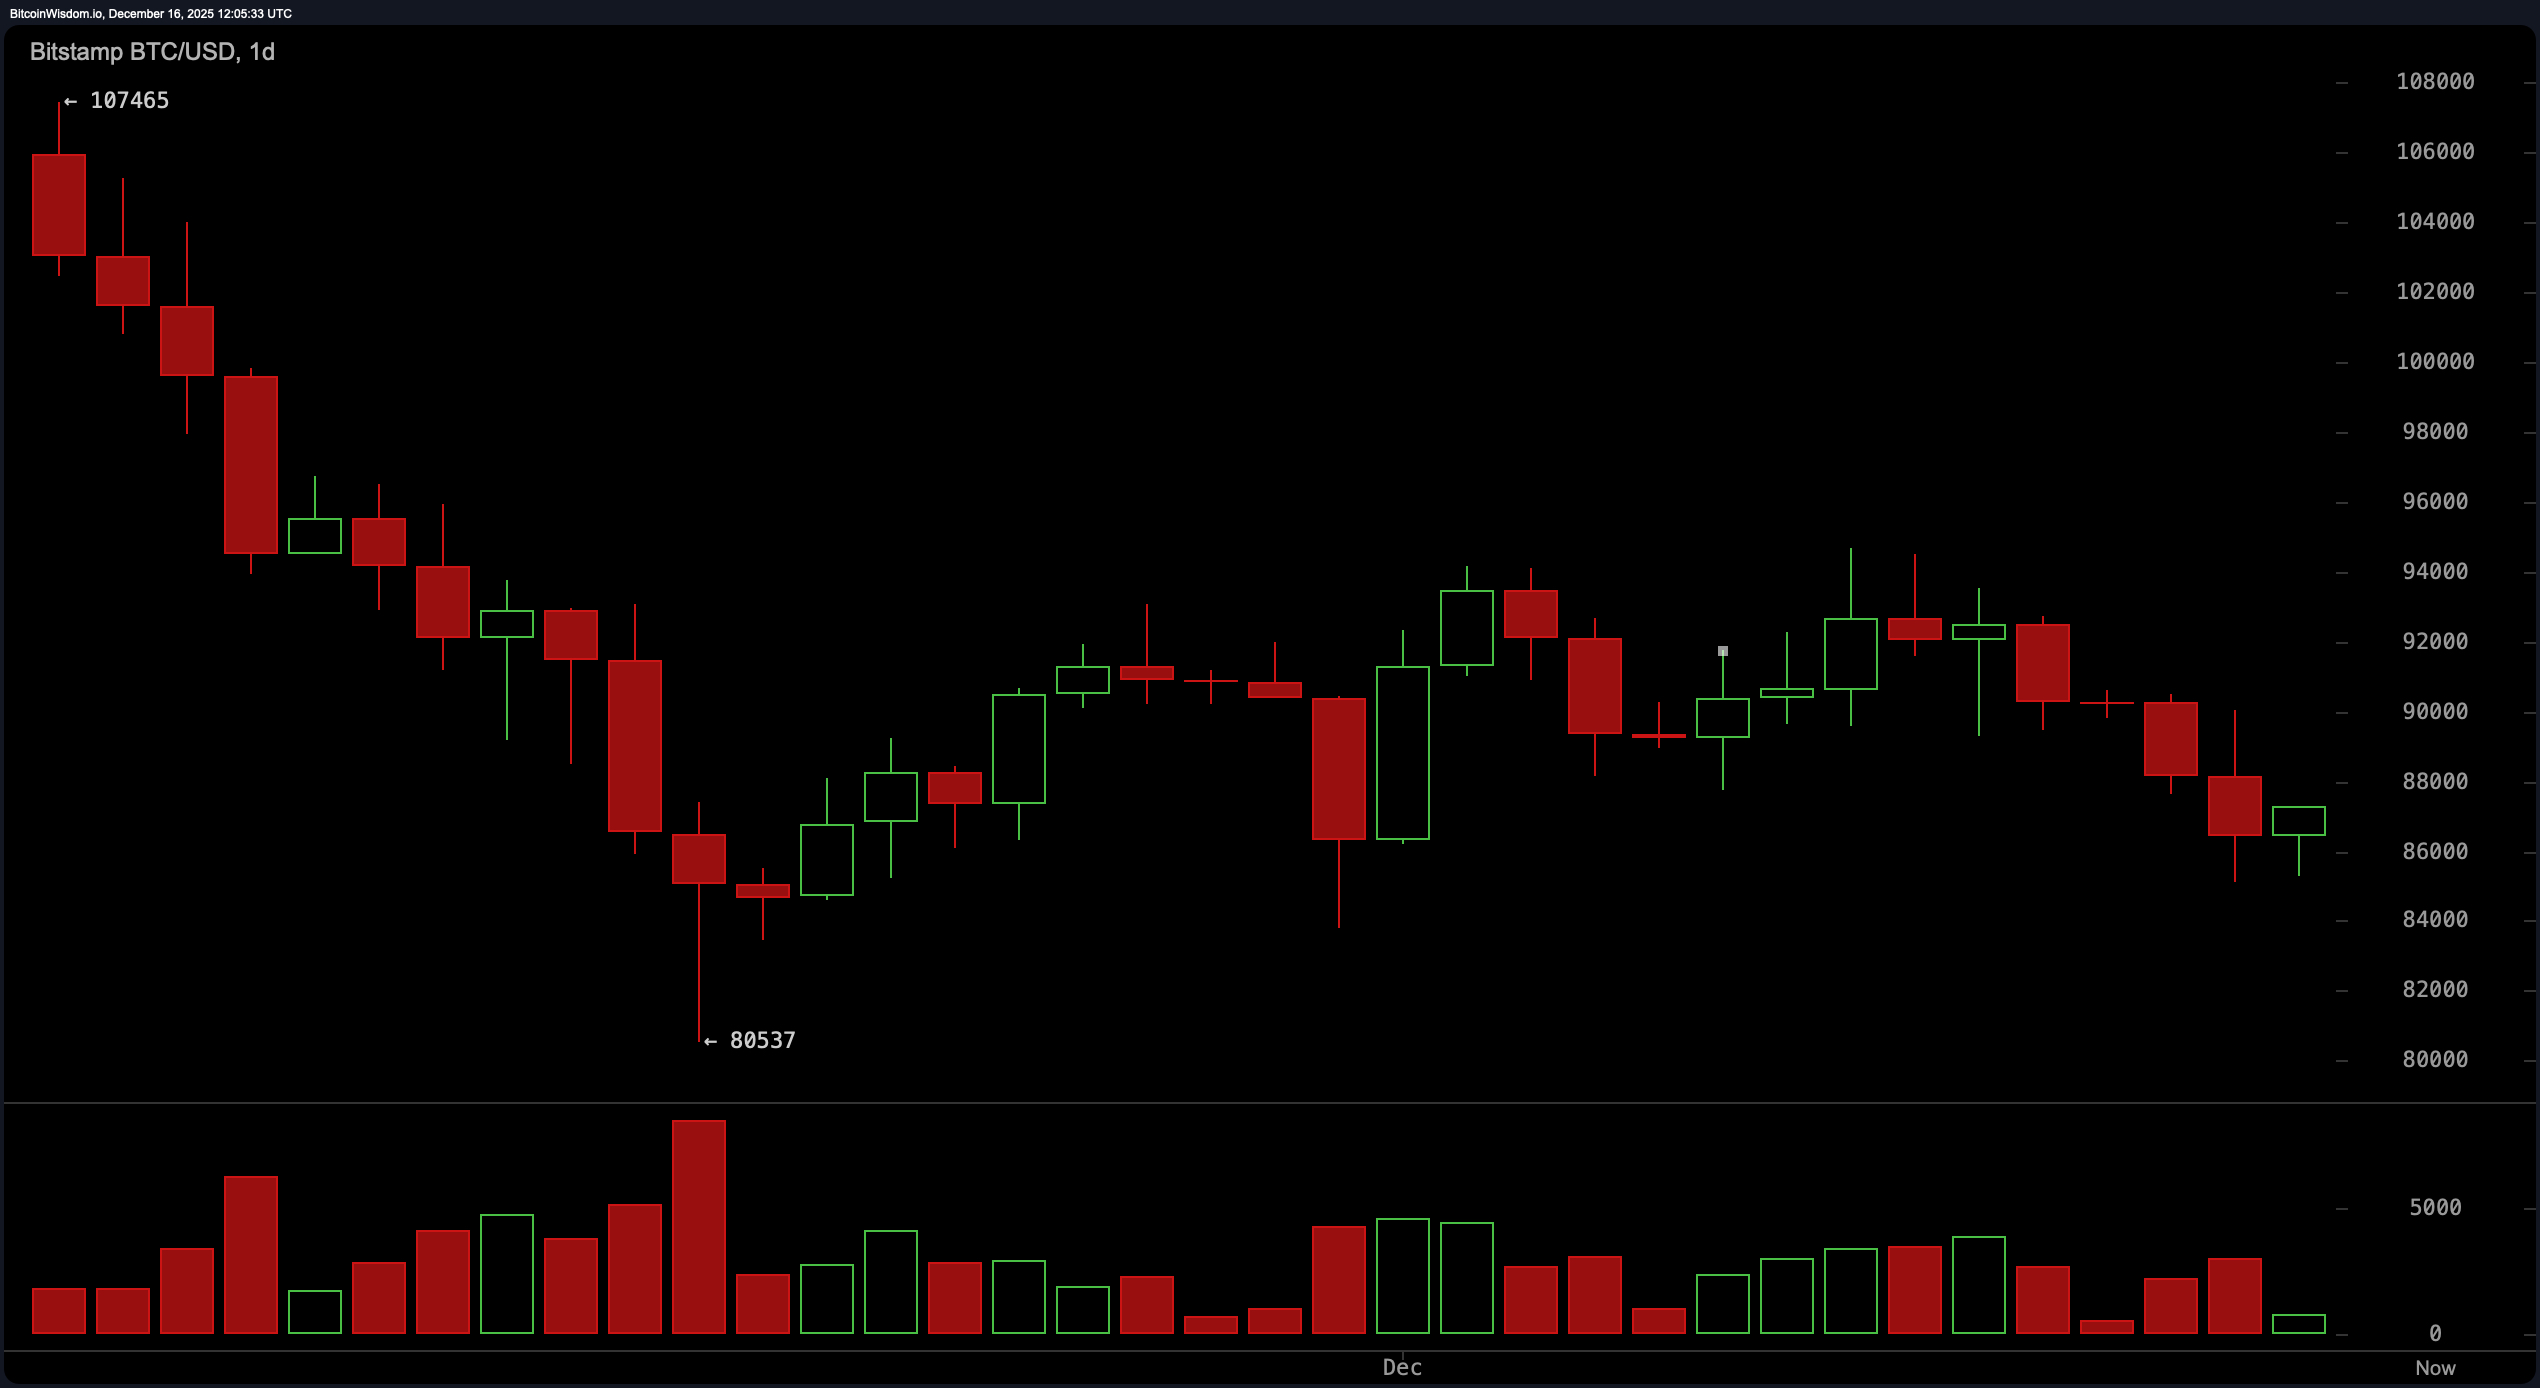
On the daily timeframe, the chart reveals a macro downtrend from around $107,000 to near $80,000. While a relief rally did surface, it’s behaving more like a paper tiger than a bullish turnaround. The recent green candles? Light on volume, heavy on wishful thinking. Key support lies at $80,500, and resistance stands firm at the $94,000–$95,000 band. No strong reversal signals are evident, and unless bitcoin stages a convincing daily close above $94,000 with robust volume, expect sideways or lower.
Oscillators offer a mixed cocktail of confusion. The relative strength index (RSI) stands at 40, the stochastic oscillator sits at 25, and the commodity channel index (CCI) clocks in at −177—all signaling neutral momentum. The average directional index (ADX) also registers a neutral 27. The awesome oscillator reads −1,705, and momentum is at −1,989, while the moving average convergence divergence (MACD) level stands at −1,696—both tilting cautiously bullish, albeit in the context of broader weakness.
As for moving averages, not a single one is offering support. The exponential moving averages (EMAs) and simple moving averages (SMAs) from 10 to 200 periods are all perched above current prices, waving bearish flags in unison. The EMA (10) sits at $89,272, and the SMA (10) at $90,069, while the longer-term EMA (200) and SMA (200) hover around $102,872 and $108,389, respectively. These averages are clearly not here to help, making it evident that the dominant trend remains tilted toward the bears.
Bottom line: Bitcoin is attempting to shake off the dust, but until it breaks above the $94,000 resistance level with conviction, this bounce could be little more than market theatrics. Caution is warranted, and those watching this market would be wise to avoid chasing shadows in a volatile zone still ruled by uncertainty.
Bull Verdict:
If bitcoin manages to close above $94,000 with strong volume on the daily chart, the tide could begin to turn. Such a move would invalidate the bear flag, reclaim key moving averages, and potentially open the gates to a push beyond $100,000 in the mid-term. Momentum and MACD indicators are already hinting at early strength—now it’s up to price action to confirm the narrative.
Bear Verdict:
Should bitcoin fail to hold above $86,000 or lose the $85,000 support level, the bearish continuation becomes more than likely. The broader downtrend remains intact, moving averages are stacked overhead like a ceiling of lead, and weak volume confirms a lack of buyer conviction. In this scenario, a retest of $80,500—or even lower—is not only possible, but probable.
FAQ 🐻
- Where is bitcoin trading now? Bitcoin is currently priced at $87,263 with a market cap of $1.74 trillion.
- What’s the short-term bitcoin trend?Charts indicate a bearish trend with weak recovery momentum.
- What are critical price levels to watch?Support is near $85,000; resistance stands around $94,000.
- Is this a good time to enter the bitcoin market?The market remains uncertain, with technical signals offering mixed direction.