
Bitcoin’s price is currently parked at $89,417 with a market cap standing at $1.78 trillion. Over the last 24 hours, it’s swung between $88,929.64 and $90,469, with a trading volume clocking in at $35.66 billion—so yes, it’s still the life of the liquidity party, even if the dance floor’s gotten a little tense. Just like yesterday’s technical analysis, BTC is in consolidation mode, but bears are clawing relentlessly and look like they may take the upper hand if things don’t change.
Bitcoin Chart Outlook
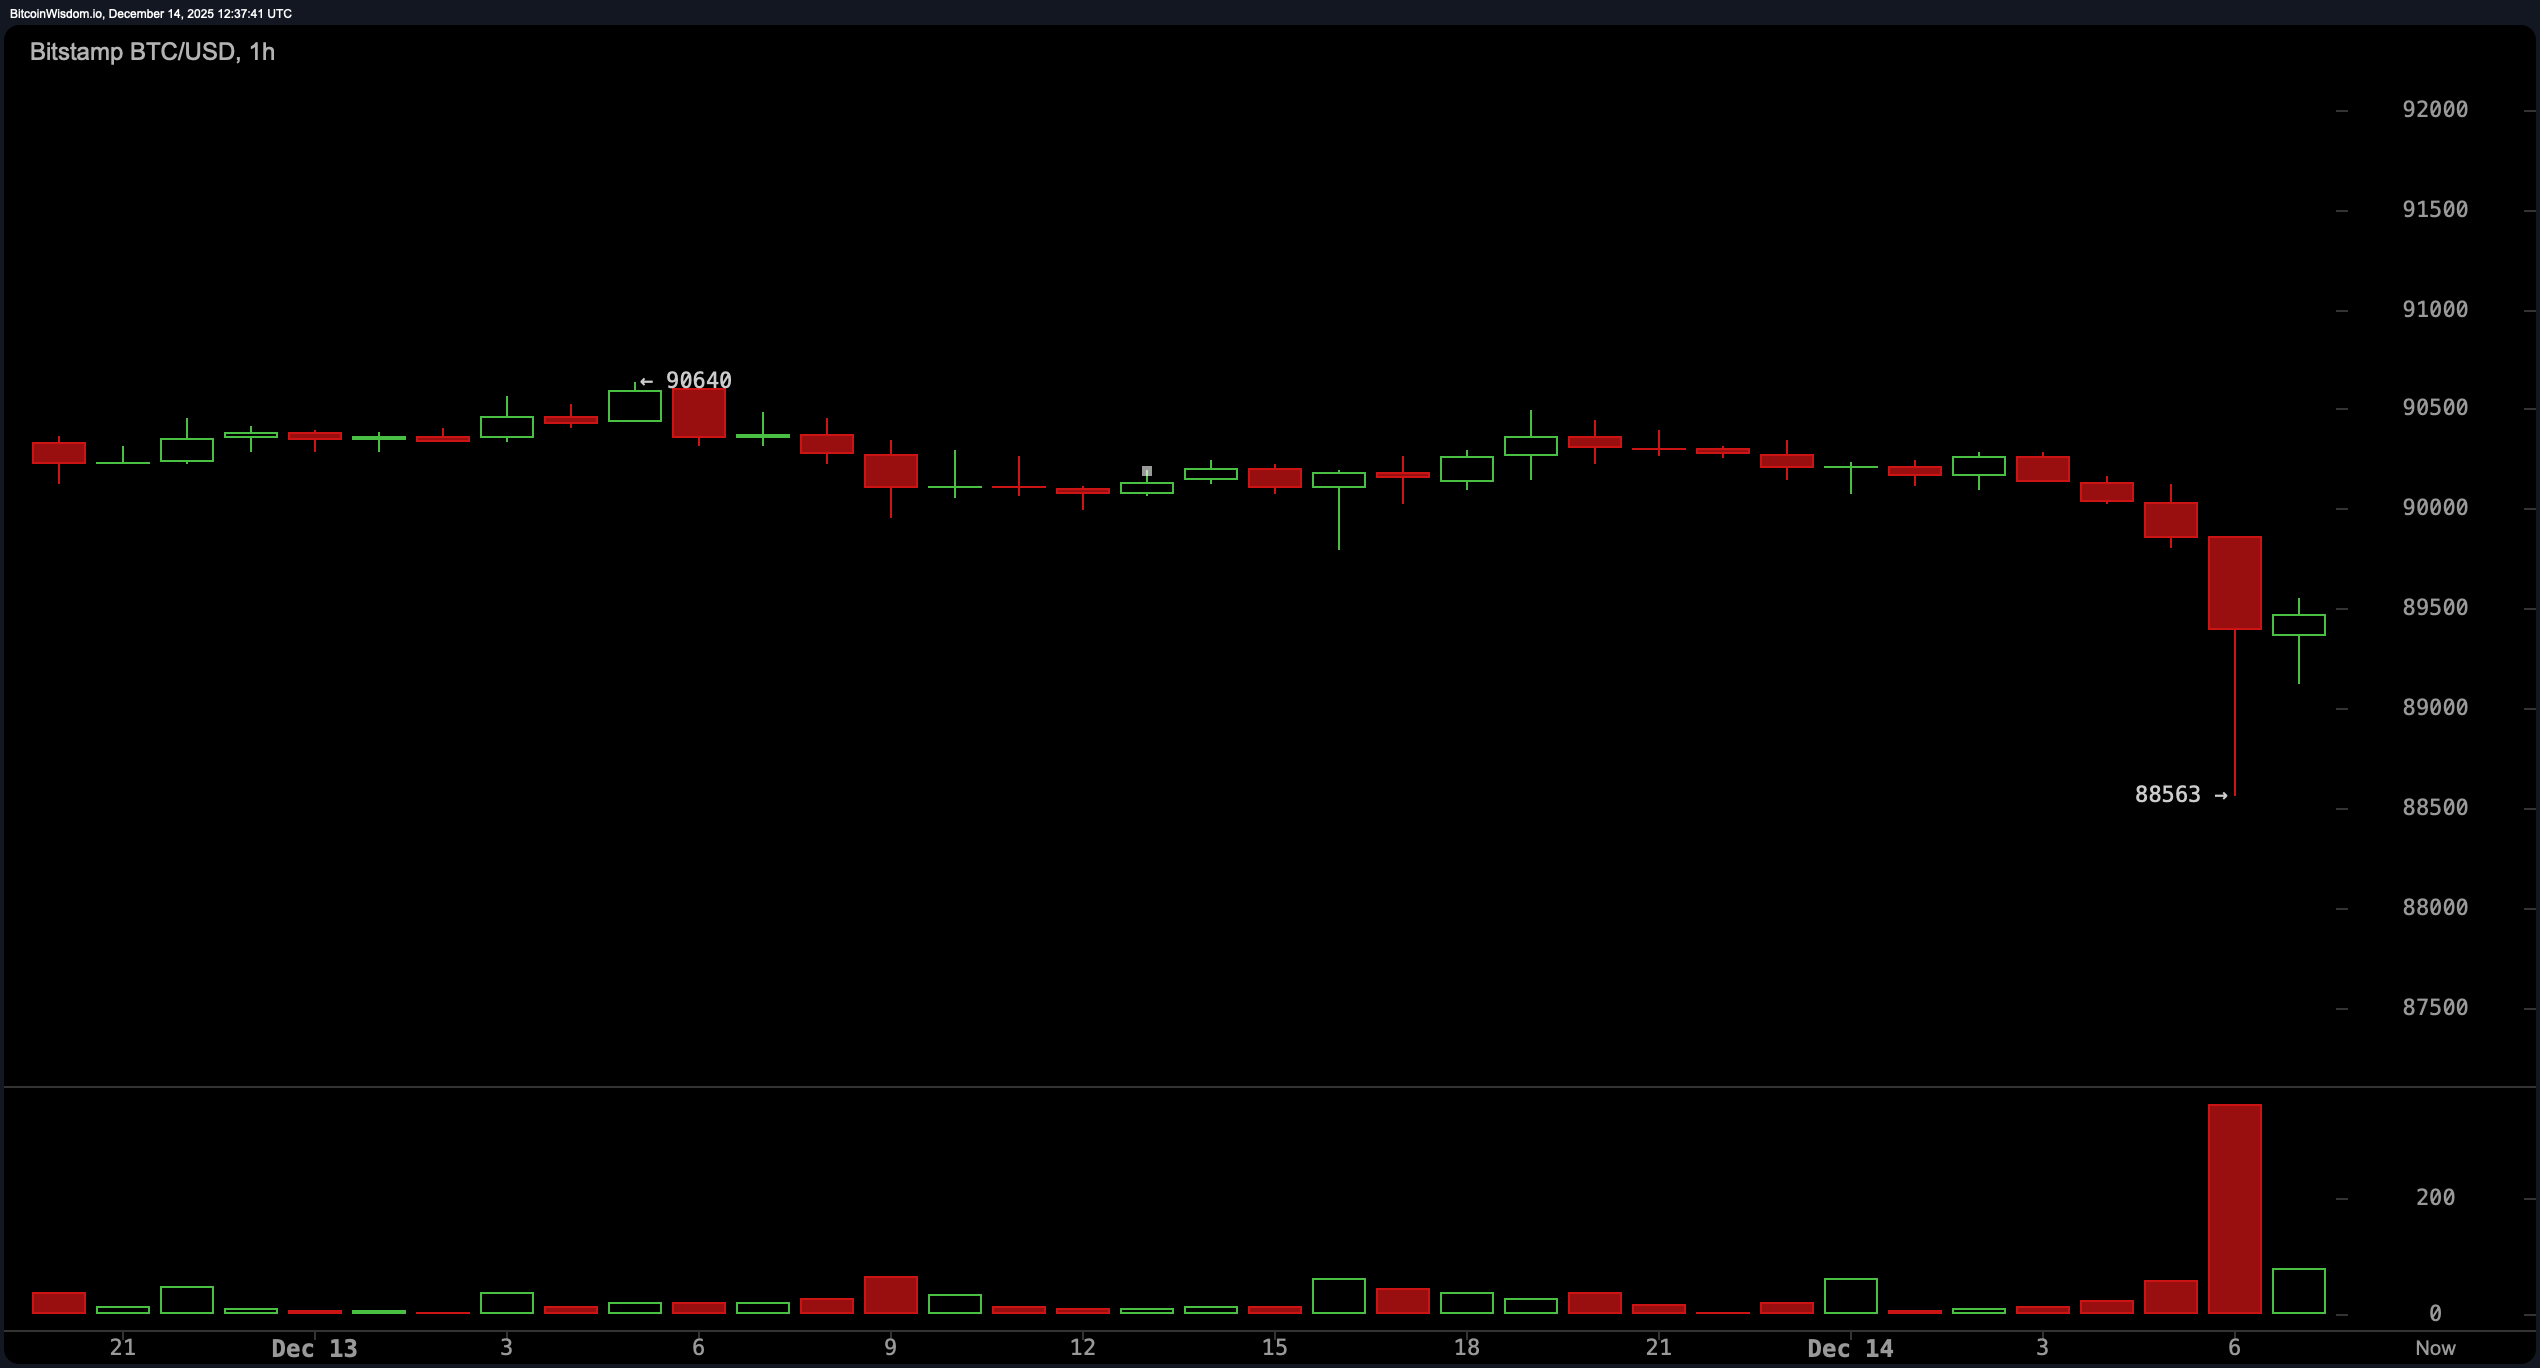
Price action is holding a precarious pose just under the $90,000 mark after what can only be described as a dramatic breakdown from consolidation. Bitcoin‘s hourly chart tells the story of a sharp drop from around $90,600 to $88,500, punctuated by volume spikes hinting at panic or, more likely, liquidation-driven capitulation.
Short-term support is being tested around $88,500–$89,000, with some cautious buying peeking through—but don’t break out the confetti just yet. The move lacked conviction beyond a short-lived bounce.
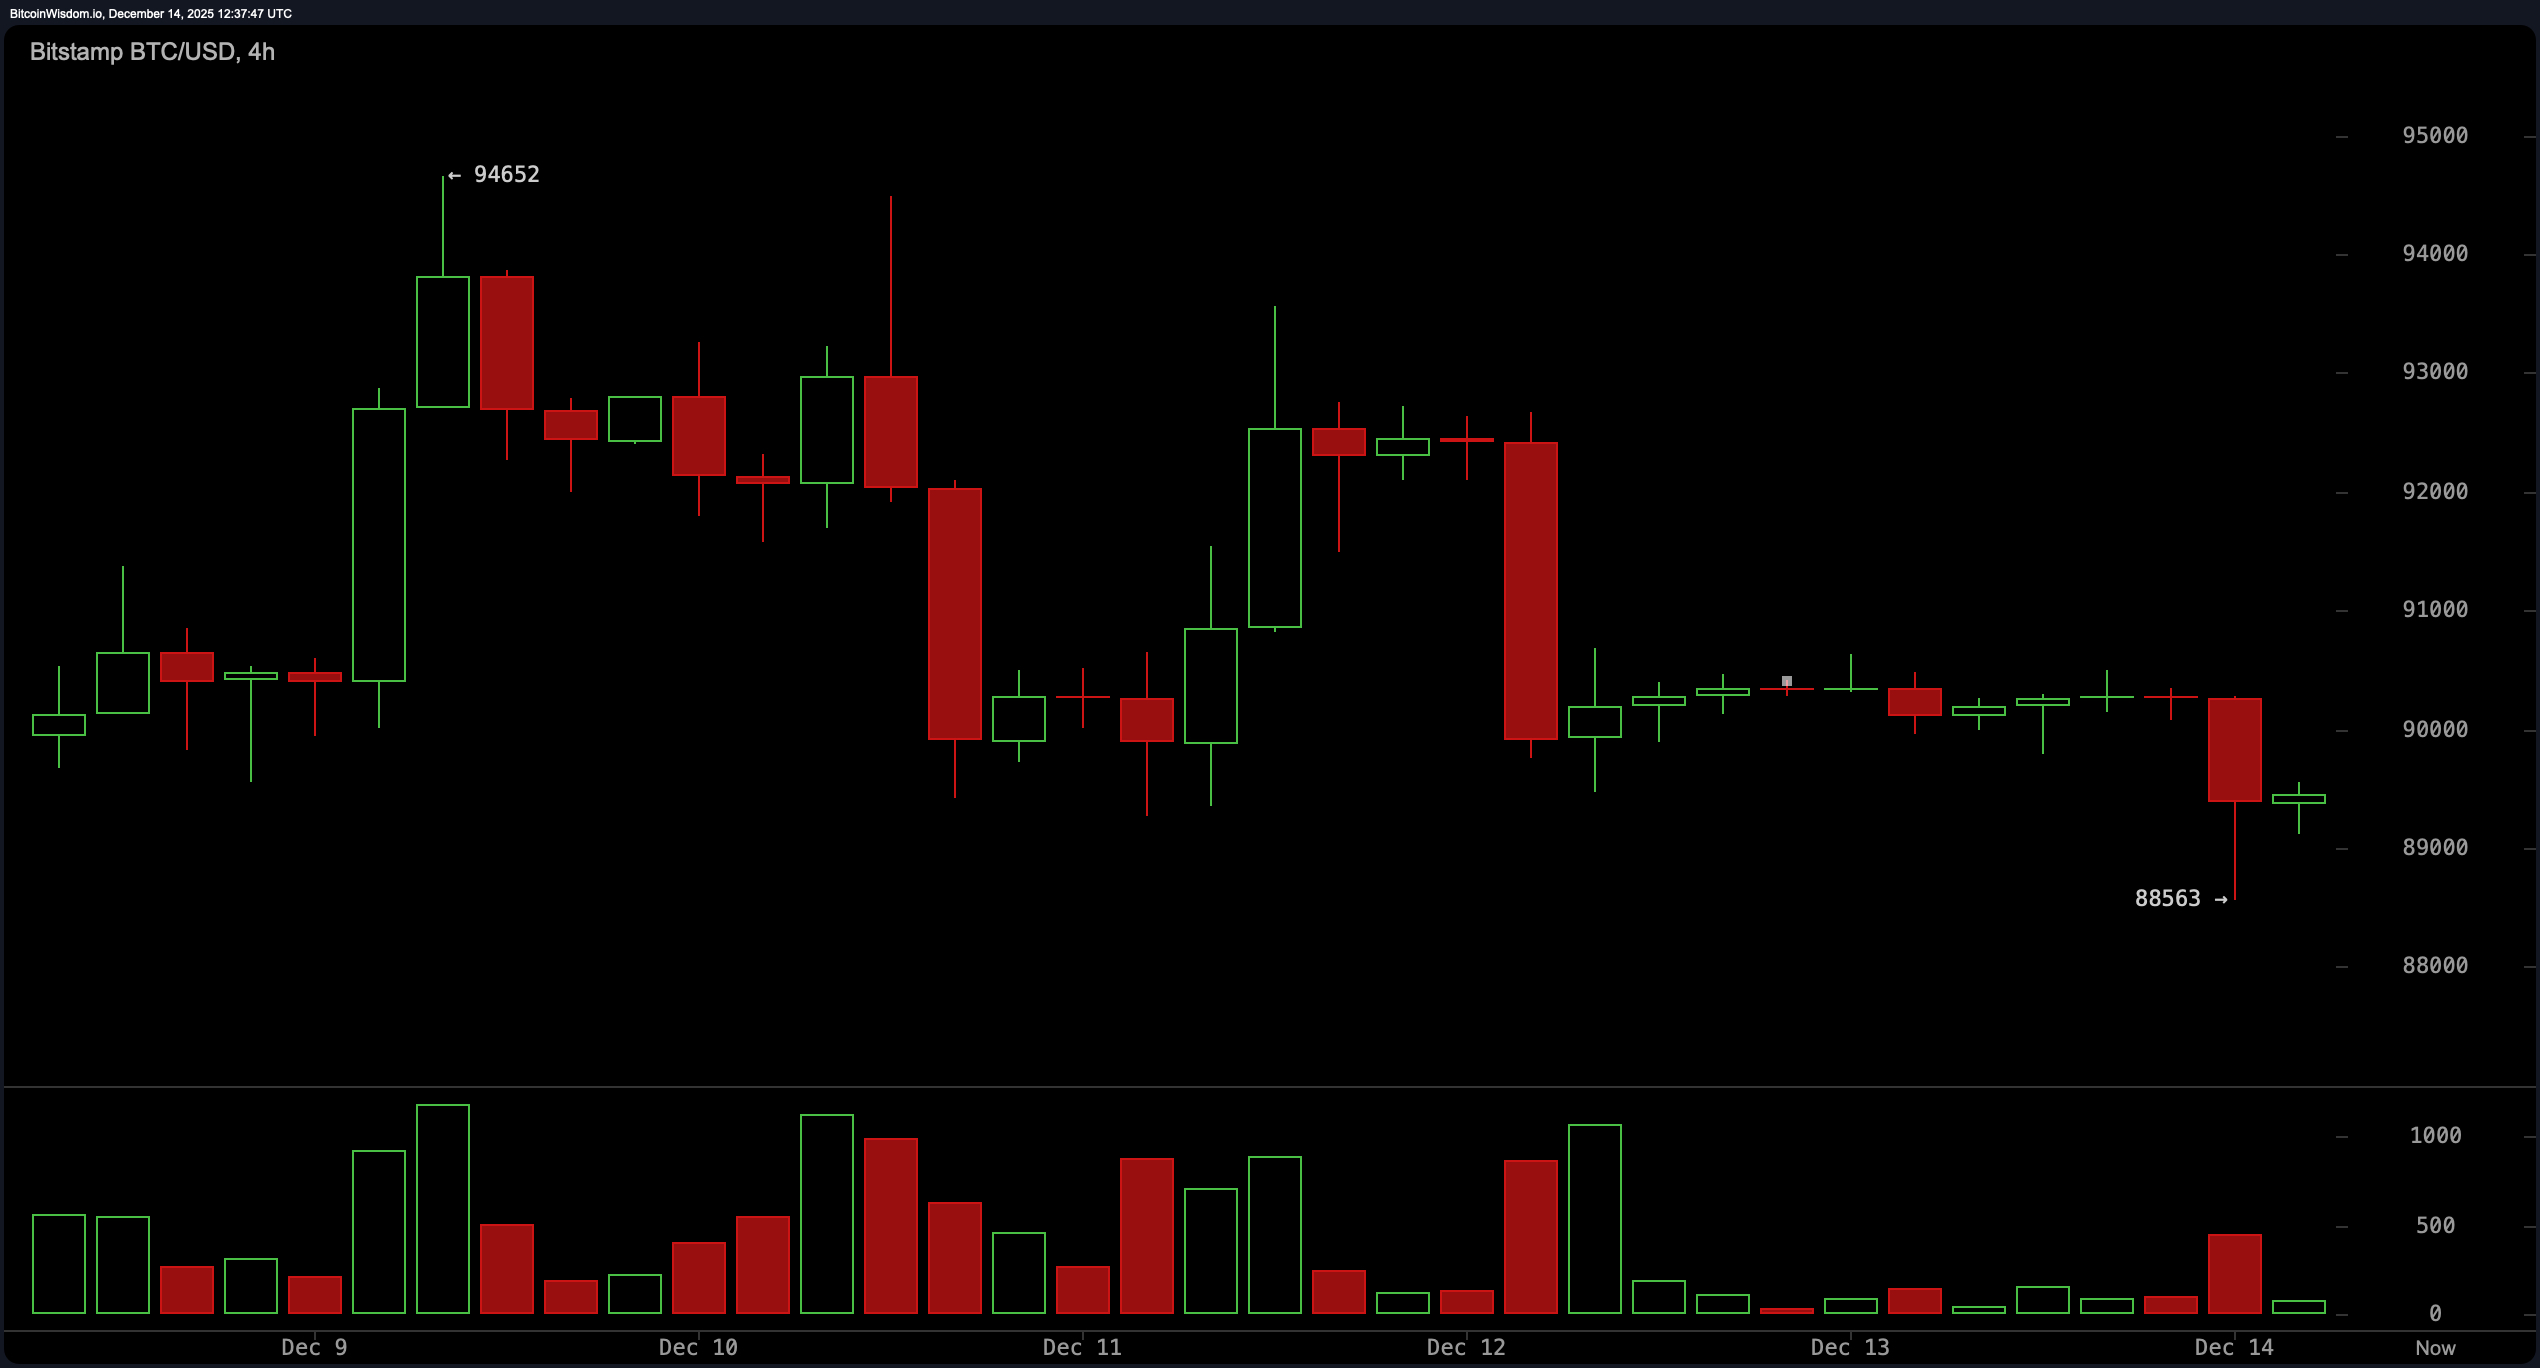
Zooming out to the 4-hour chart, we’re seeing the aftershocks of a bearish breakdown from sideways movement. A large red candle followed by a tentative green one is the classic signature of a market unsure whether to cry or rally. Support held at $88,563 with a mild bounce, but price is still loitering in the $89,000–$90,000 zone. That minor resistance around $90,600 now looms large, like a bouncer at the door, keeping bullish sentiment out unless accompanied by volume and a proper bullish formation.
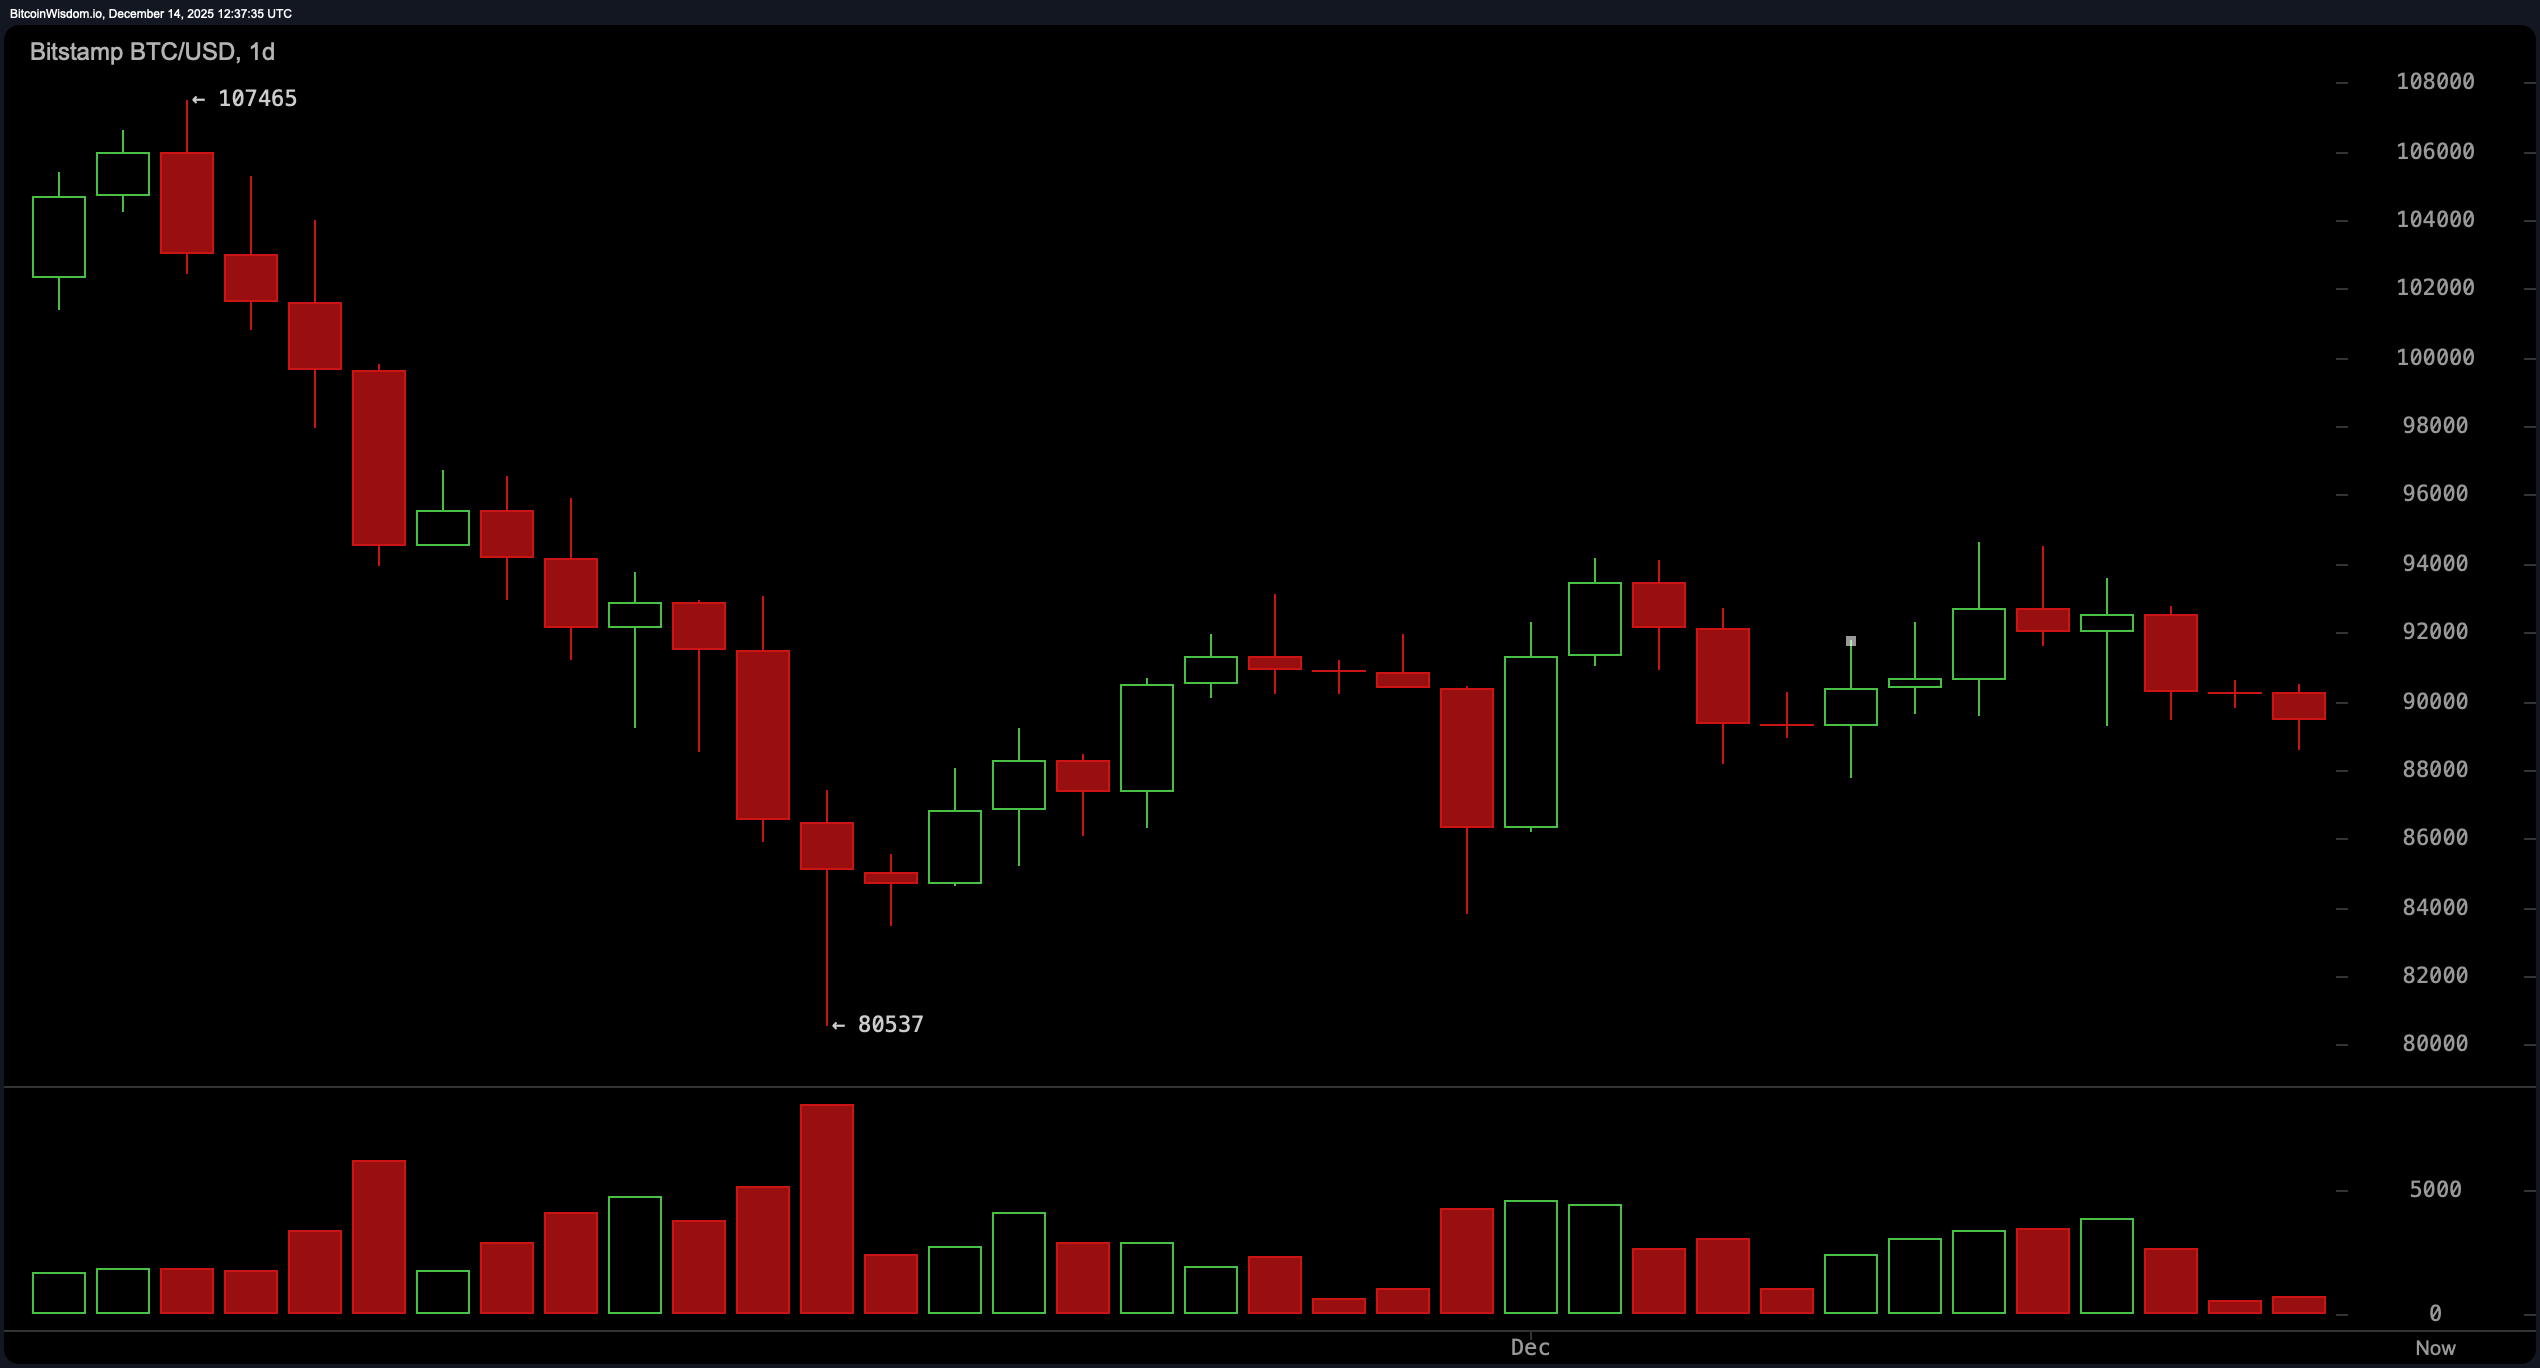
The daily chart continues to write a bearish novella. After peaking near $107,465, bitcoin has been on a slow descent, with attempts to scale $94,000–$95,000 consistently swatted away. A recent bounce off the $80,537 level was met with a massive volume surge—possibly signaling dip buying, or maybe just exhausted bears covering positions. Either way, bitcoin is now stuck under that familiar resistance band, consolidating with a whiff of selling pressure and a clear need for stronger momentum to reverse course.
Now let’s talk indicators, because the mood swings don’t stop at price action. Oscillators are channeling their inner Switzerland—neutral across the board. The relative strength index (RSI) is sitting at 43, the Stochastic oscillator is at 57, and the commodity channel index (CCI) has dipped to −55. The average directional index (ADX) is parked at 26, indicating a weak trend. The Awesome oscillator is negative at −509, leaning bearish, but the momentum indicator at −2,643 and the MACD level (moving average convergence divergence) at −1,274 are quietly starting to show divergence from pure pessimism, hinting that someone, somewhere, might still have faith.
Moving averages? Not feeling the optimism. Every single one—from the 10-period exponential moving average (EMA) at $90,690 to the 200-period simple moving average (SMA) lounging up at $108,575—is flashing red. This full suite of bearish signals across short, mid, and long-term moving averages doesn’t paint a picture of strength. Unless bitcoin makes a decisive reclaim of $90,600 and holds it with volume, the bears will remain in charge of the narrative.
In sum, bitcoin’s latest act features price consolidation in the $89,000–$90,000 range, oscillators playing it safe, and moving averages flat-out unimpressed. A move above $90,600 could shift the script, while a stumble below $88,500 may have us dusting off the $80,500–$82,000 support zone. Buckle up—the next 48 hours may be more thrilling than a DeFi hack on launch day.
Bull Verdict:
If bitcoin manages to reclaim and sustain above the $90,600 resistance with convincing volume, the path toward the $94,000–$95,000 region reopens. Buyers appear to be circling under $89,000, and if momentum aligns, this could evolve into a recovery leg targeting upper resistance levels.
Bear Verdict:
Failure to regain the $90,600 mark leaves the door wide open for a retest of the $88,500 support—or worse, a slide toward the $80,500–$82,000 zone. With moving averages leaning bearish and momentum still underwhelming, the downside risk remains tangible.
FAQ ❓
- What is bitcoin’s current price on December 14, 2025? Bitcoin is trading at $89,417 today.
- Is bitcoin bullish or bearish right now? Bitcoin is showing a neutral to bearish trend across multiple timeframes.
- What support and resistance levels are critical for bitcoin now?Key support is near $88,500 and major resistance sits around $90,600 and $94,000.
- What do technical indicators suggest for bitcoin’s next move?Indicators are mixed, with oscillators neutral and moving averages signaling continued weakness.