
Bitcoin is testing a key Fibonacci level as momentum shifts, with major resistance zones ahead.
Bitcoin currently trades for $92,415, showing mild weakness over the past day as the market digests recent volatility. The daily trading range sits between $91,029.39 and $93,577.38, reflecting a relatively tight consolidation zone compared to prior sessions. Over the past 24 hours, BTC has dipped 0.7%, signaling slight bearish pressure after repeated attempts to reclaim the $93K region.
Despite the intraday softness, Bitcoin maintains stability on higher timeframes. Specifically, the 7-day performance shows a 1.0% gain, indicating that buyers continue to defend major support areas even as momentum cools.
On a 14-day basis, BTC remains up 7.9%, highlighting sustained strength in the mid-term trend following its recovery to the $90K range. With volatility compressing and price hovering below $93K, traders are watching whether Bitcoin can stage another breakout or if consolidation will deepen in the coming sessions.
Will Bitcoin See Key Resistance Break?
Notably, Bitcoin’s daily chart shows price recovering from the recent lows near $80,559, with the rebound now testing the 0.382 Fibonacci level at $94,243, which acts as the first significant resistance in this recovery phase.
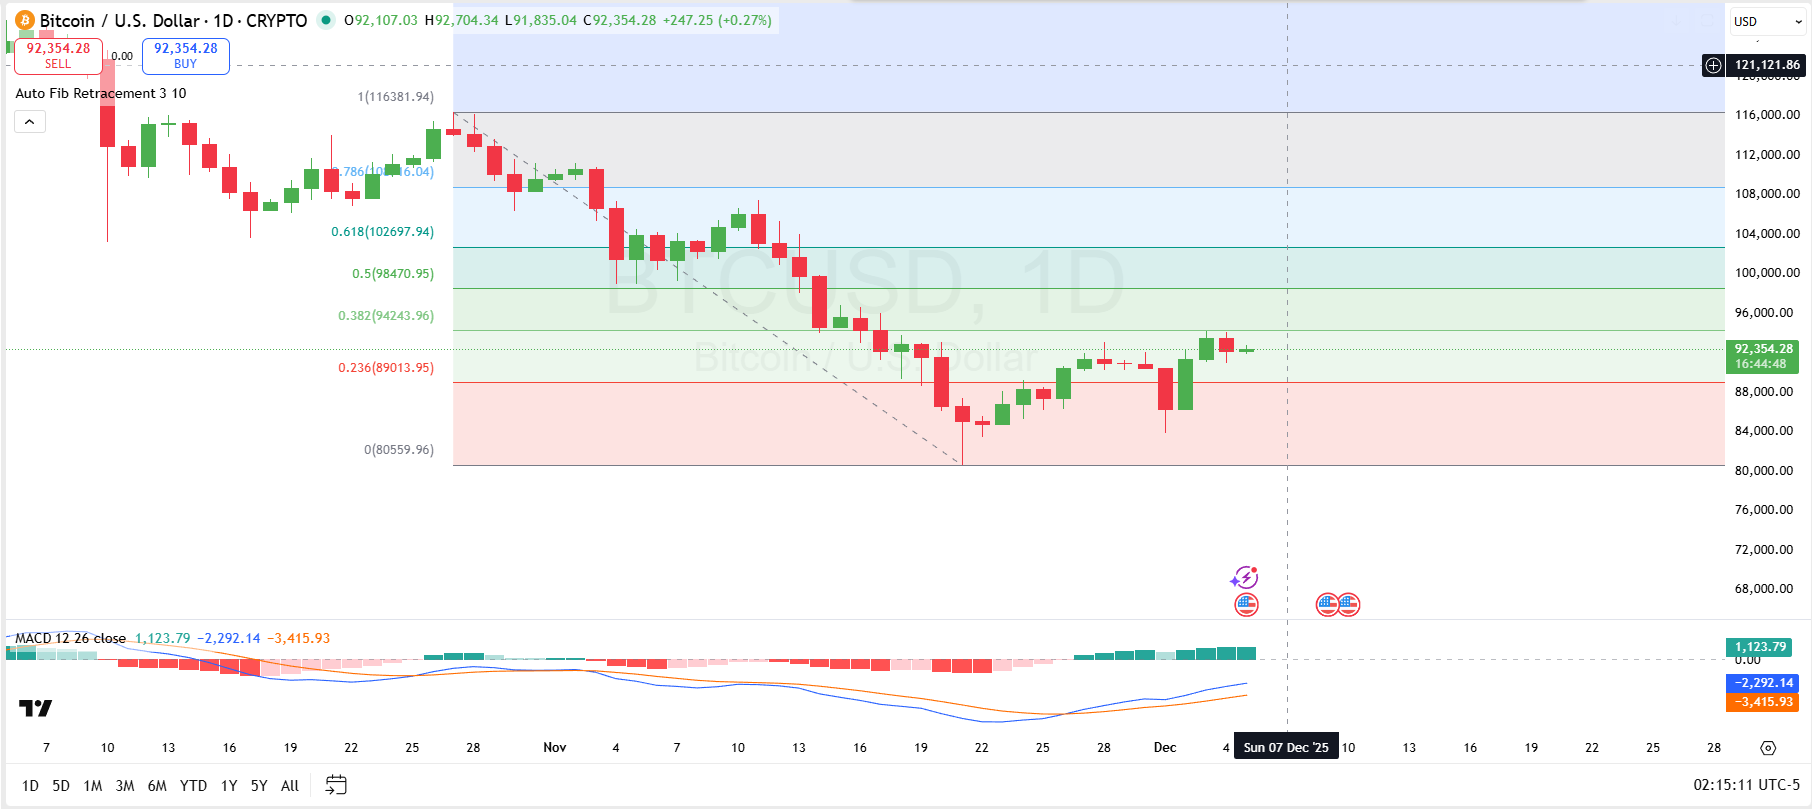
The 0.236 Fib level at $89,013 has established itself as a reliable support zone, as BTC continues to print higher lows above this region. A daily close above $94,243 would strengthen bullish momentum and open the path toward the 0.5 Fib level at $98,470, while stronger resistance lies at the 0.618 level at $102,697, a key area where sellers may attempt to regain control.
The MACD indicator reinforces the improving sentiment, showing a bullish crossover already formed as the MACD line climbs back towards positive territory. Increasing green histogram bars indicate fading bearish momentum and strengthening buyer interest after weeks of downward pressure. This shift suggests that traders are gradually rotating back into long exposure, especially as price stabilizes above short-term support.
If Bitcoin maintains support above $89,000, the next targets become $94,200, $98,400, and $102,700, aligned with the Fibonacci ladder. However, if bulls fail to hold the 0.236 level, BTC risks slipping back toward $85,000, with deeper support near $80,500, the origin of the recent bounce.
Bitcoin May Already Have Found Its Floor
Elsewhere, an analyst has called attention to Bitcoin’s Relative Strength Index (RSI), which recently dipped below 30, an oversold area. Analyst Elja states that Bitcoin’s RSI dropping below 30 has acted as a bottoming signal for some time.

He notes that the average market path shown in his chart makes it clear that periods of oversold conditions have historically been followed by strong recoveries rather than prolonged weakness. According to Elja, if this pattern repeats, Bitcoin may have already bottomed out.