


 21
21
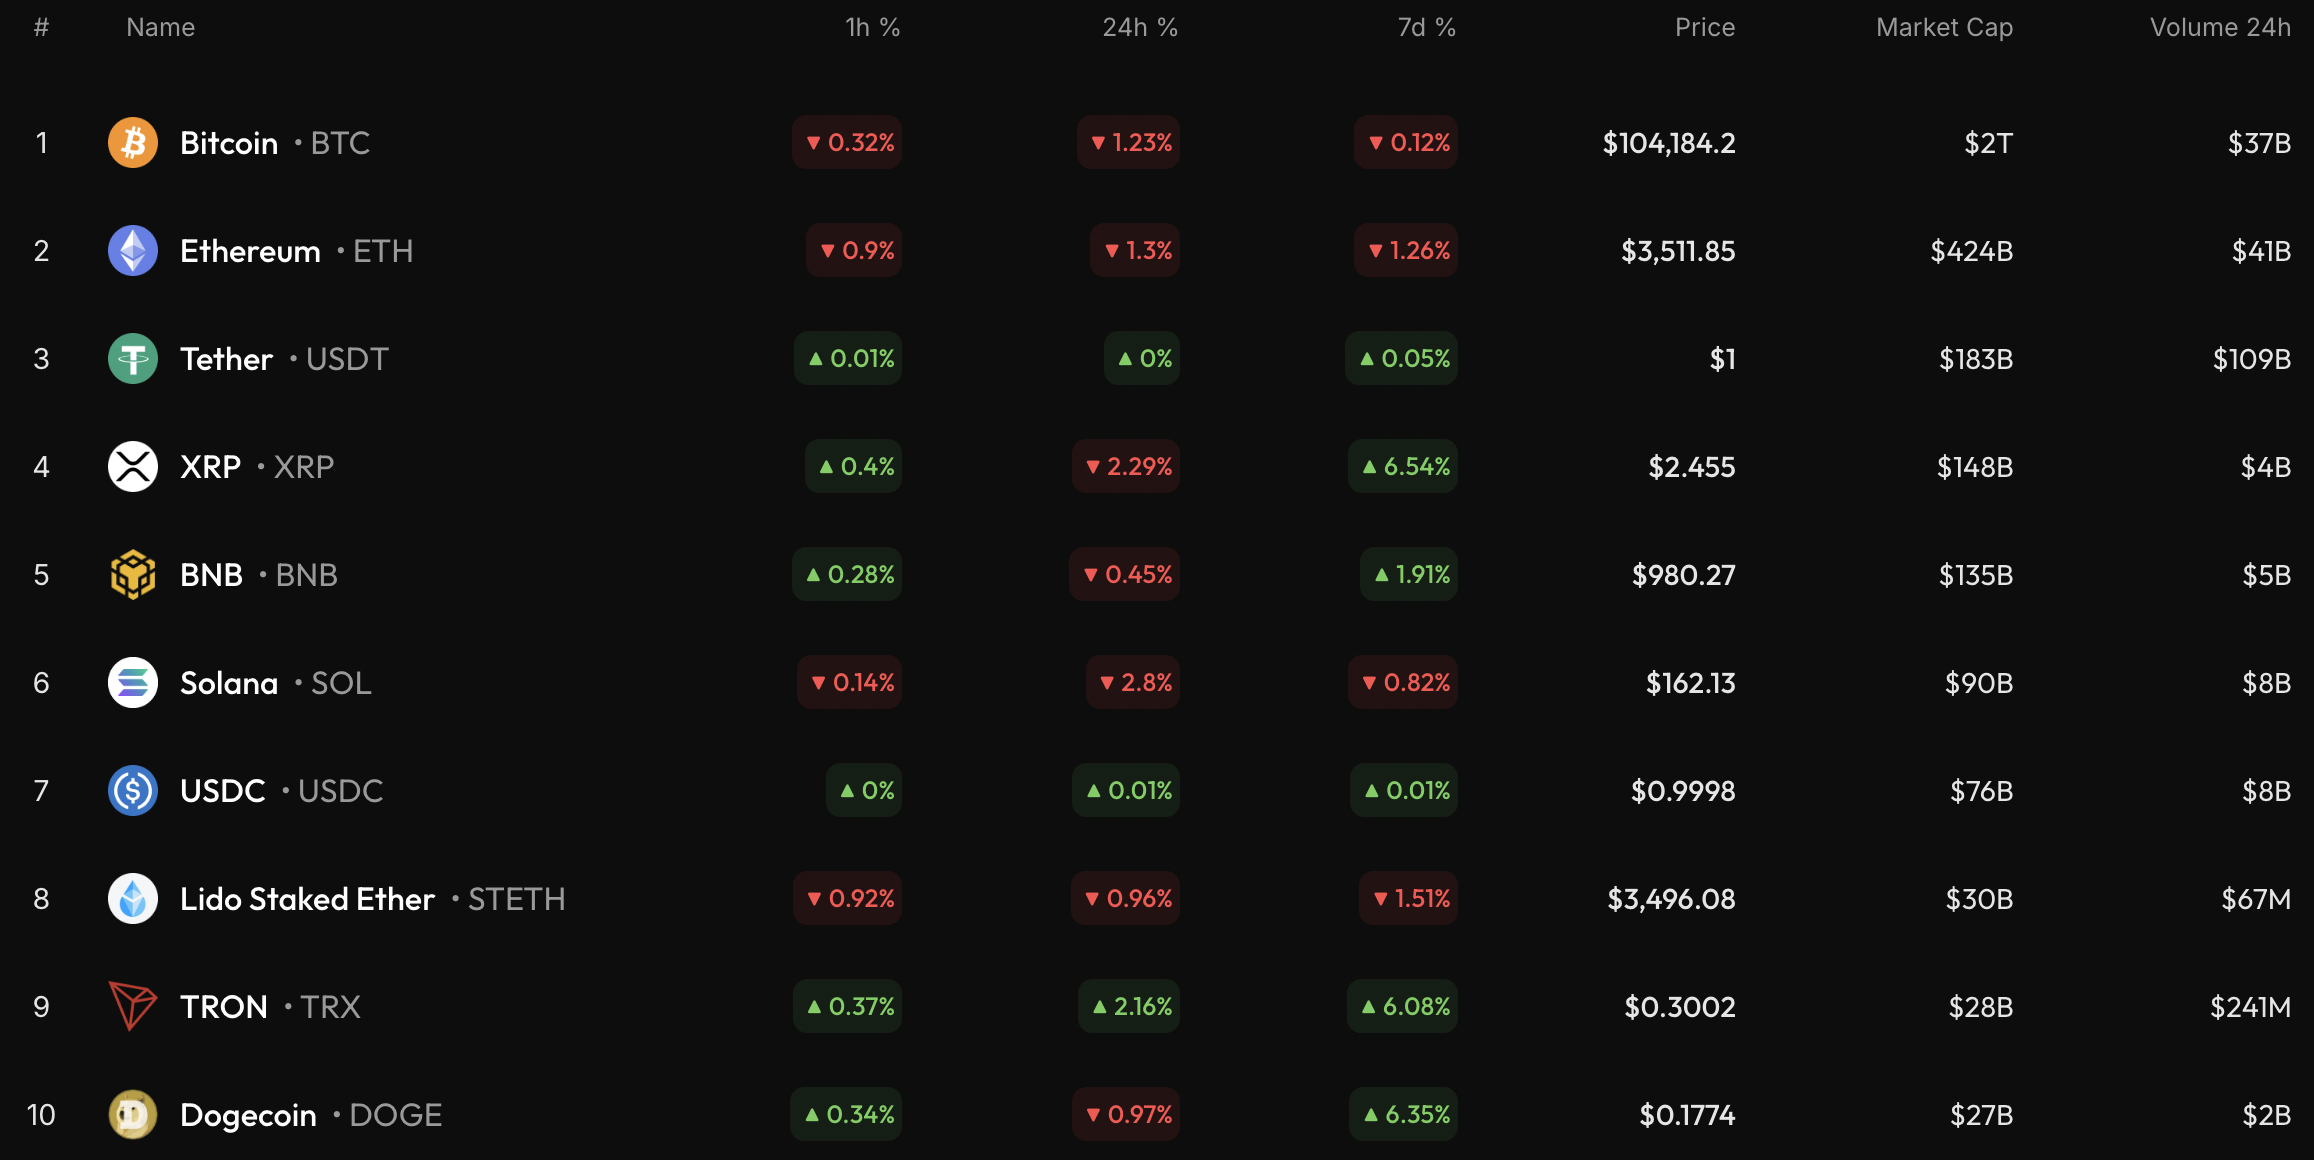
Most of the coins are in the red zone today, according to CoinStats.
BTC/USD
The price of Bitcoin (BTC) has fallen by 1.23% since yesterday.
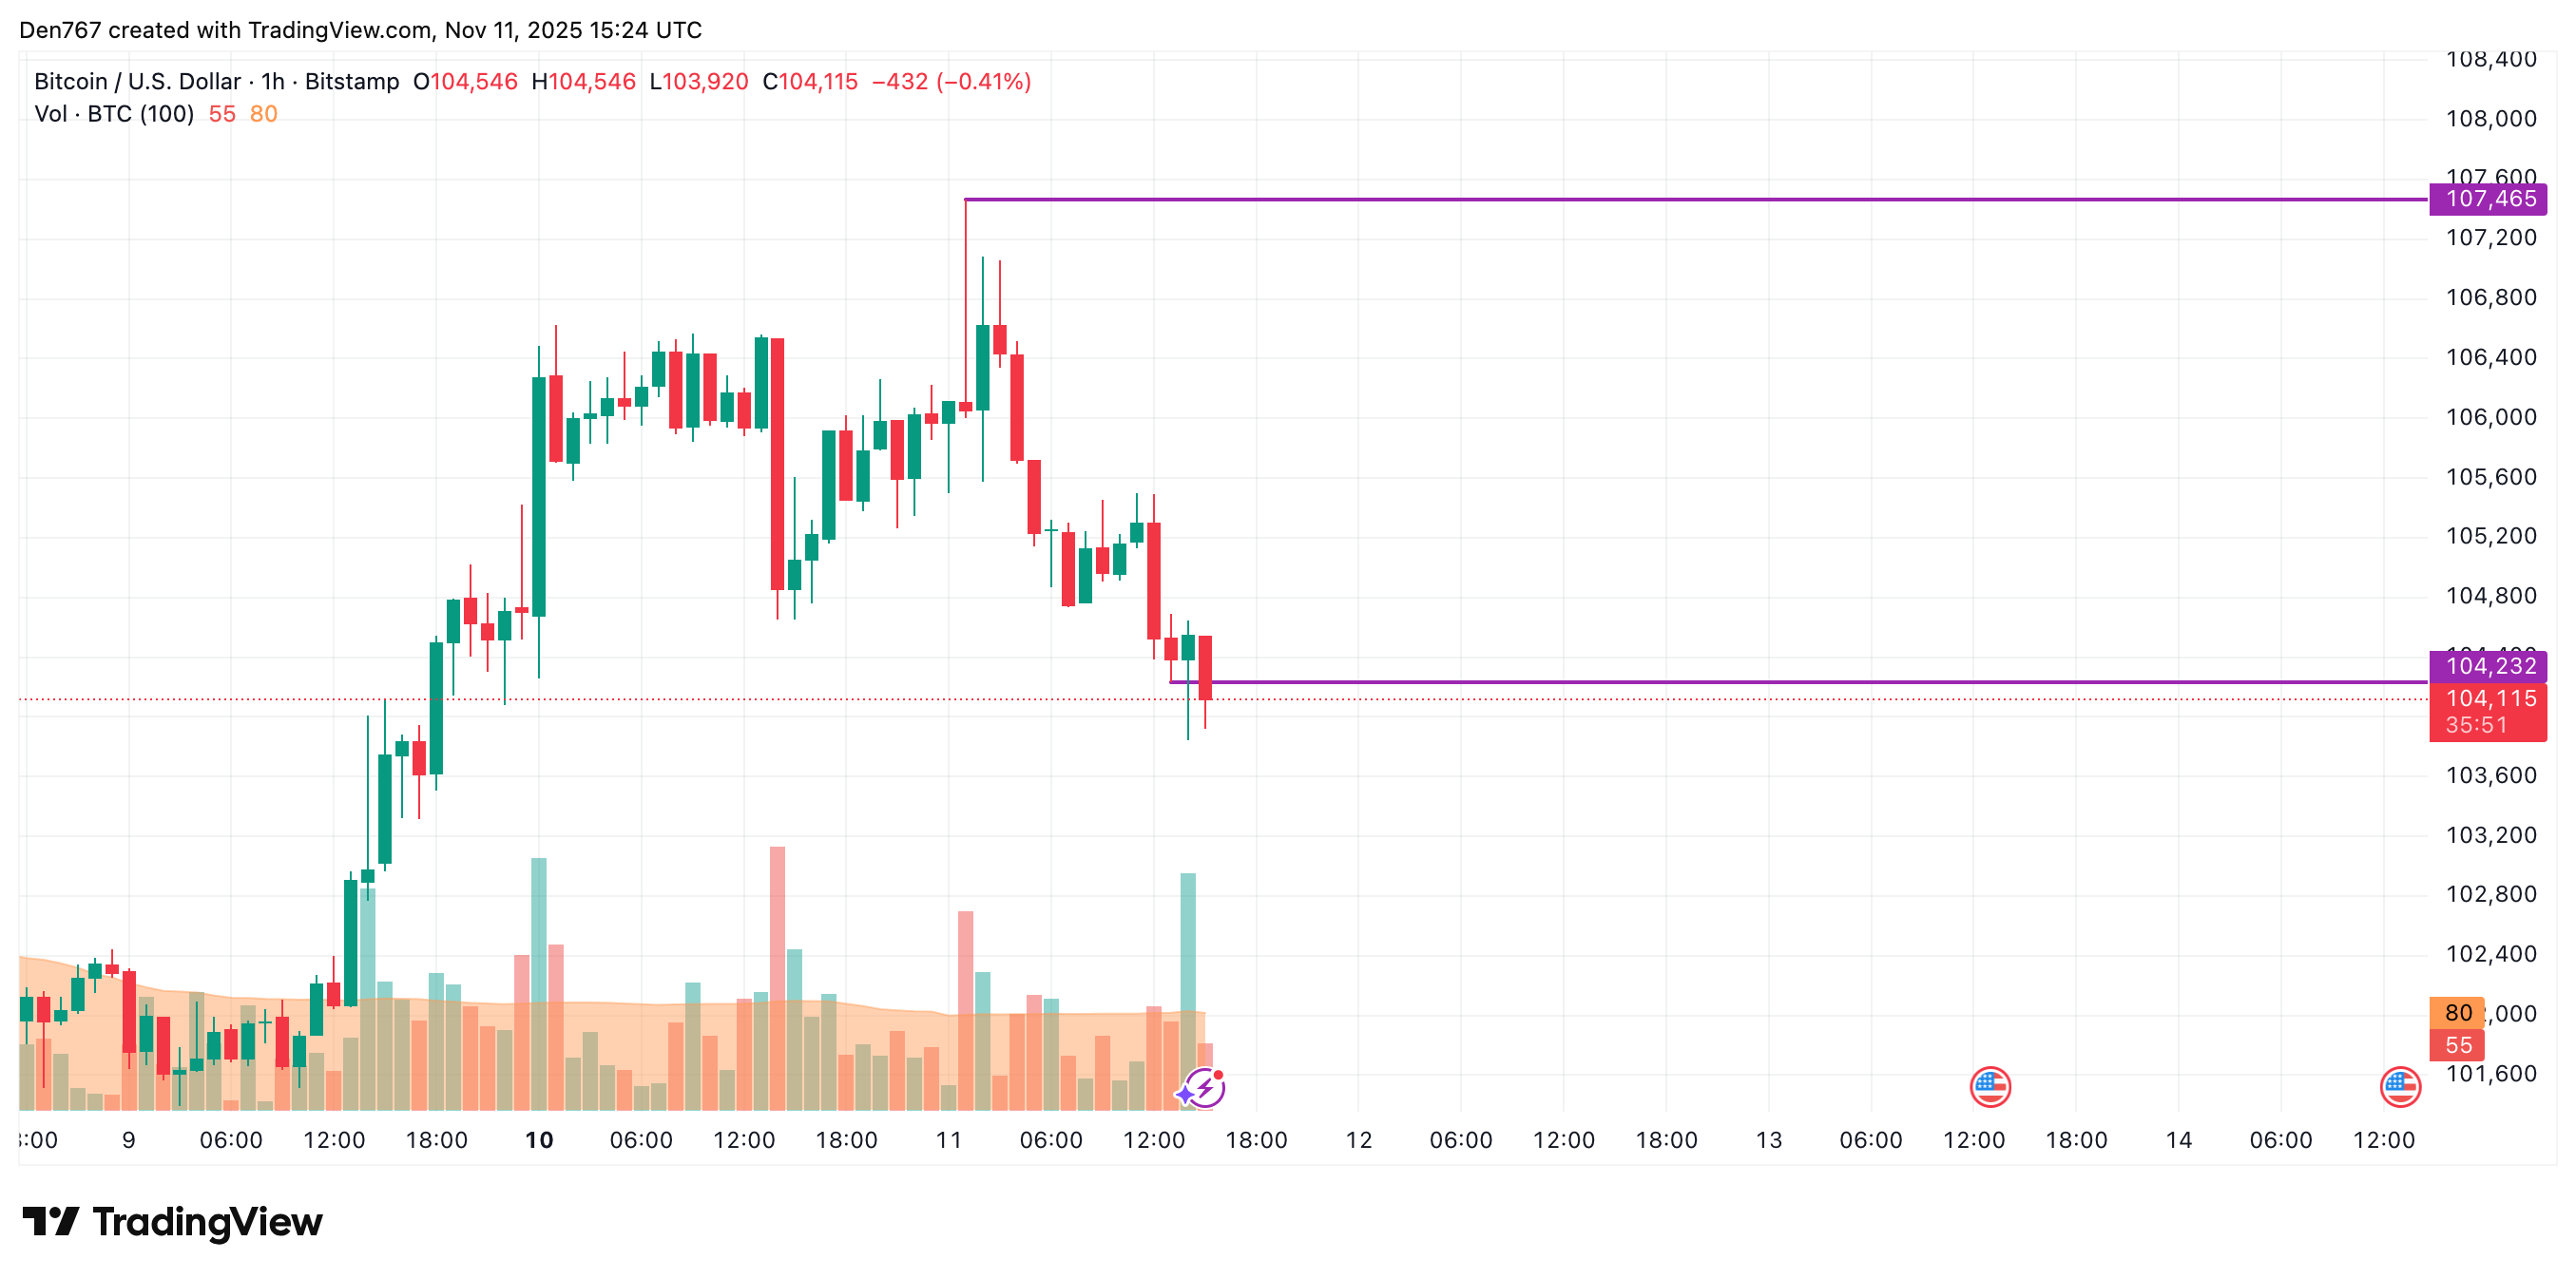
On the hourly chart, the rate of BTC is breaking the local support of $104,232. If bulls cannot seize the initiative, traders may see a further decline to the $103,000 zone.
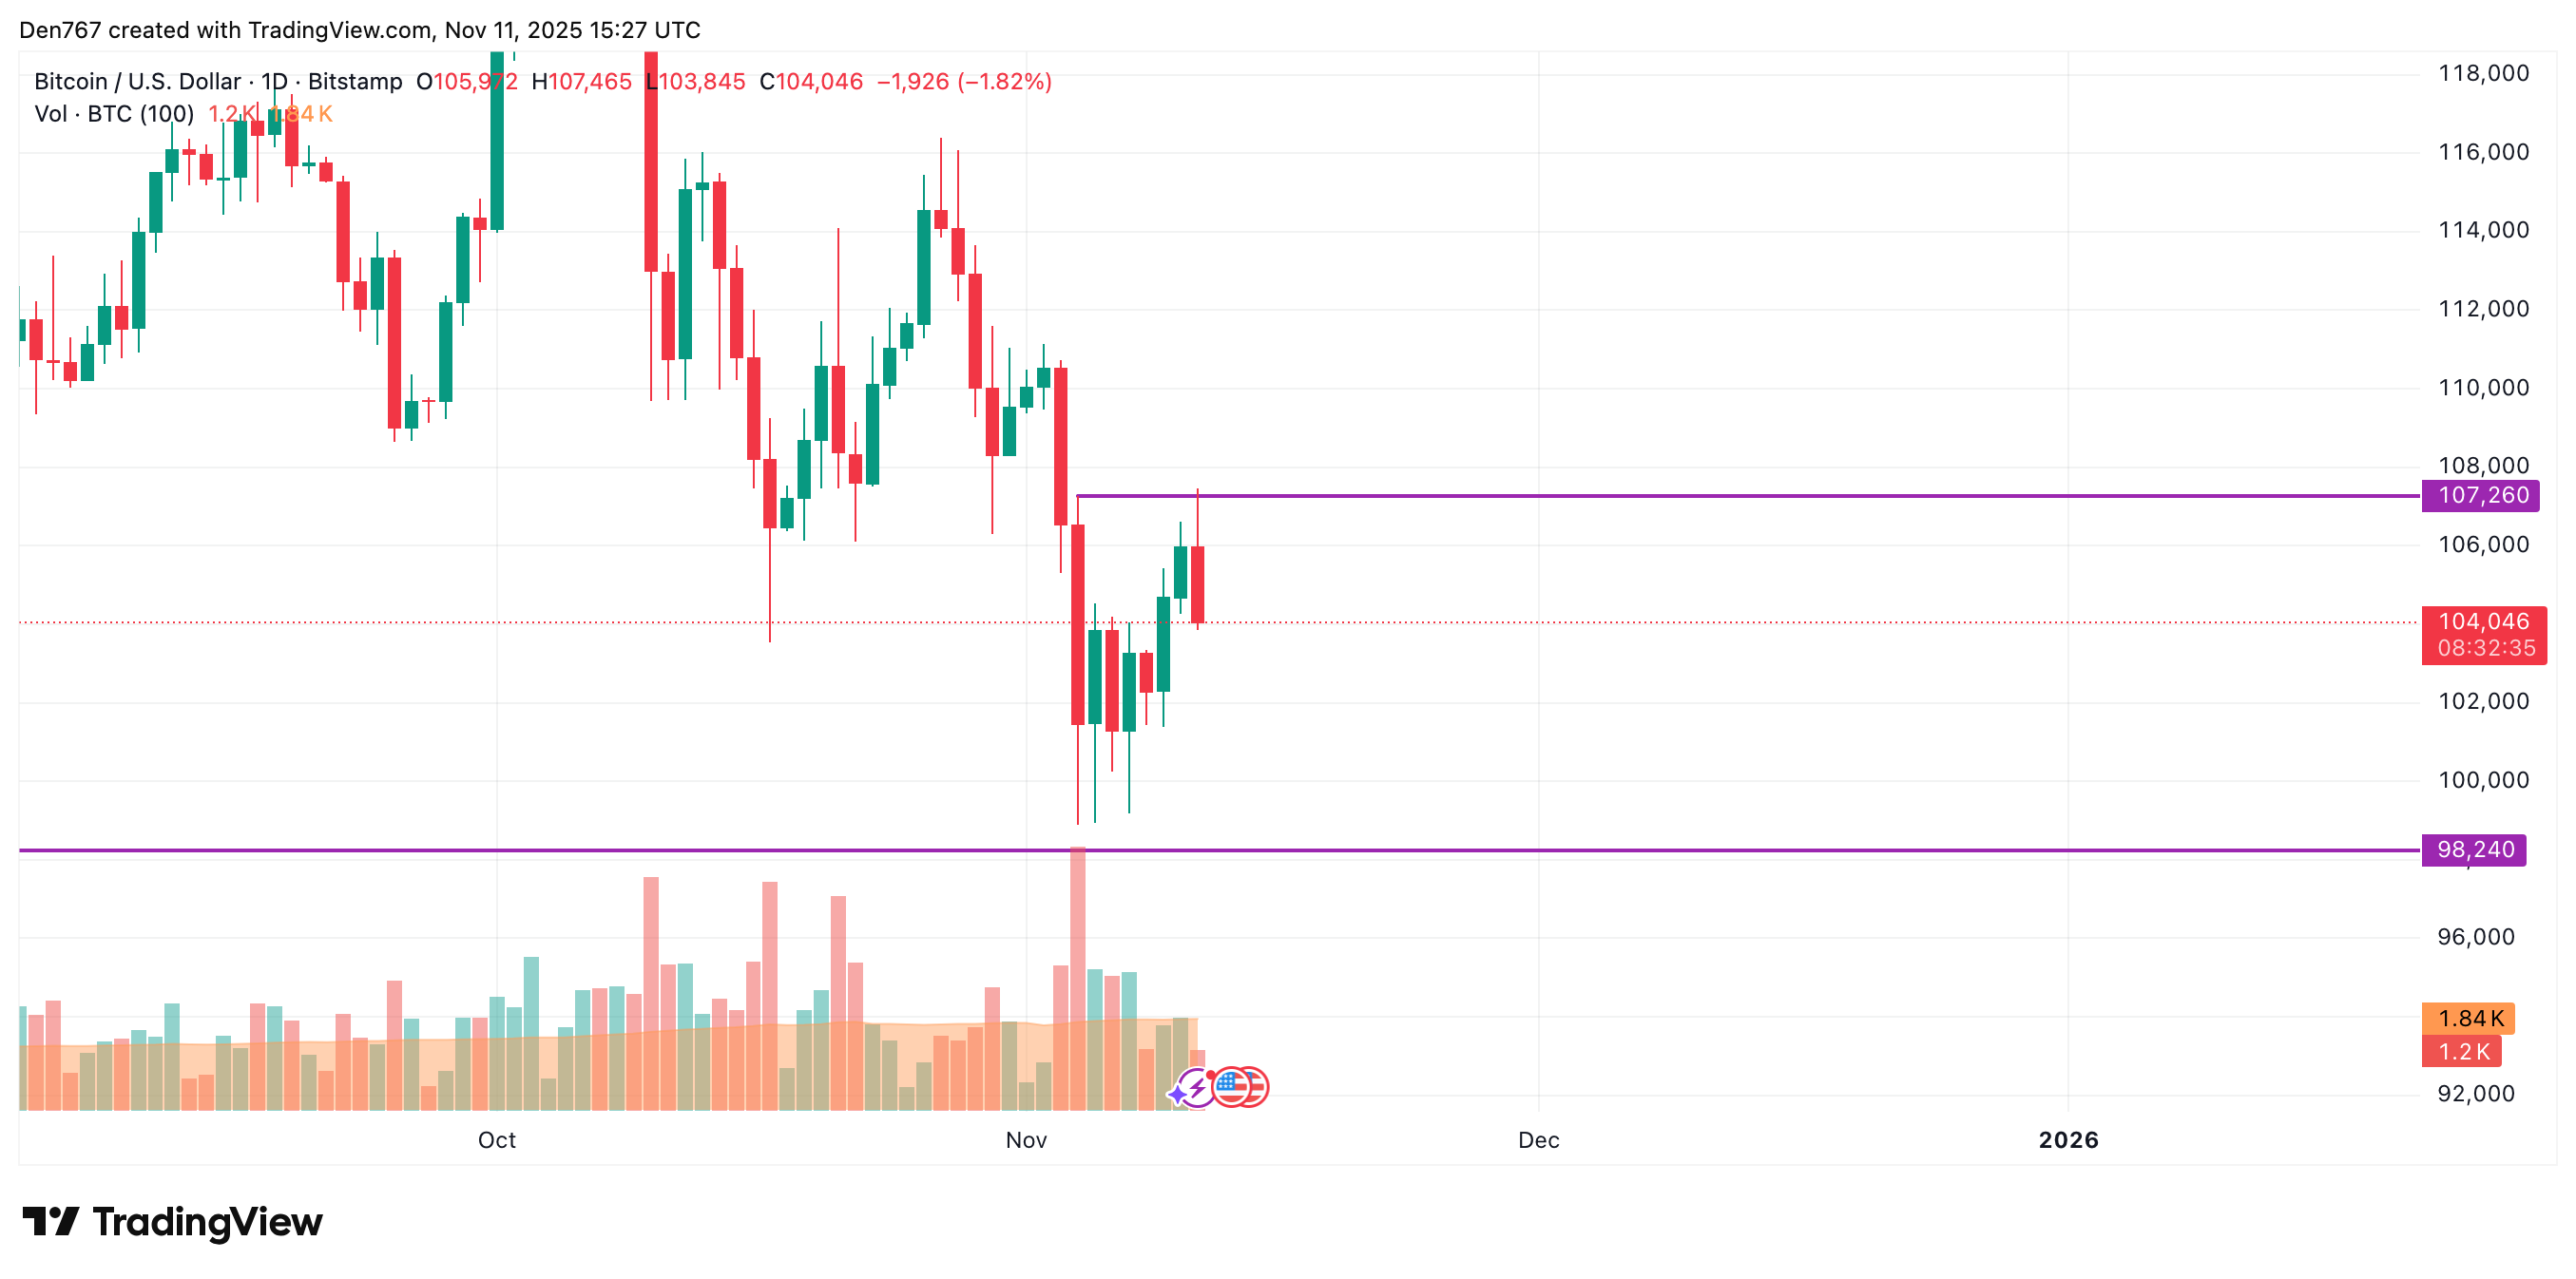
On the longer time frame, the price of the main crypto has made a false breakout of the $107,260 resistance.
If the daily bar closes below yesterday's candle's low, the correction is likely to continue to the $102,000-$103,000 range.
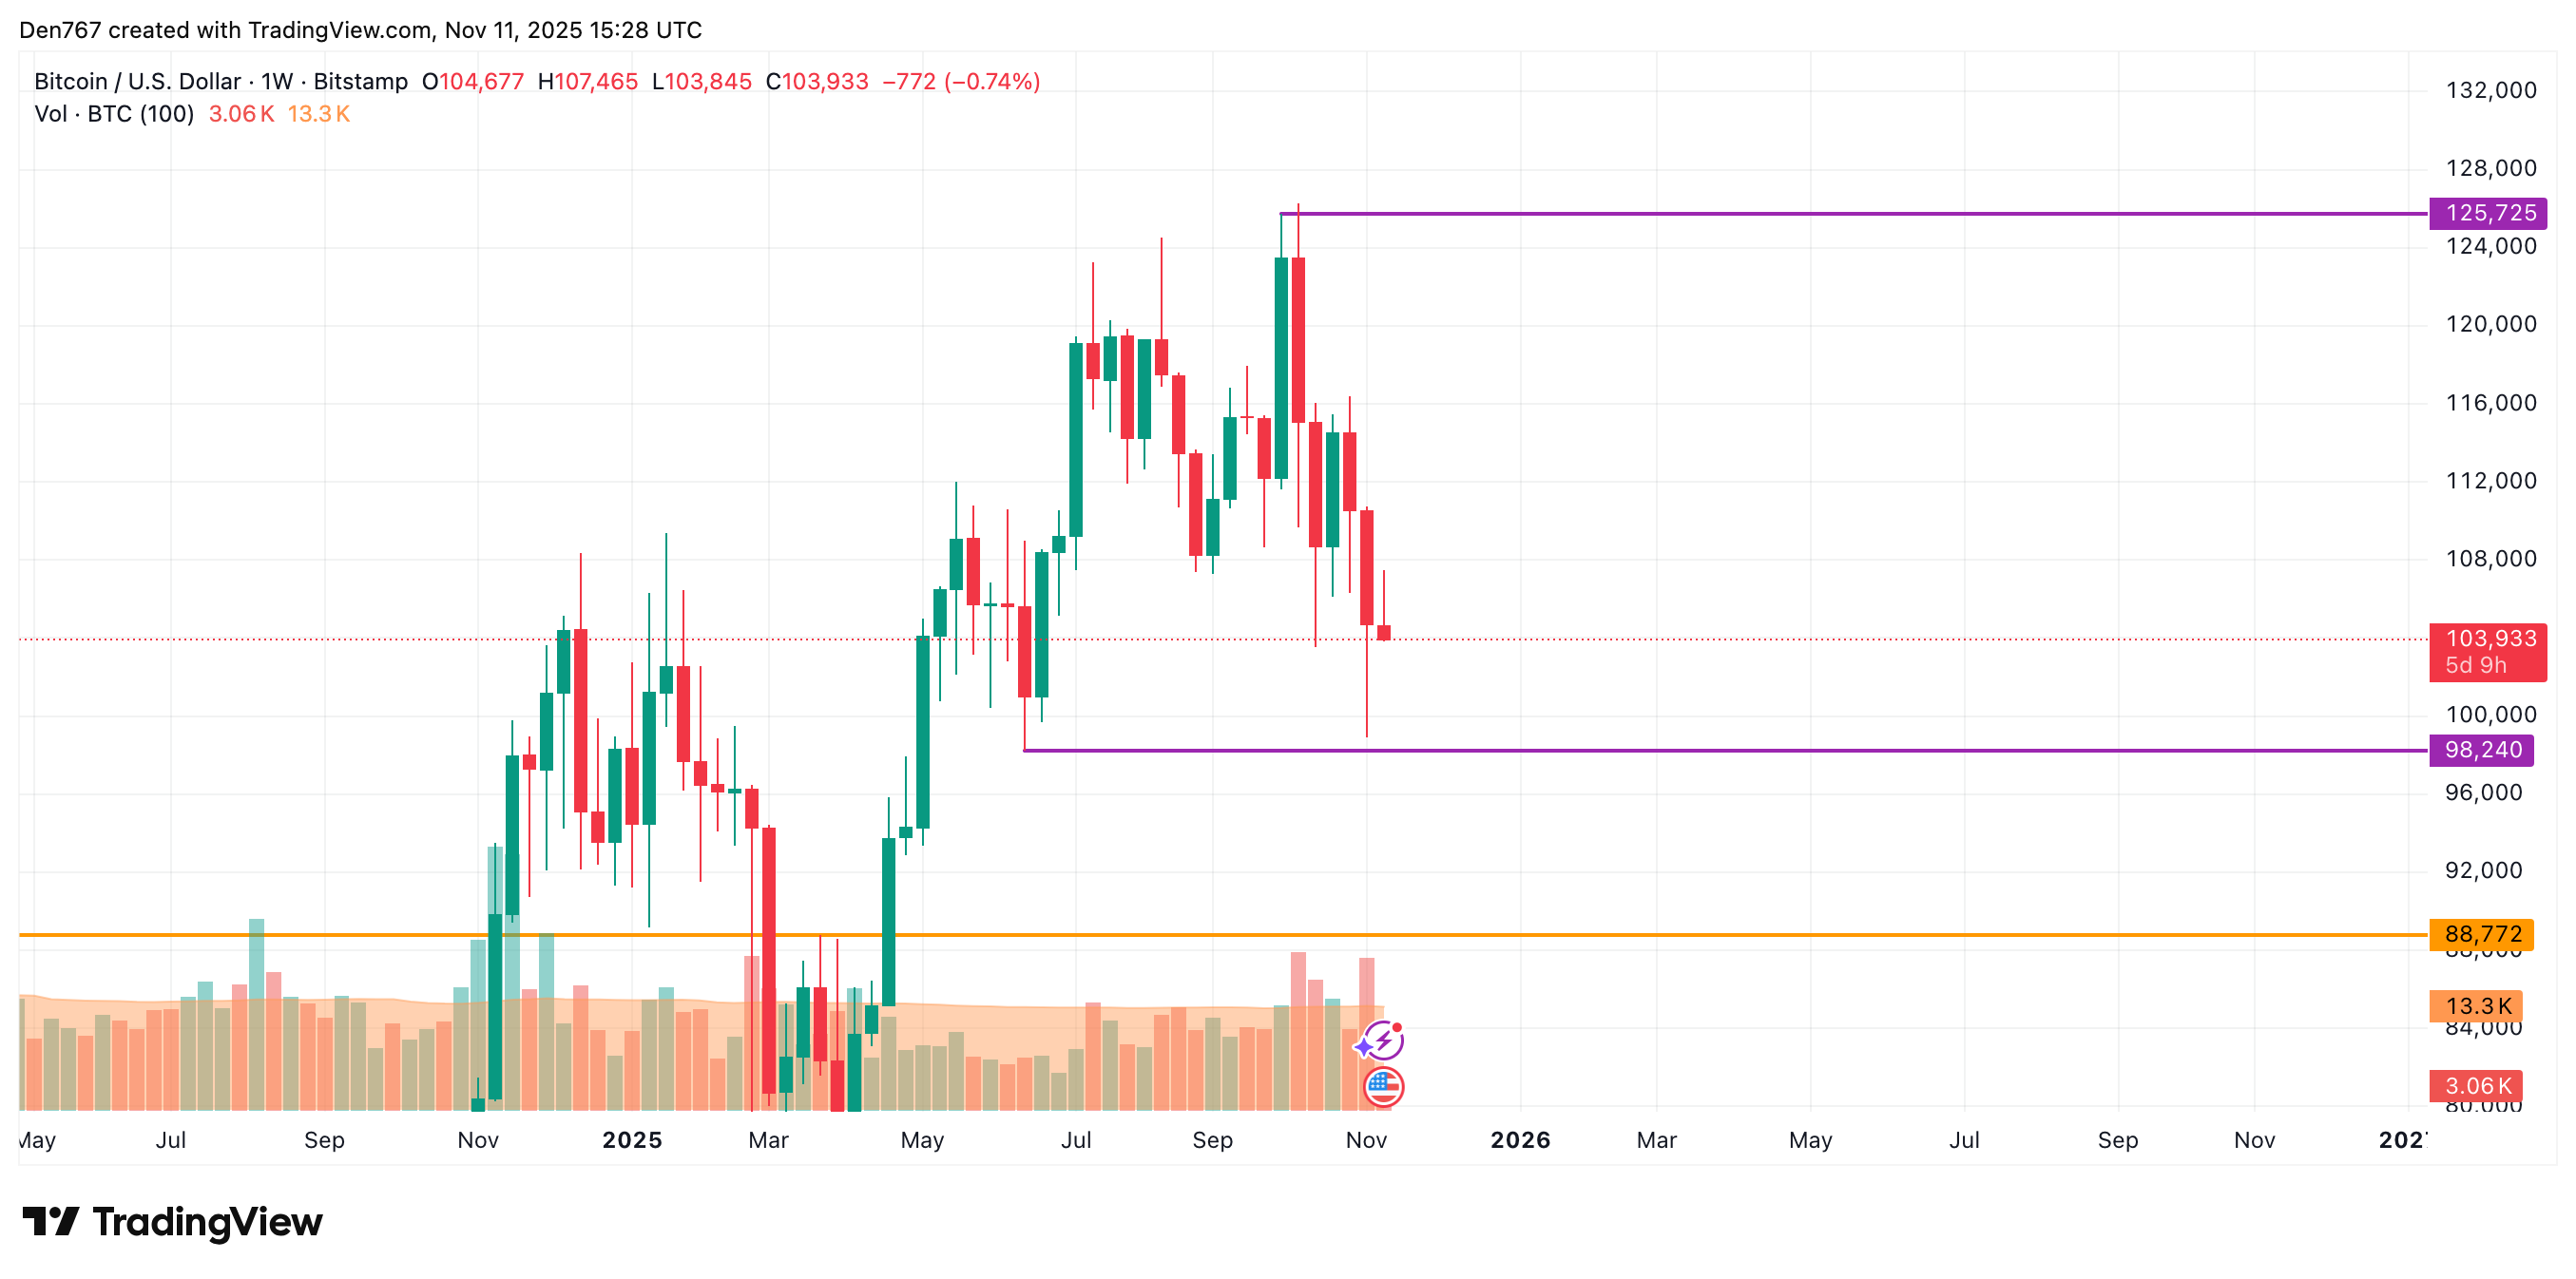
From the midterm point of view, bears are controlling the situation on the market. The volume is low, which means an ongoing decline is the most likely scenario over the next few days.
Bitcoin is trading at $103,933 at press time.