


 18
18
Bitcoin is trading at $102,848, with a market capitalization of $2.05 trillion and a 24-hour trading volume of $59.85 billion. The intraday price range spans from $102,349 to $104,412, reflecting a relatively narrow band of volatility amid consolidative market behavior.
Bitcoin Chart Outlook
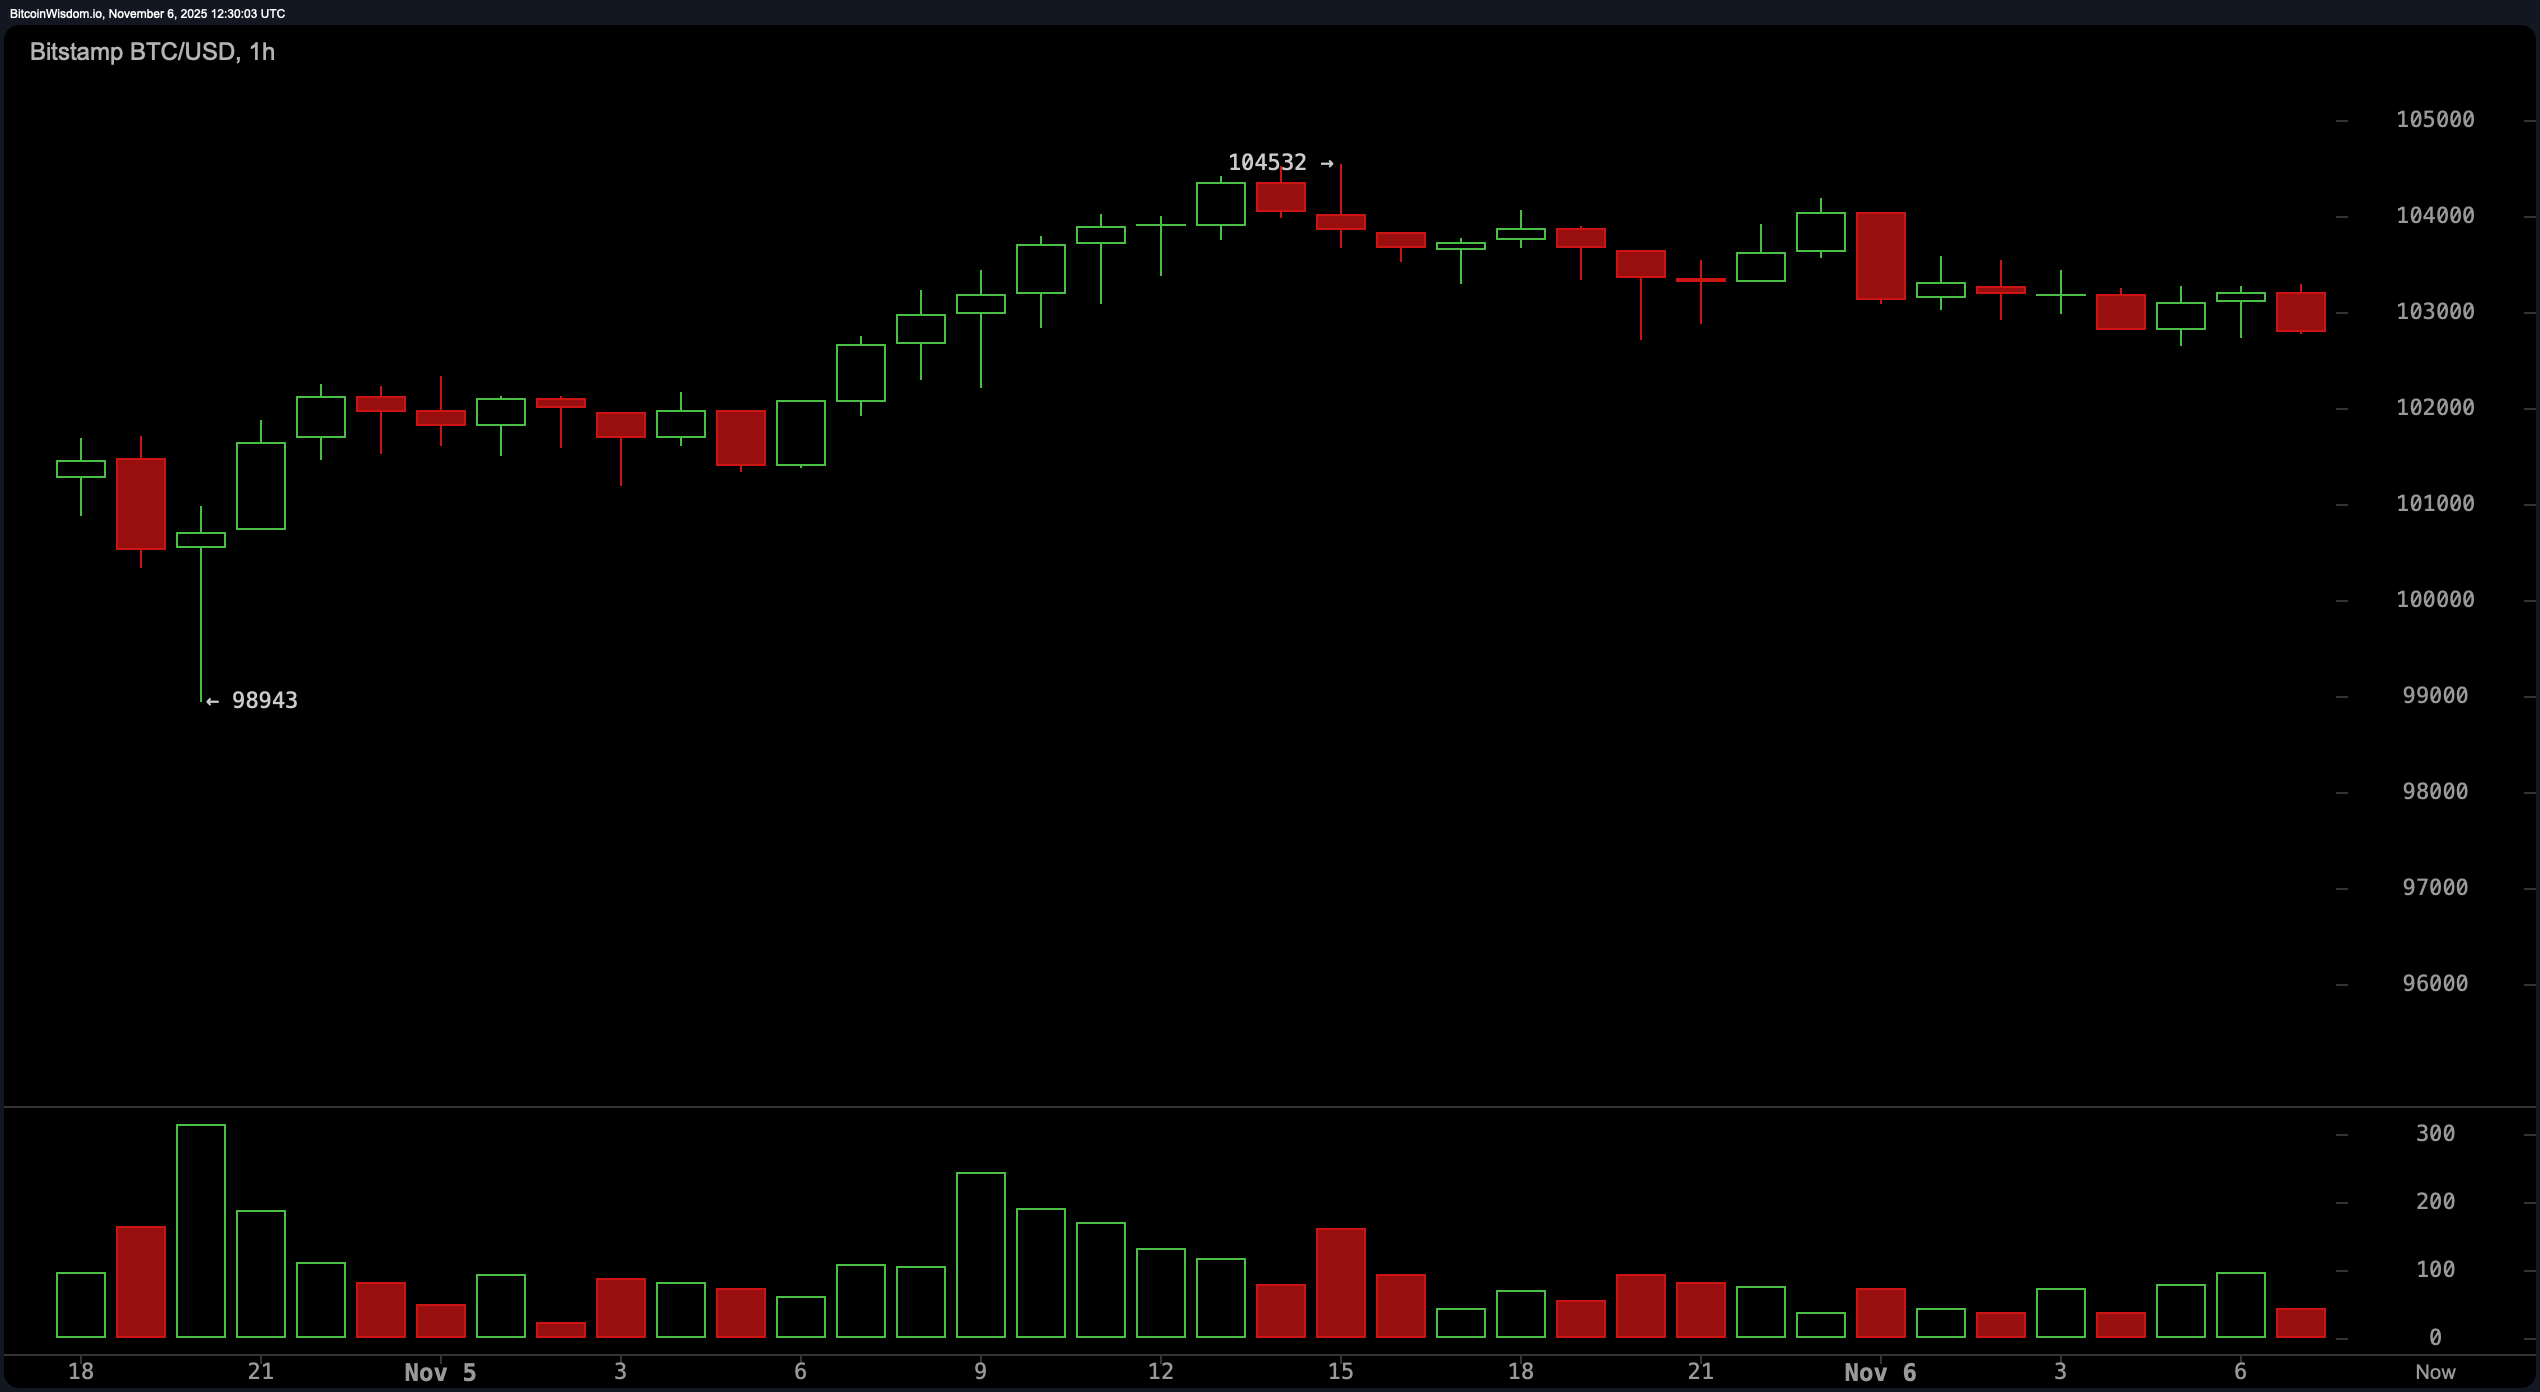
The 1-hour chart illustrates a microstructure dominated by a V-shaped recovery that followed a sharp downward flush below $99,000. Although the initial rebound was swift, price action has since slowed into a sideways range defined by lower highs and weakening volume—a clear sign of buyer fatigue.
The support zone remains near $98,900, where the last aggressive dip attracted strong buying interest, while resistance is forming near $104,500. Without a substantial uptick in volume, further upward movement appears unlikely, and traders are watching closely for price interaction near the $100,000 to $101,000 zone to gauge momentum strength.
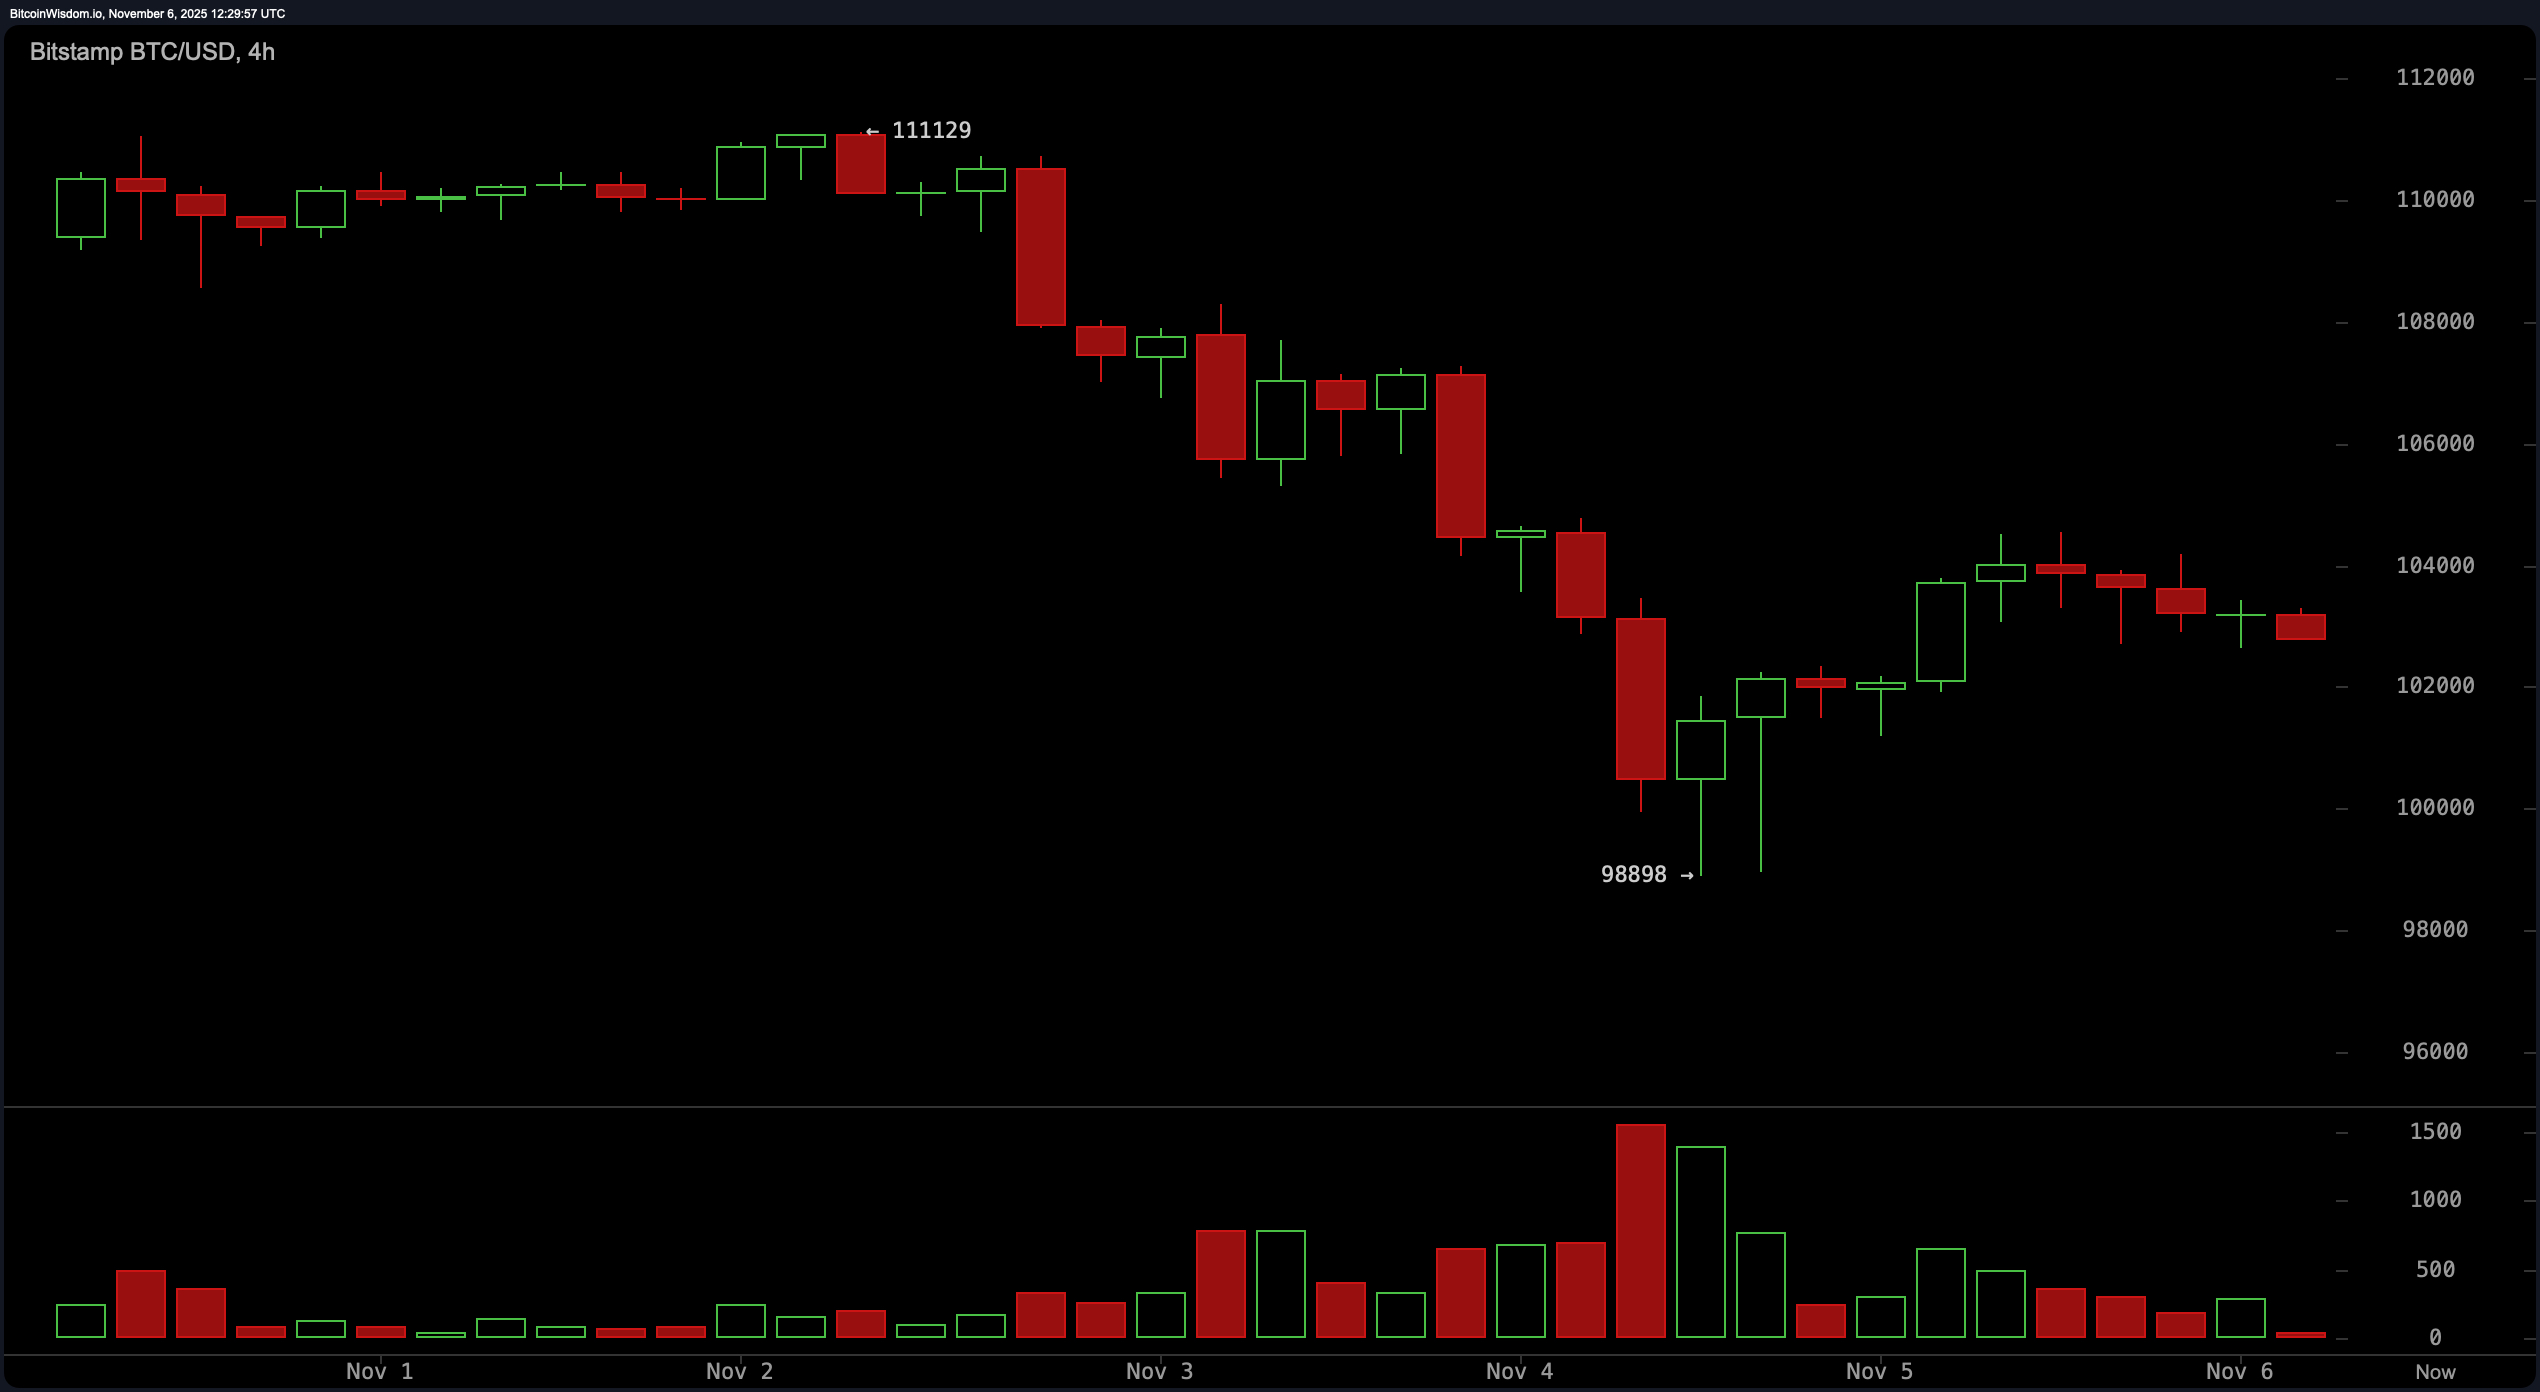
On the 4-hour chart, bitcoin continues to trend within a descending channel, signaling a bearish-to-neutral short-term structure. The top of this structure sits near $111,129, which was heavily rejected in prior sessions, while the bottom at $98,898 is reinforced by significant buying activity. Despite a relief rally attempt, the lack of follow-through and declining green volume bars suggest a possible distribution phase. Holding above $101,000 remains critical; failure to do so could set the stage for another probe below the $99,000 mark. Conversely, reclaiming the $106,000 level with volume would indicate a potential shift toward short-term upside.
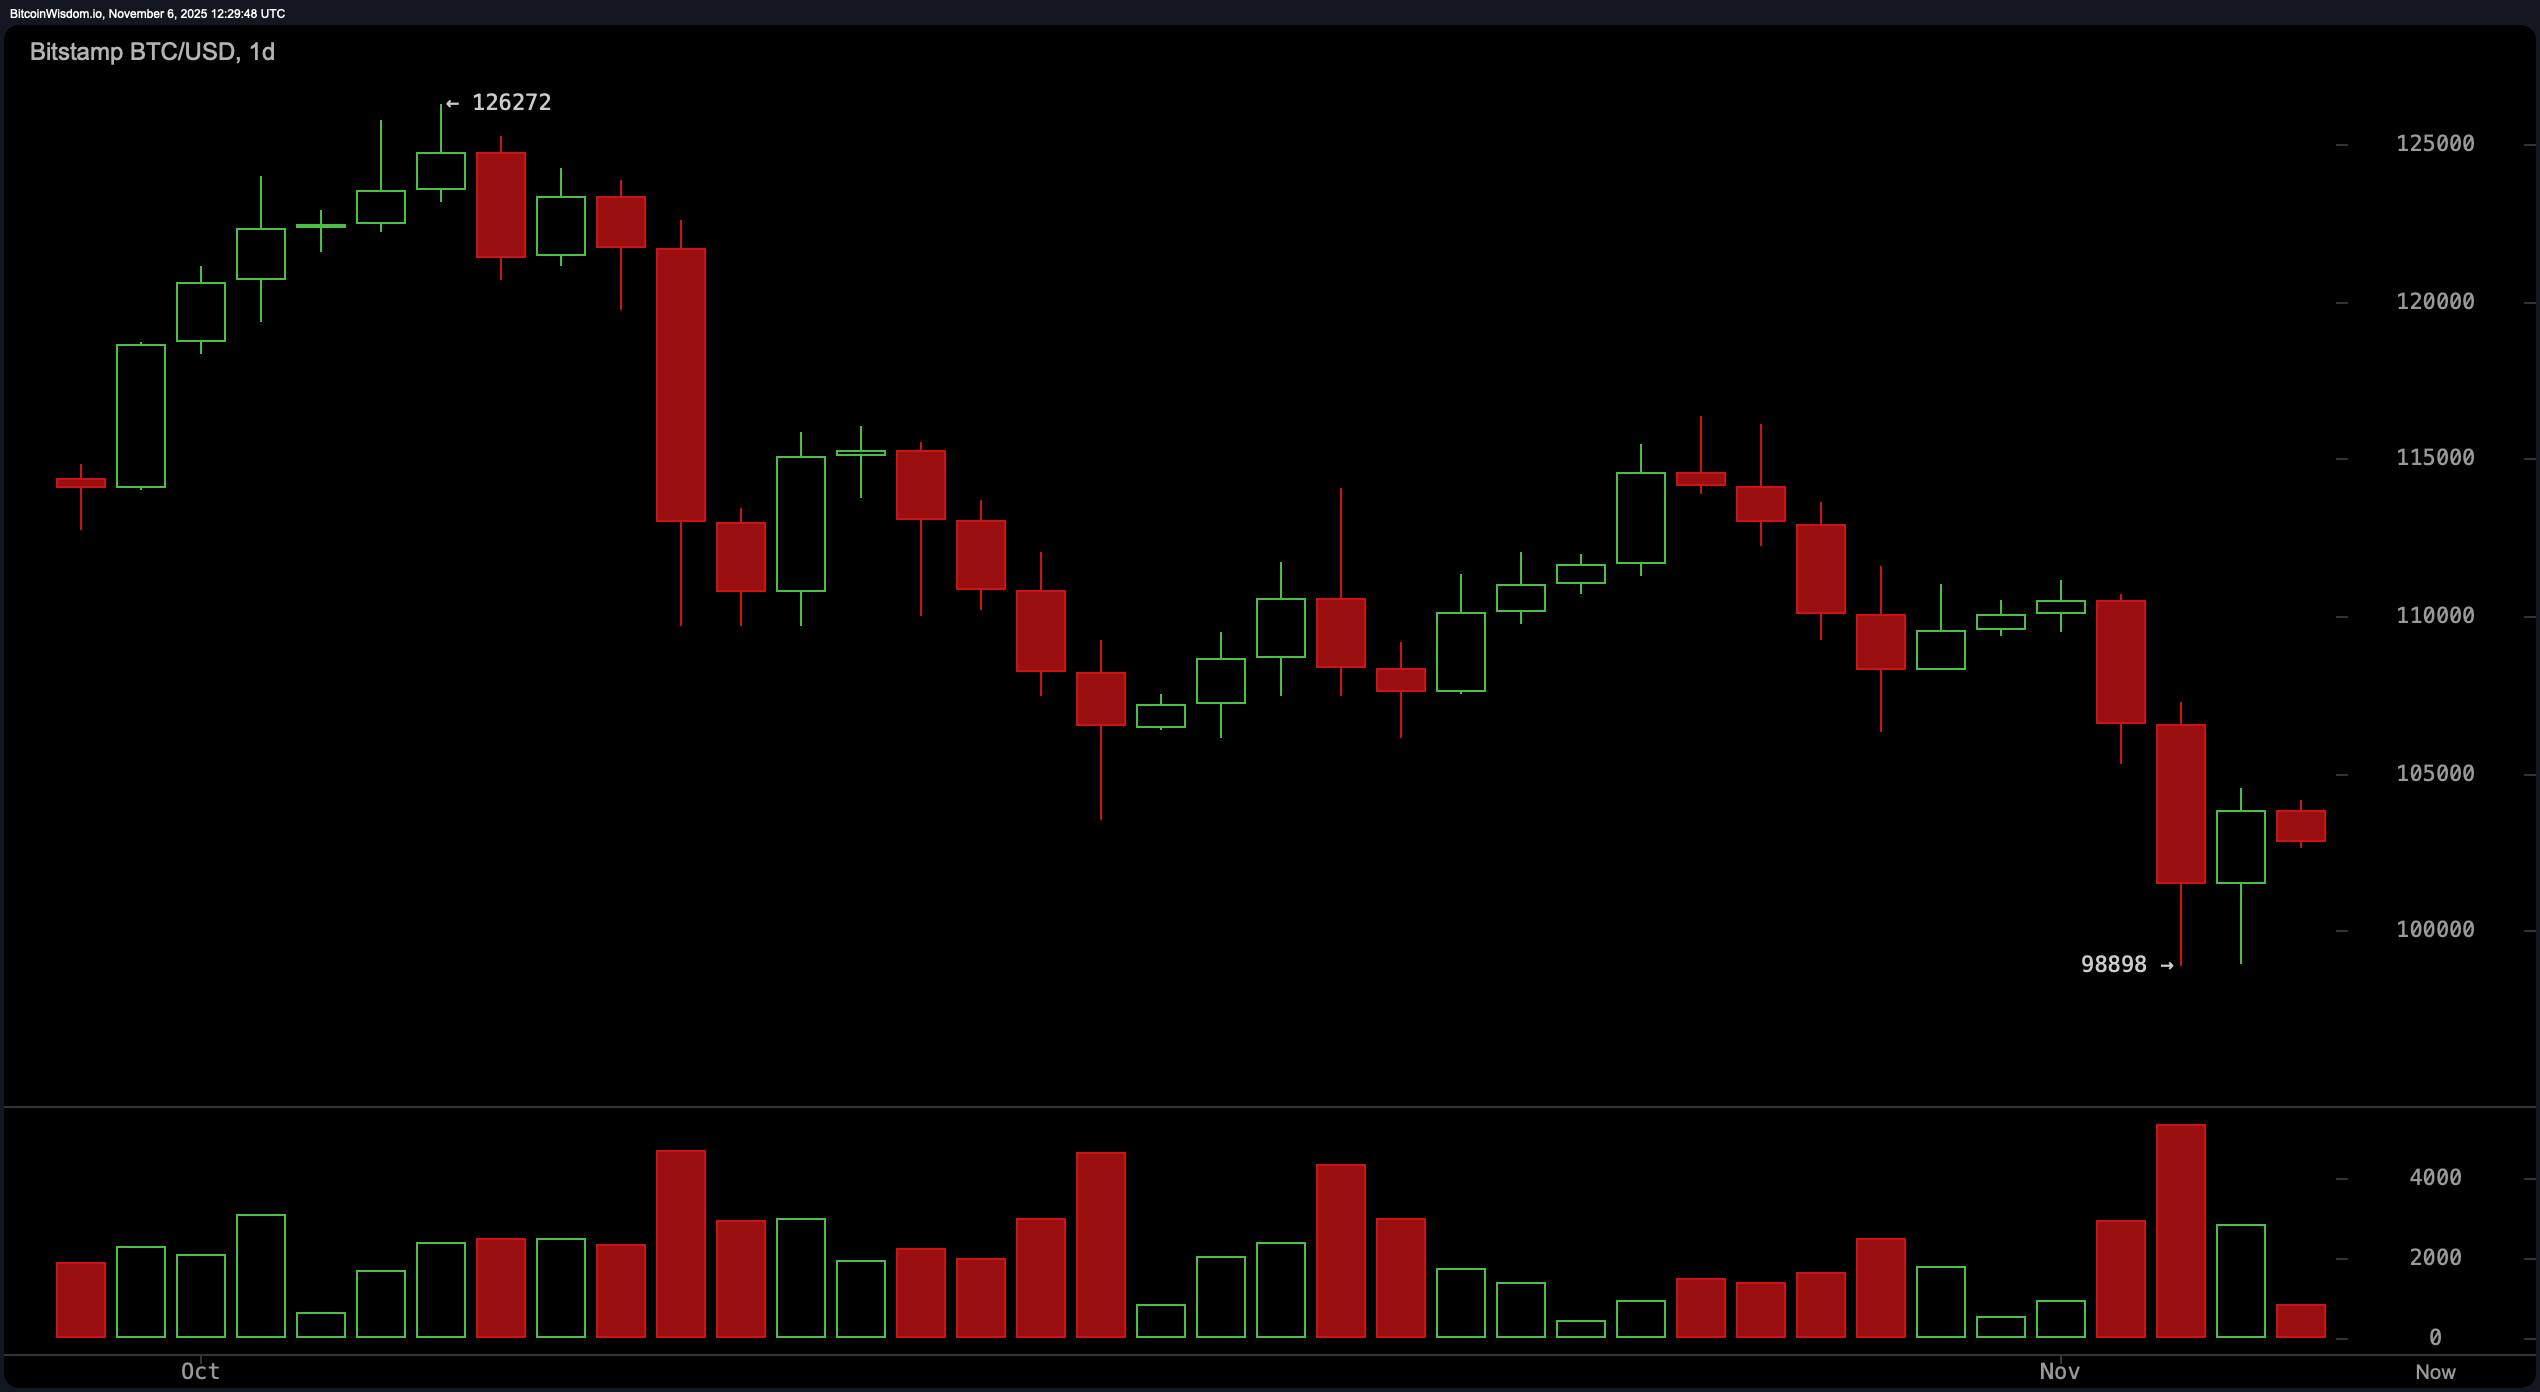
The daily chart presents a more pronounced macro bearish narrative, characterized by a consistent series of lower highs and lower lows. The rejection from $126,272 has cascaded into continued downward pressure, with $98,898 now acting as a vital support floor. The price’s consolidation near $103,000 lacks sufficient bullish volume, suggesting indecision and a potential continuation of the bearish trend. A confirmed daily close above $108,000 to $110,000 would be required to break the macro pattern and establish upward momentum.
From a technical indicator standpoint, oscillators are largely indecisive. The relative strength index (RSI) is at 36, signaling neutral momentum, while the Stochastic oscillator stands at 22, also neutral. The commodity channel index (CCI) at −153 is the only oscillator indicating potential upside. However, momentum at −11,314 and the moving average convergence divergence (MACD) at −2,375 are both aligned with continued downward bias. Additionally, the Awesome oscillator reads −6,986, and the average directional index (ADX) at 22 suggests a weak trend strength overall.
Moving averages reinforce the bearish positioning. All major exponential moving averages (EMA) and simple moving averages (SMA) from the 10-period to the 200-period are currently above the spot price and indicate downside pressure. The 10-period EMA is at $106,667, while the 200-period EMA stands at $108,228. Similarly, the 10-period SMA is at $107,611, and the 200-period SMA at $110,136—each providing layered resistance that bitcoin must overcome to shift sentiment more favorably.
In summary, bitcoin remains in a technically fragile state, caught between key support near $99,000 and overhead resistance just above $108,000. Momentum signals favor caution, with no confirmed bullish reversal yet established. Volume remains the key trigger for directional conviction, and traders are closely monitoring whether the $98,000 floor will hold or if the asset will reclaim levels necessary to challenge the broader downtrend.
Bull Verdict:
If bitcoin maintains its footing above the $98,000 support and manages a decisive break above $110,000 on rising volume, the technical landscape could shift in favor of a recovery. A close above this level would disrupt the current downtrend structure and signal renewed accumulation interest, potentially setting the stage for a move toward prior highs in the $120,000 range.
Bear Verdict:
Should bitcoin lose the critical $98,000 support level, the prevailing downtrend will likely accelerate, with downside targets between $92,000 and $94,000 becoming increasingly probable. With all major moving averages positioned above current price action and momentum indicators skewed to the downside, the path of least resistance remains lower unless a clear reversal develops.
FAQ
- Where is bitcoin trading right now? Bitcoin is trading around $102,848 as of Nov. 6, 2025.
- What is the current support level for bitcoin?Key support is holding near $98,000, a level tested multiple times recently.
- What price zone could signal a trend reversal?A move above $110,000 with volume may indicate a potential reversal.
- Are indicators suggesting further downside?Most moving averages and momentum indicators point to continued bearish pressure.


