


 16
16
Bitcoin danced on the edge of a cliff Tuesday, teetering just above critical support at $103,500, and investors felt the tension. With heavy sell-side volume and technical signals flashing red across the board, the market waits to see if gravity—or resilience—wins this round.
Bitcoin Chart Outlook
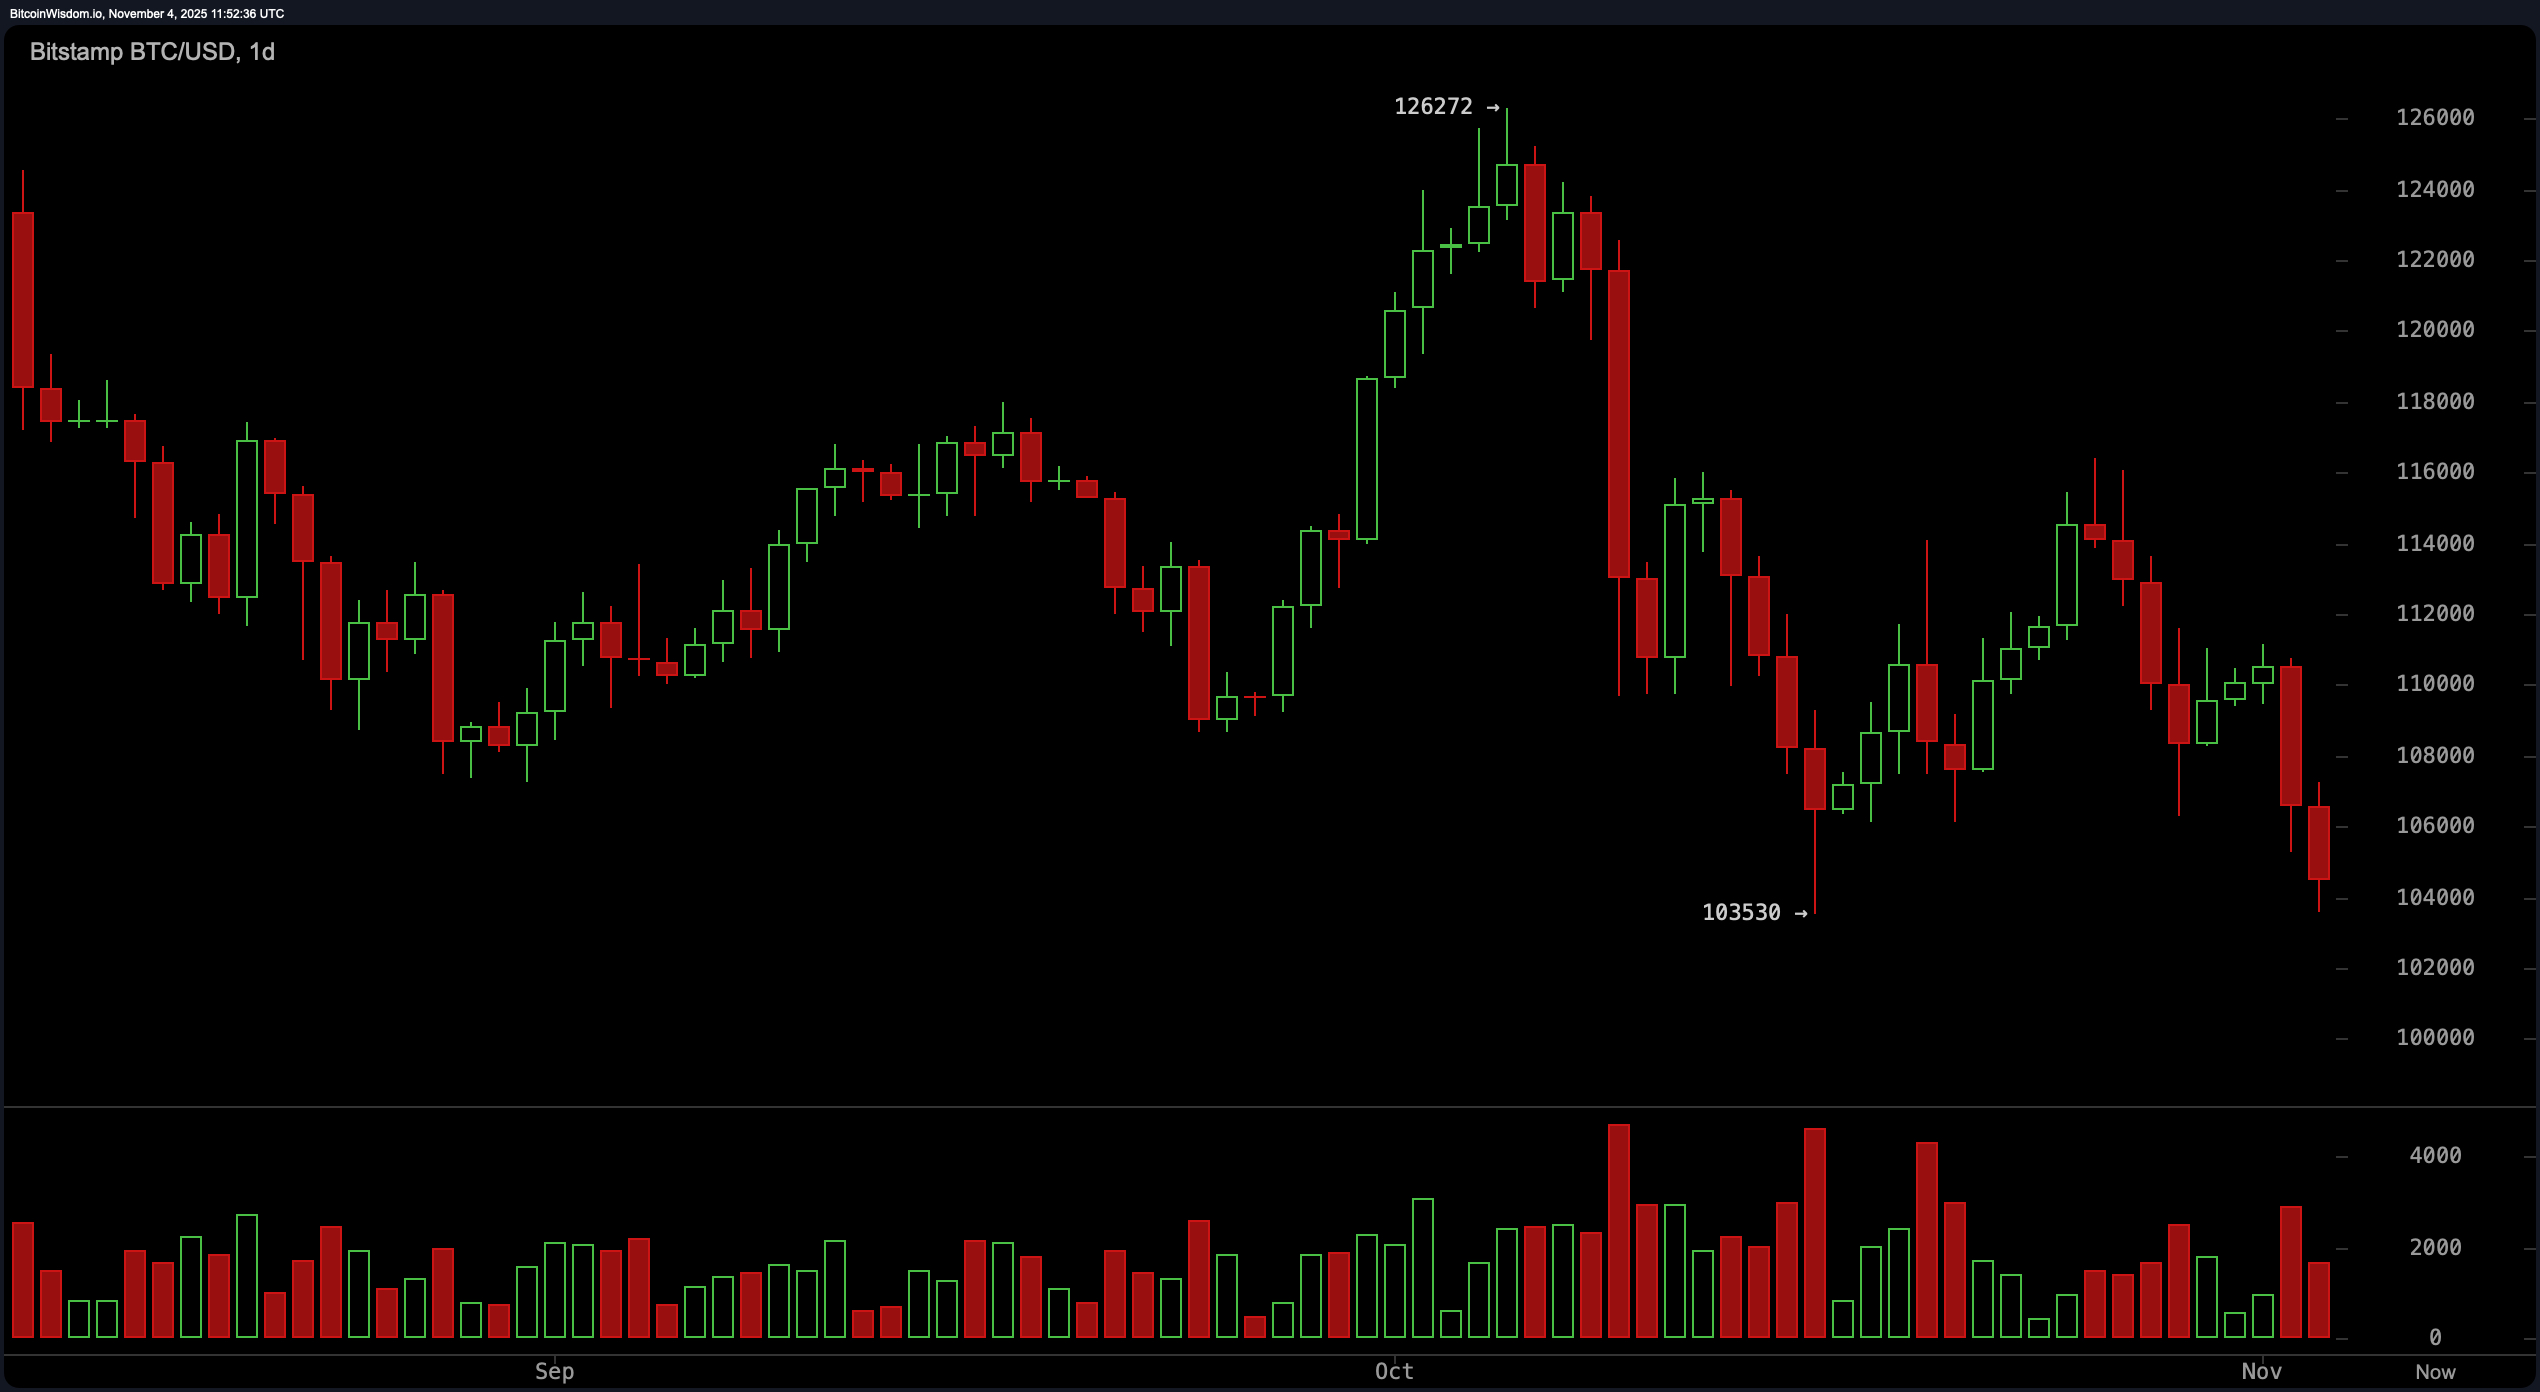
Across the daily chart, the landscape remains distinctly bearish. bitcoin has now shed nearly 20% from its October peak of $126,272, establishing a strong downtrend with consistent lower highs and lower lows.
The current pivot is the $103,530 support—already tested twice—where another failure could accelerate losses toward the $98,000–$100,000 range. Elevated red candle volume on this timeframe confirms that sellers are still firmly in control, and unless bulls stage a convincing reversal with volume and pattern alignment, the pressure could intensify.
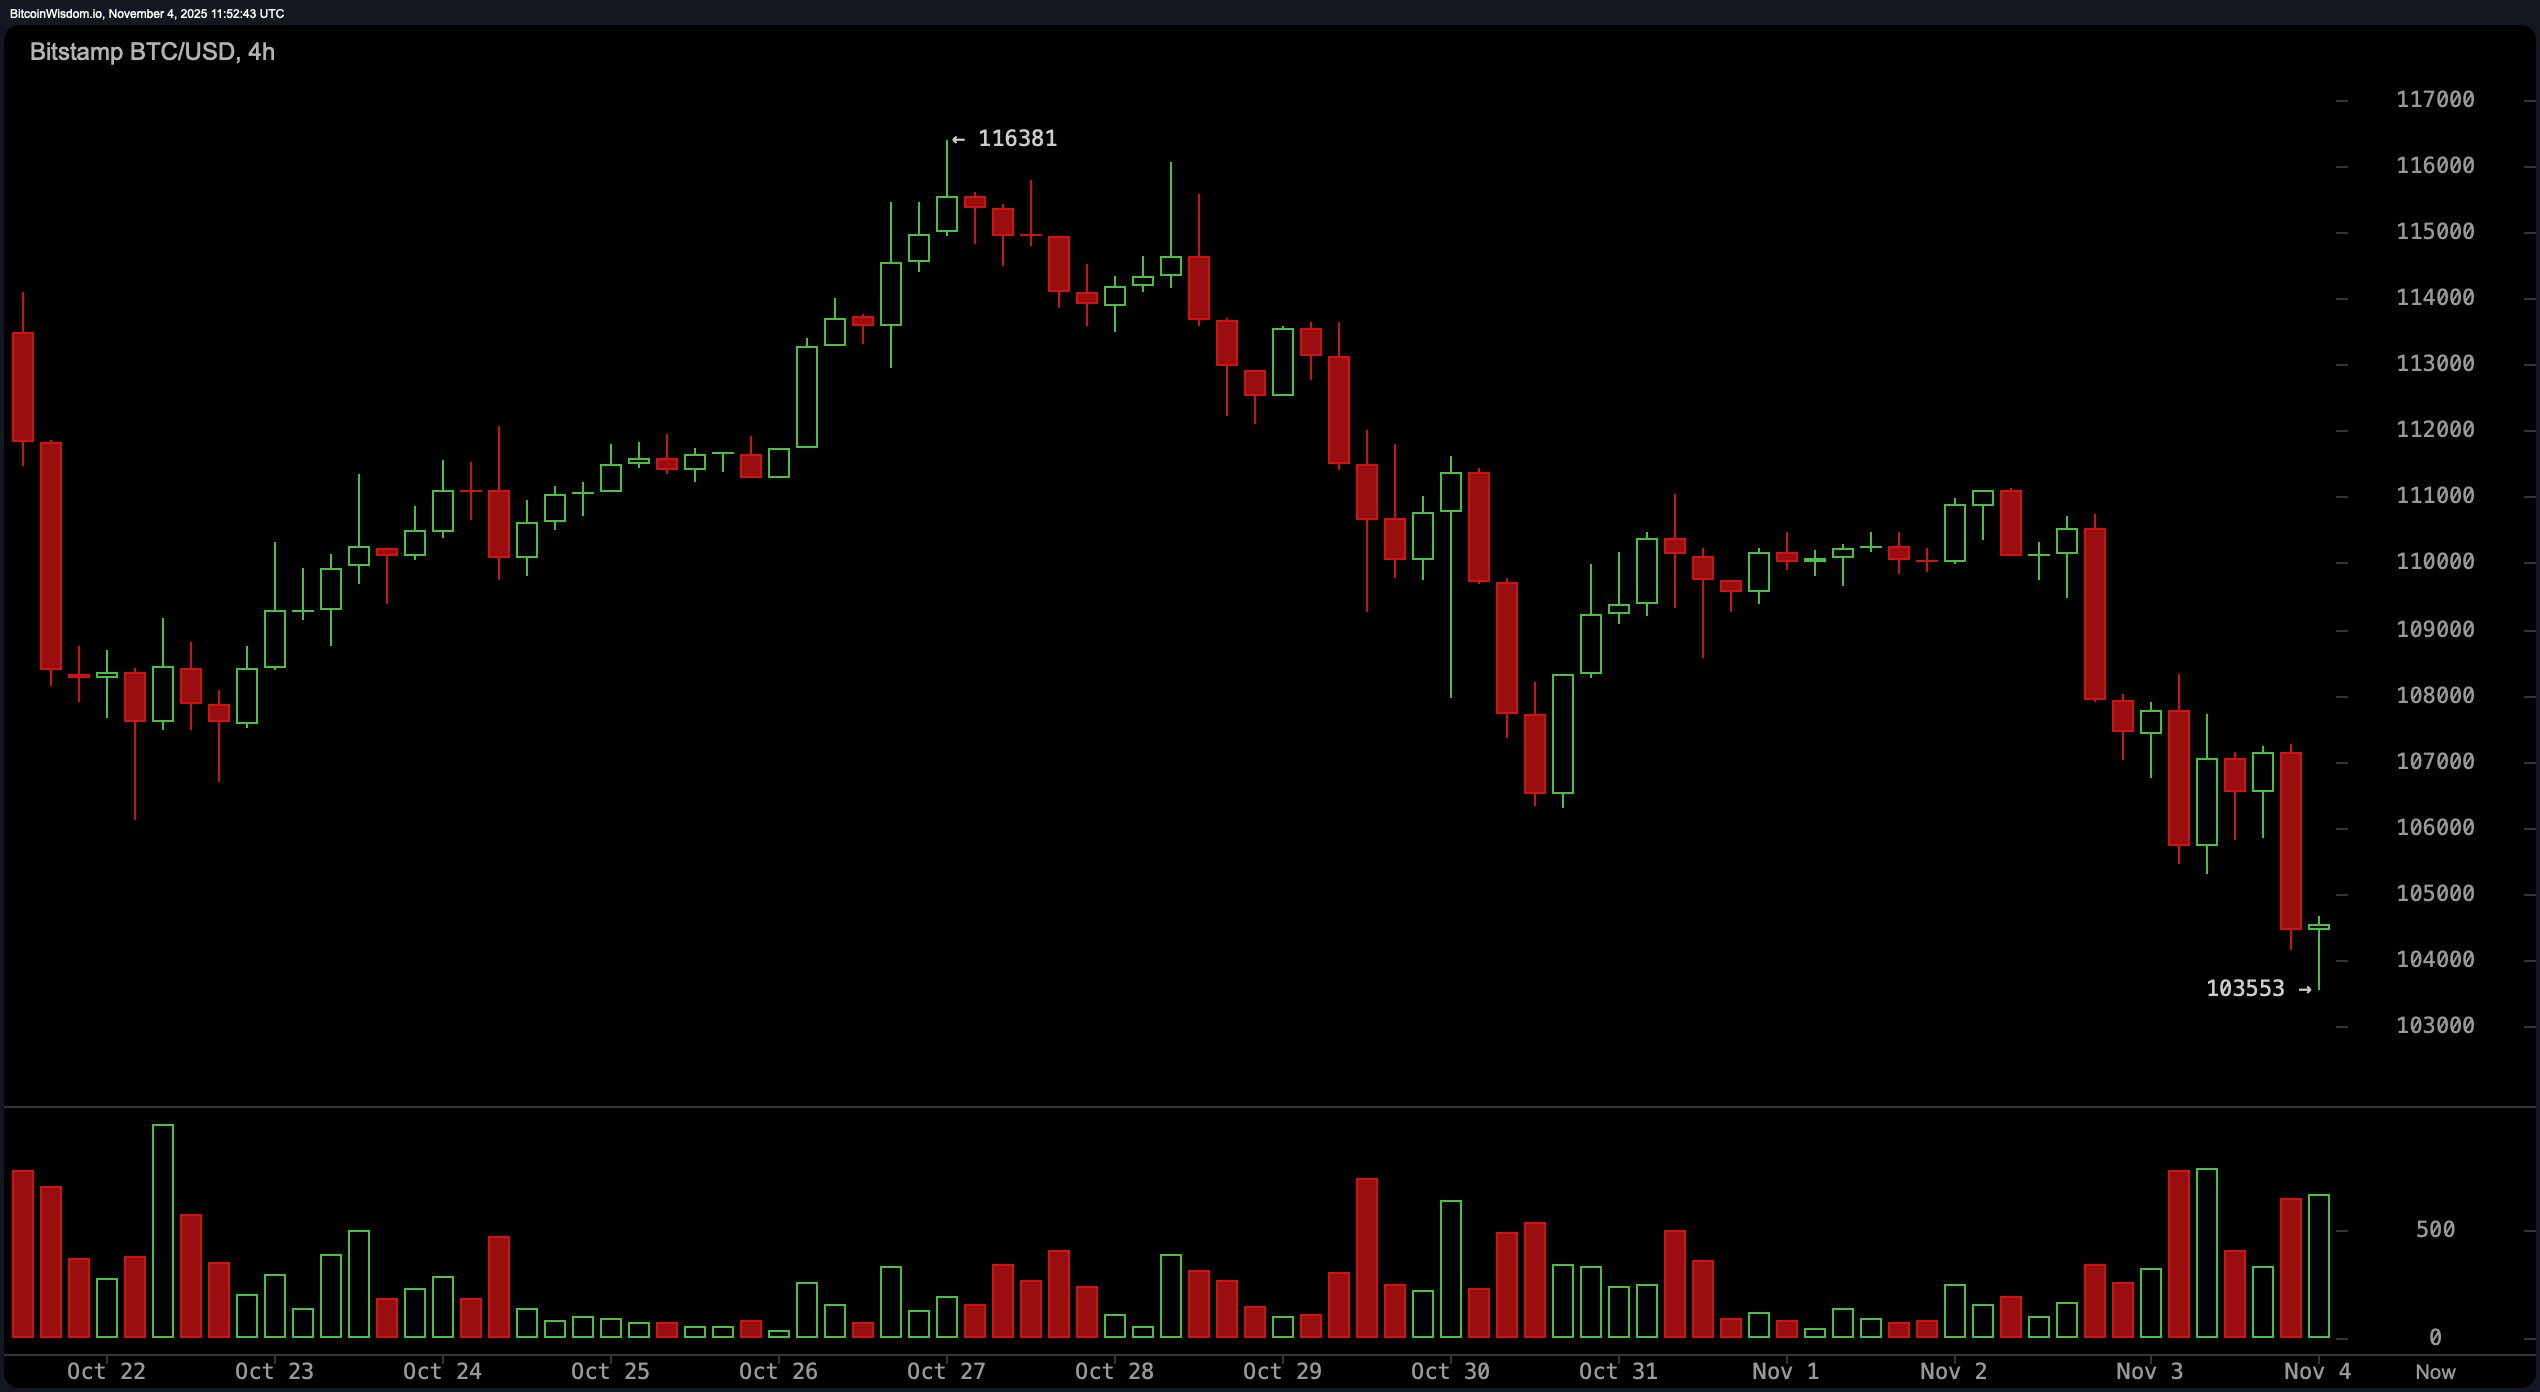
Zooming into the four-hour chart, bitcoin’s structure echoes its daily counterpart: a staunch downtrend, with a lower high carved out at $116,381. Notably, recent candlesticks near support are small and indecisive, suggesting buyers lack conviction. A cluster of red volume bars indicates potential panic selling, and the resistance zone between $108,000 and $110,000 could repel any weak bounces. A break below $103,553 without a successful retest would likely validate a bearish continuation.
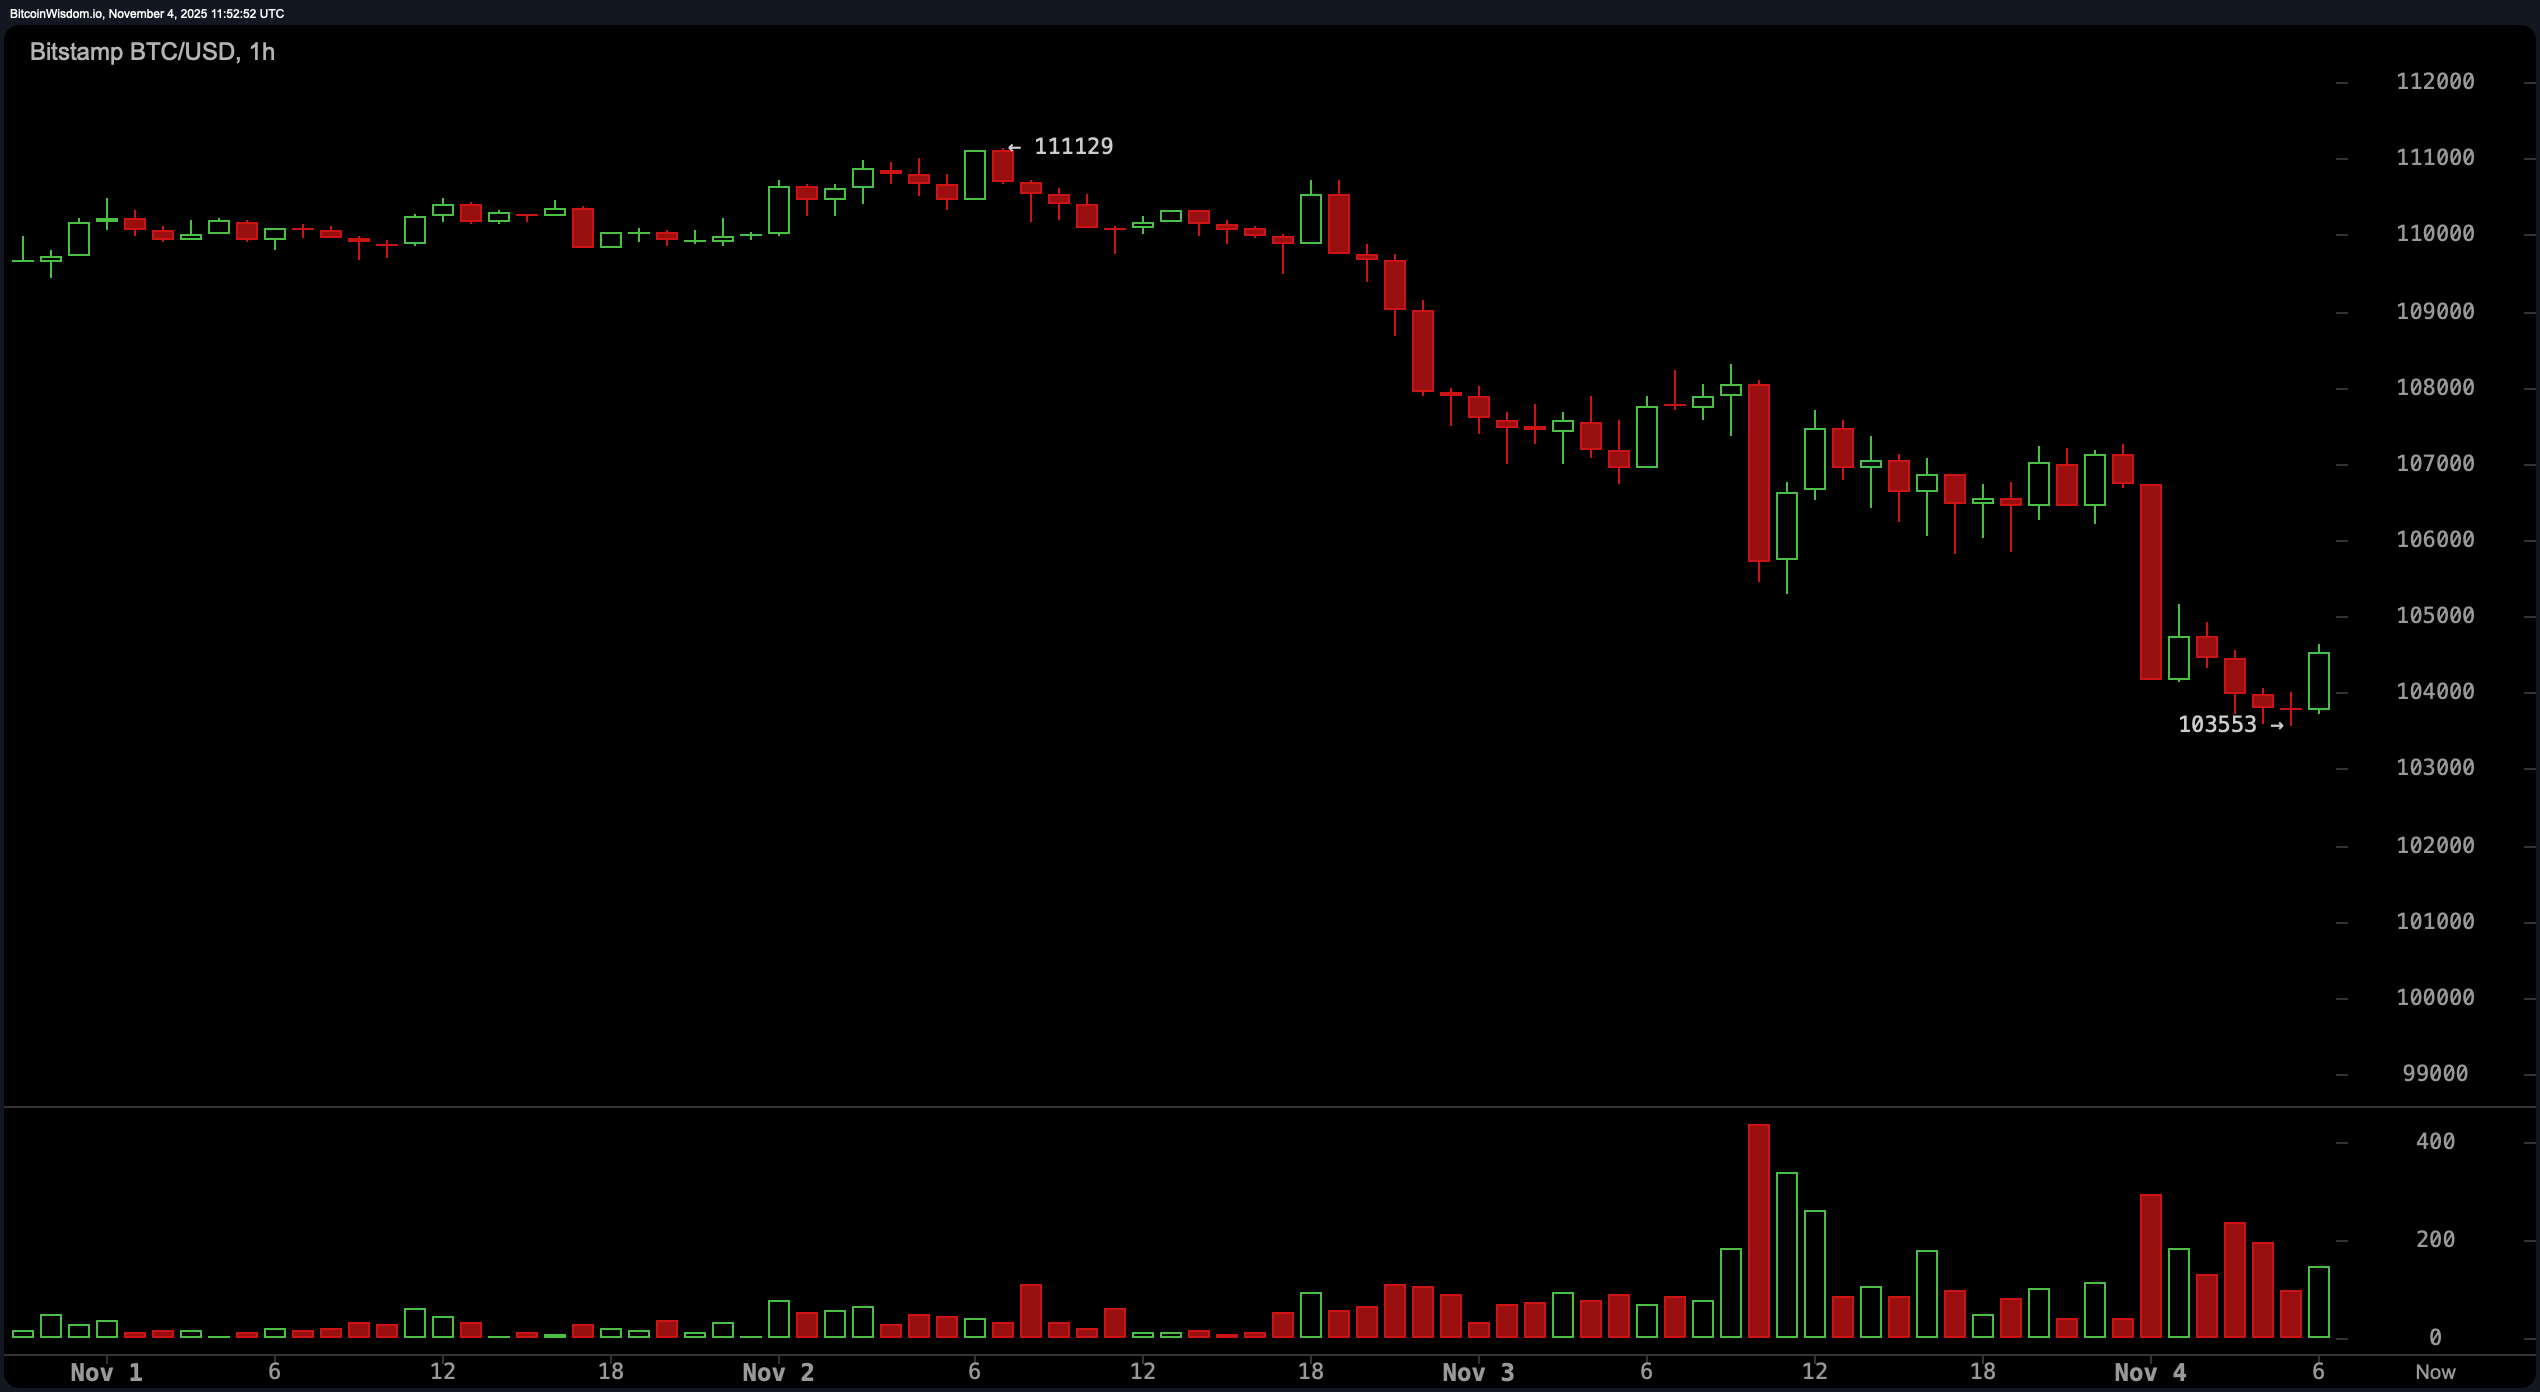
On the one-hour chart, things look no less dicey. bitcoin staged a meek bounce off $103,553, but it lacks momentum—literally and figuratively. The pattern forming resembles a bear flag, notorious for preceding further downside. Volume on the recovery is underwhelming, signaling that buyers are either absent or merely dipping toes. Should bitcoin manage to close above $105,000 with convincing volume, a minor relief rally could ensue, but the more probable script sees sellers reassert control near the $106,000 ceiling.
Looking under the hood at the indicators, the story remains consistent. The relative strength index (RSI) reads a subdued 36, showing neutrality but leaning oversold. The stochastic oscillator echoes this at 20, and the commodity channel index (CCI) has plunged to −168. The average directional index (ADX) rests at a passive 18, while the awesome oscillator is negative at −4,768. Momentum sits at −7,207, and the moving average convergence divergence (MACD) level stands at −1,627—both signaling downside force. Every major exponential moving average (EMA) and simple moving average (SMA) from the 10-period to the 200-period sits well above current price, reinforcing the weight pressing down.
At this point, bitcoin is clinging to a precipice, and all three major timeframes point to the same nerve center: $103,500. It’s a line in the sand where bulls might mount a comeback—or get steamrolled. The next few candles could shape the near-term trend, but as it stands, the charts are not smiling kindly upon upward optimism.
Bull Verdict:
If bitcoin holds the $103,500 support with conviction—ideally confirmed by rising volume and a bullish reversal pattern—then a rebound toward the $108,000–$110,000 resistance zone remains on the table. Short-term momentum could flip if buyers show up with purpose, but they’ll need to punch through a wall of overhead moving averages to regain control.
Bear Verdict:
Should bitcoin decisively breach $103,500 without a credible retest, expect a swift descent toward the $98,000–$100,000 range. The trend is bearish across all major timeframes, and momentum indicators, along with uniformly bearish moving averages, point to sustained downside unless bulls stage an unusually strong counterattack.
FAQ ❓
- What is bitcoin’s current price? bitcoin is trading at $104,518 as of November 4, 2025.
- Where is bitcoin’s key support level?The critical support zone is at $103,500, observed across all major timeframes.
- What is bitcoin’s recent trading range? bitcoin has traded between $103,656 and $108,151 over the last 24 hours.
- What trend do bitcoin’s charts show now?Technical indicators point to a sustained bearish trend with weak bullish momentum.

