Bitcoin
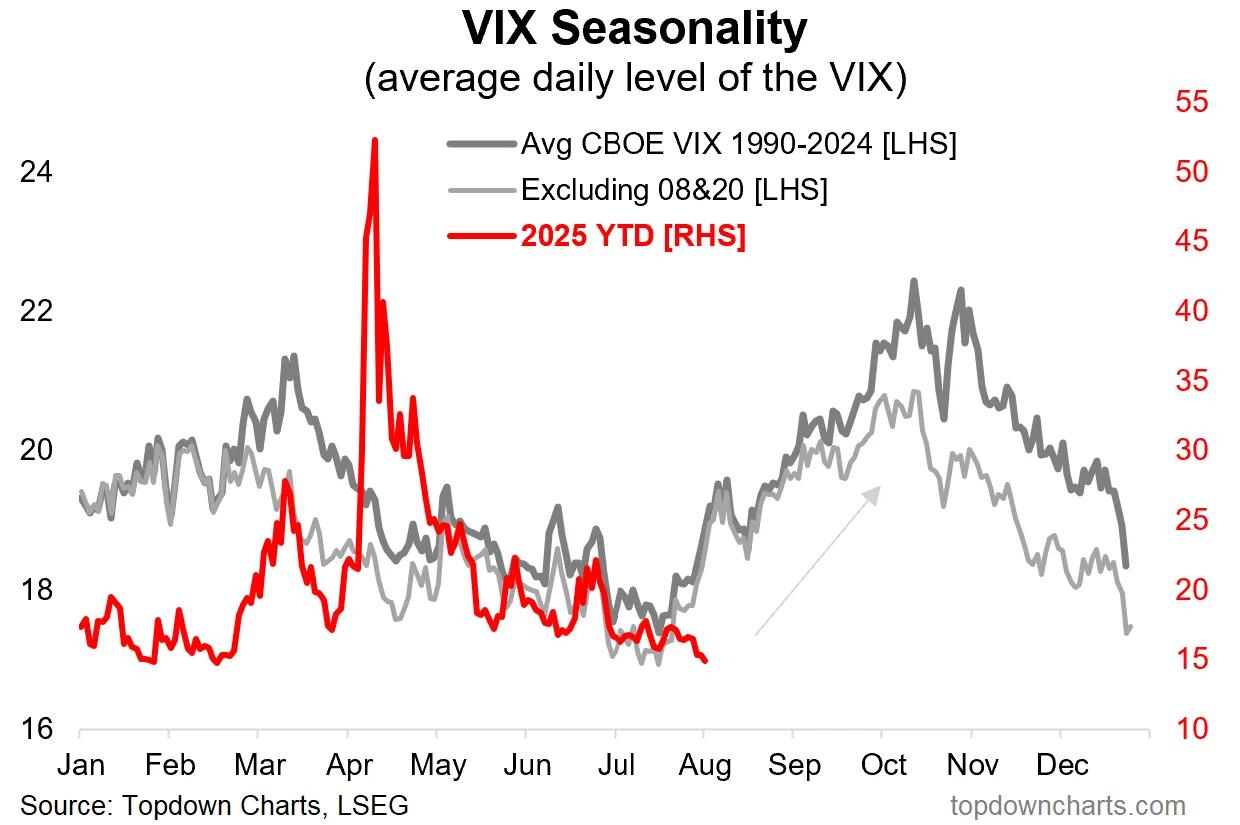
The VIX measures the anticipated 30-day swings of the S&P 500 benchmark. Its historical pattern, according to Barchart.com, shows a frequent August surge, often preceded by a decline in July.
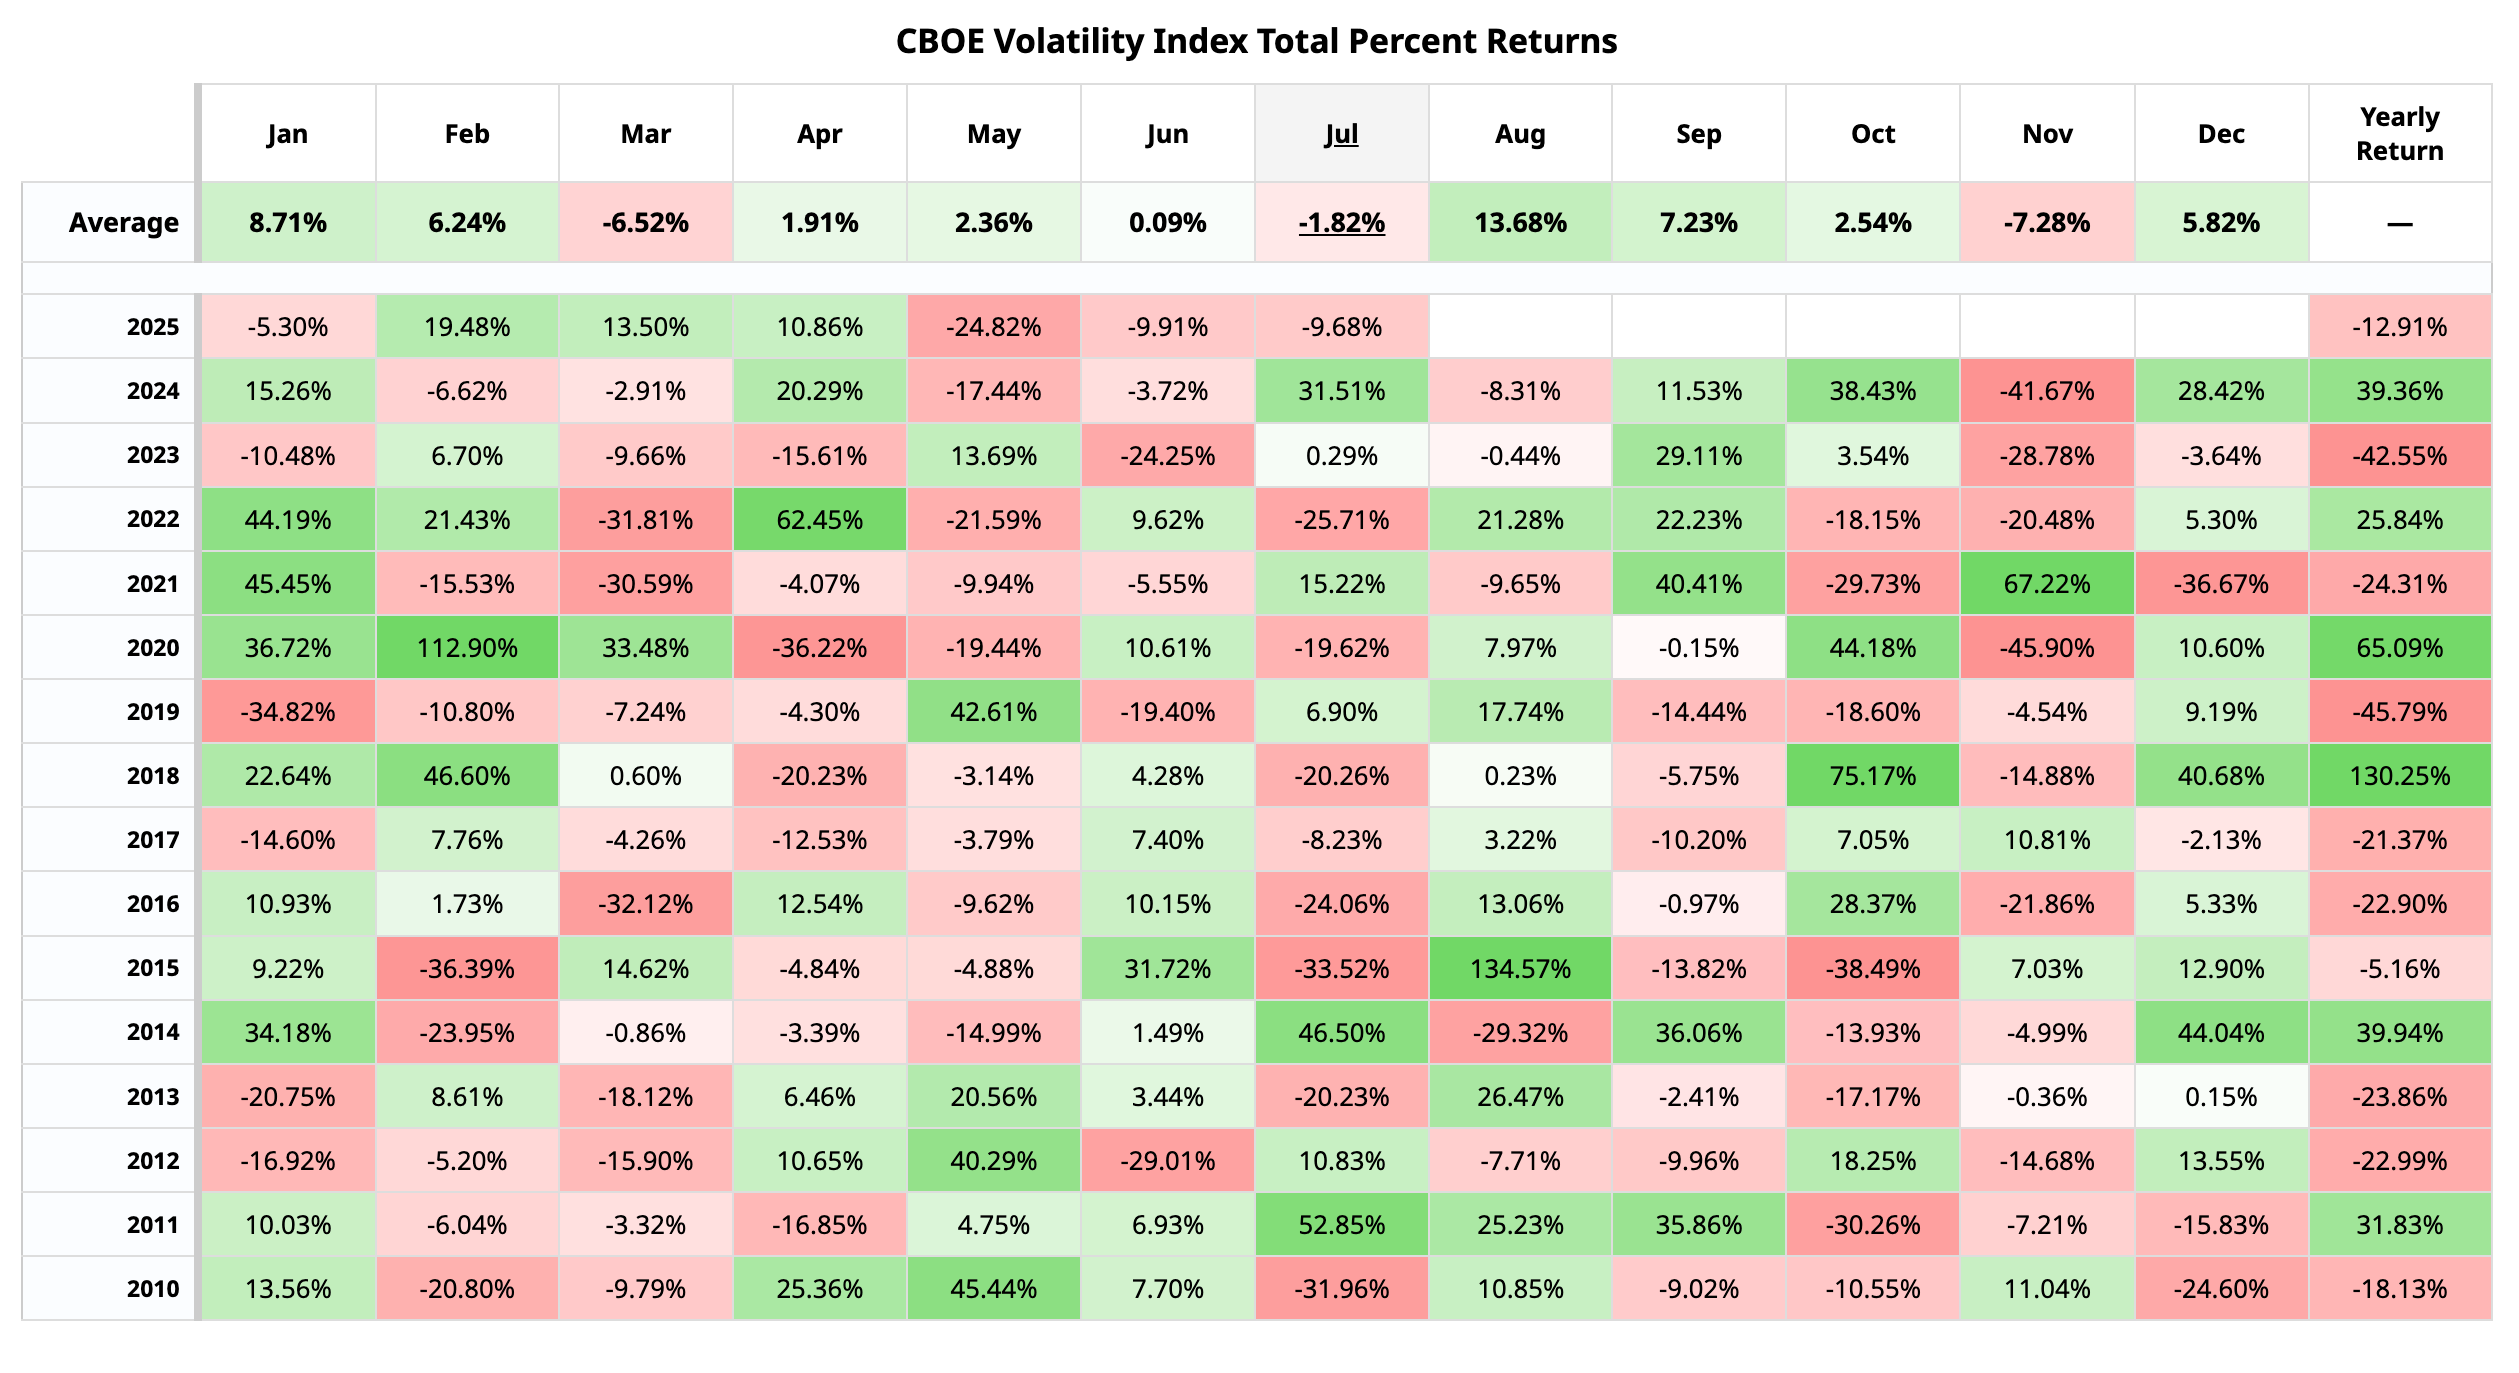
August stands out as having the highest average monthly gain, 13.68%, over the past 15 years, rising in 10 of those years, including a monumental 135% spike in 2015.
History repeating itself?
The VIX fell for a third straight month in July, extending the slide from April highs. It hit a five-month low of 14.92 on Friday, according to data source TradingView.
If history is a guide, this decline is likely setting the stage for the August boom in volatility and risk aversion on Wall Street. The VIX, which has been nicknamed the Fear Gauge, spikes higher when stock prices decline and falls when they rise.
In other words, the expected volatility boom on Wall Street could be marked by a stock market swoon, which could spill over into the bitcoin market.
Bitcoin tends to track the sentiment on Wall Street, especially in the technology stocks, fairly closely. BTC's implied volatility indices have developed a strong positive correlation with the VIX, signaling a steady evolution into VIX-like fear gauges. Since November, BTC's 30-day implied volatility indices have declined sharply, ending the positive correlation with the spot price.
Read: Bitcoin's 'Low Volatility' Rally From $70K to $118K: A Tale of Transition From Wild West to Wall Street-Like Dynamics