Bitcoin posted a price of $117,866 on July 17, 2025, supported by a market capitalization of $2.34 trillion and a robust 24-hour trading volume of $49.313 billion. The 24-hour intraday price range fluctuated between $117,715 and $120,008, highlighting continued volatility within a consolidating structure.
Bitcoin
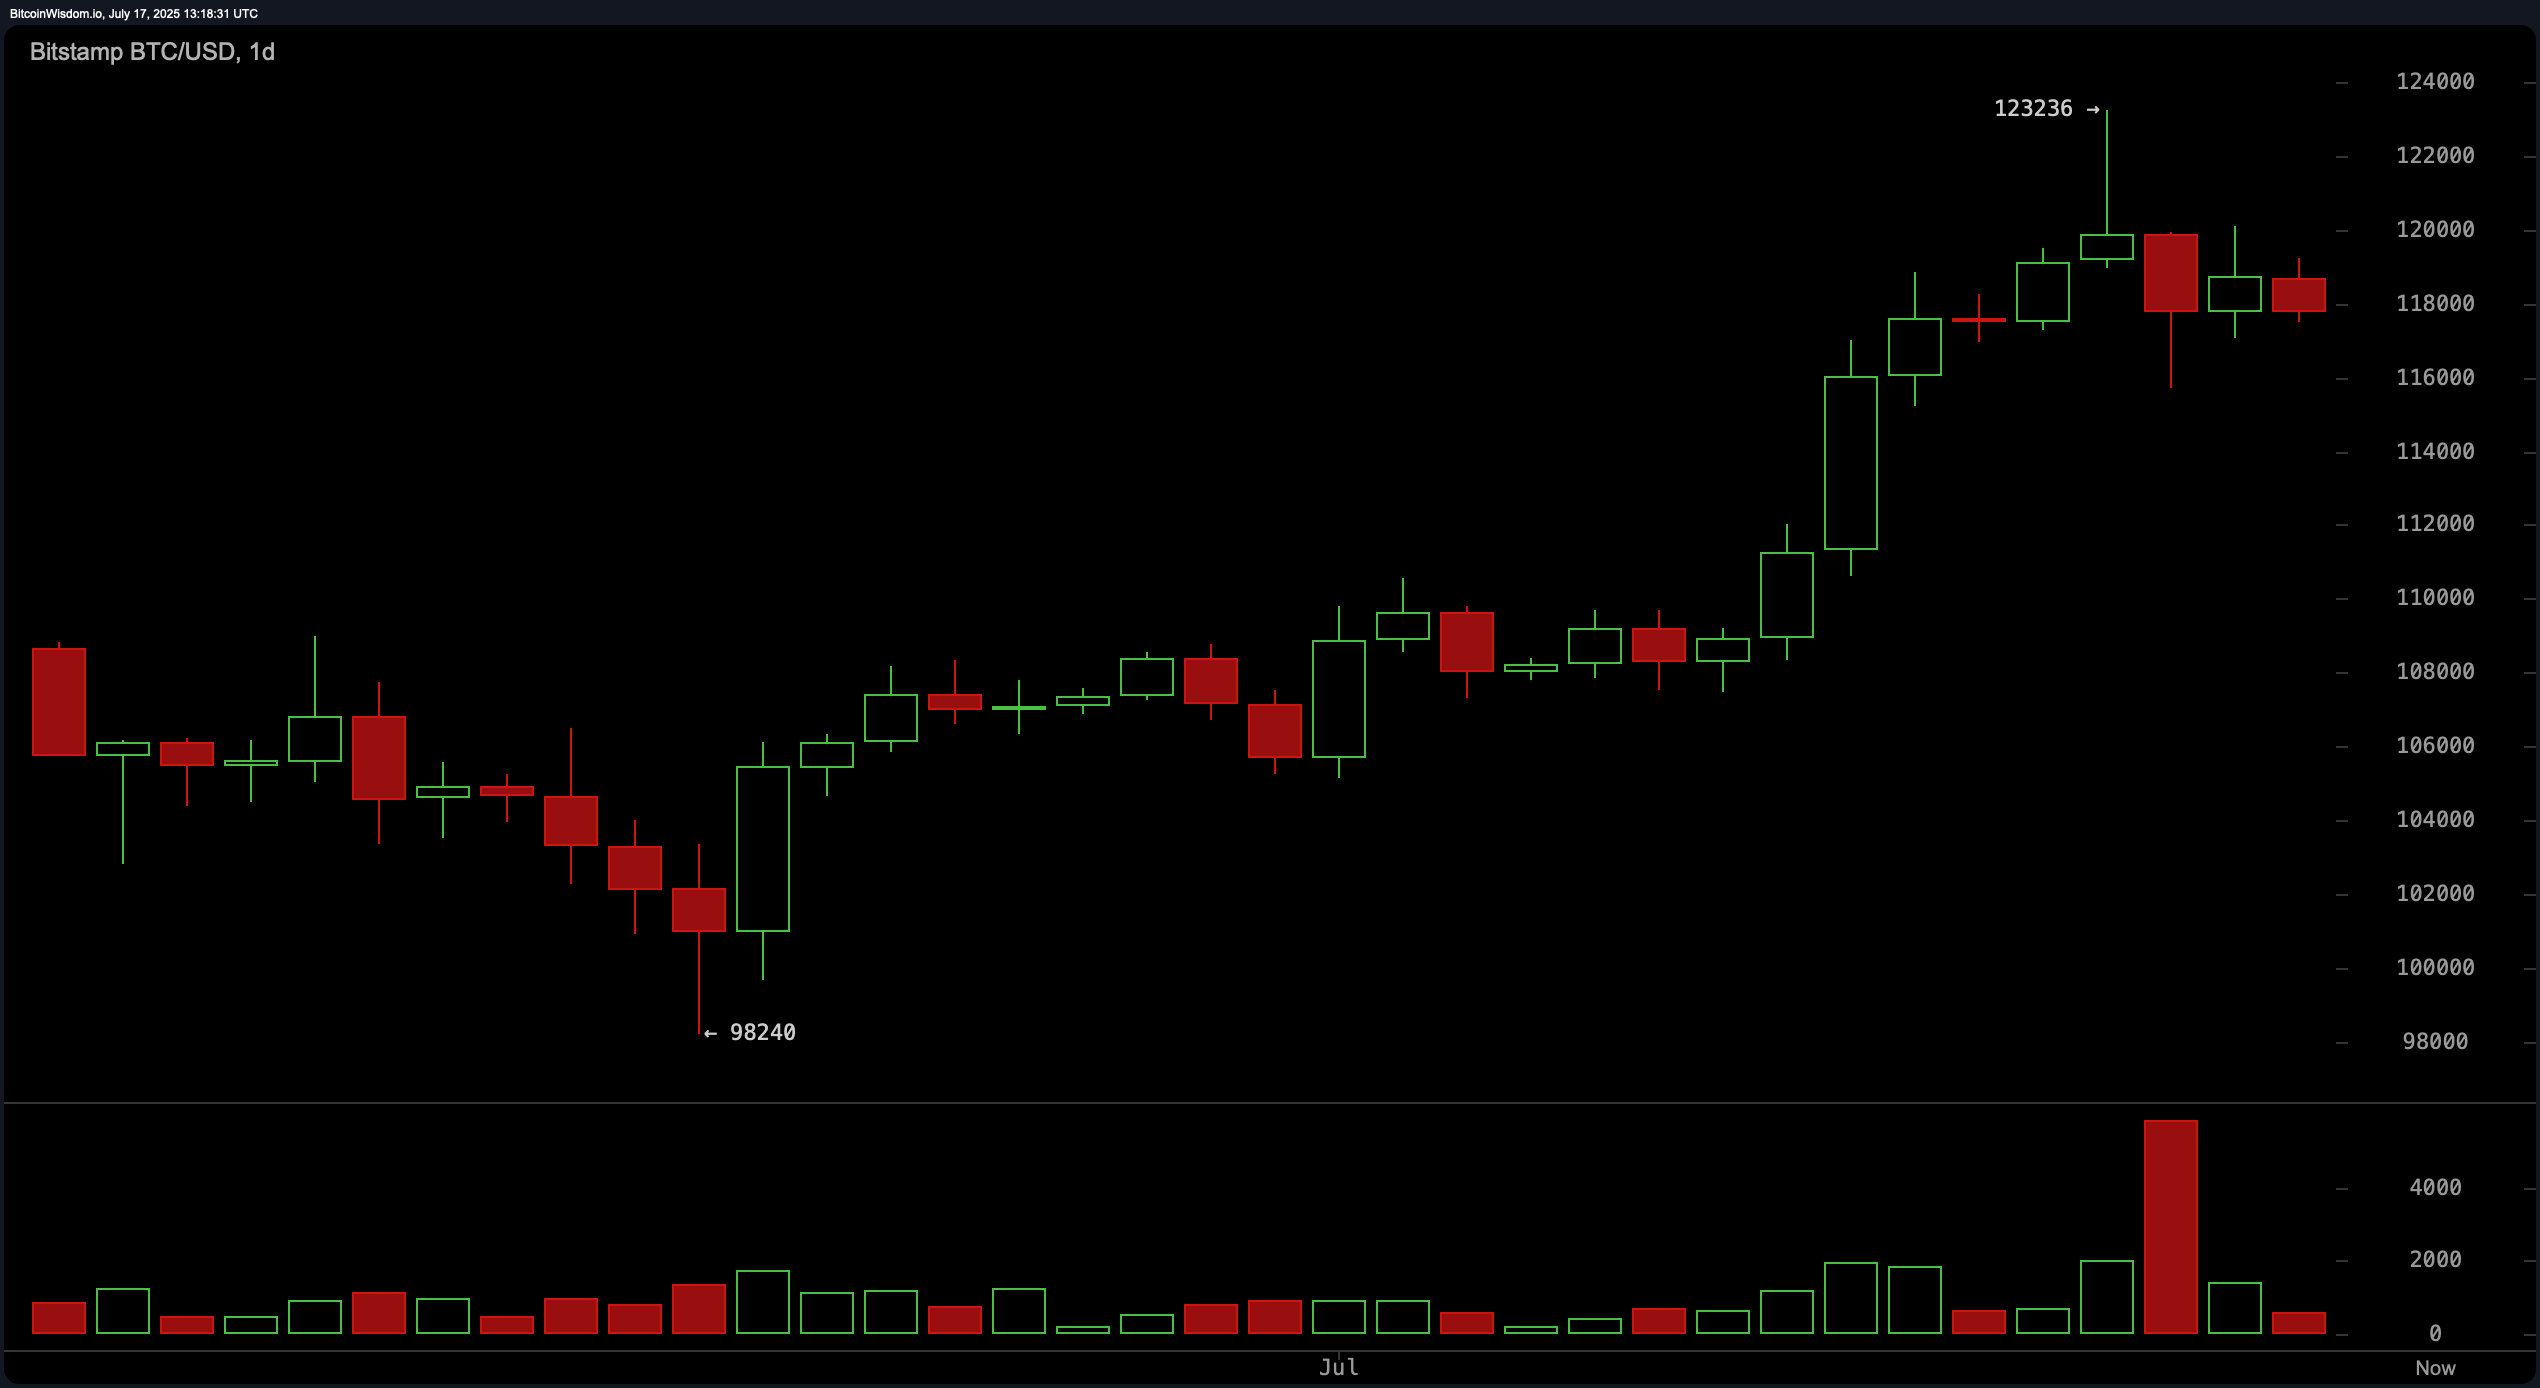
On the daily chart, bitcoin reversed from a recent low near $98,240 to establish a pronounced bullish trend, achieving a peak of $123,236 before facing notable selling pressure. The latest candlestick formations exhibit smaller bodies and a marked reduction in trading volume, suggesting the rally has transitioned into a period of consolidation or short-term cooling off. For risk-managed long positions, traders may consider entries on a pullback toward the previous breakout zone between $110,000 and $114,000, especially if new bullish reversal patterns develop. Resistance remains strong near $123,000, where heavy selling has previously occurred, making it a potential profit-taking zone.
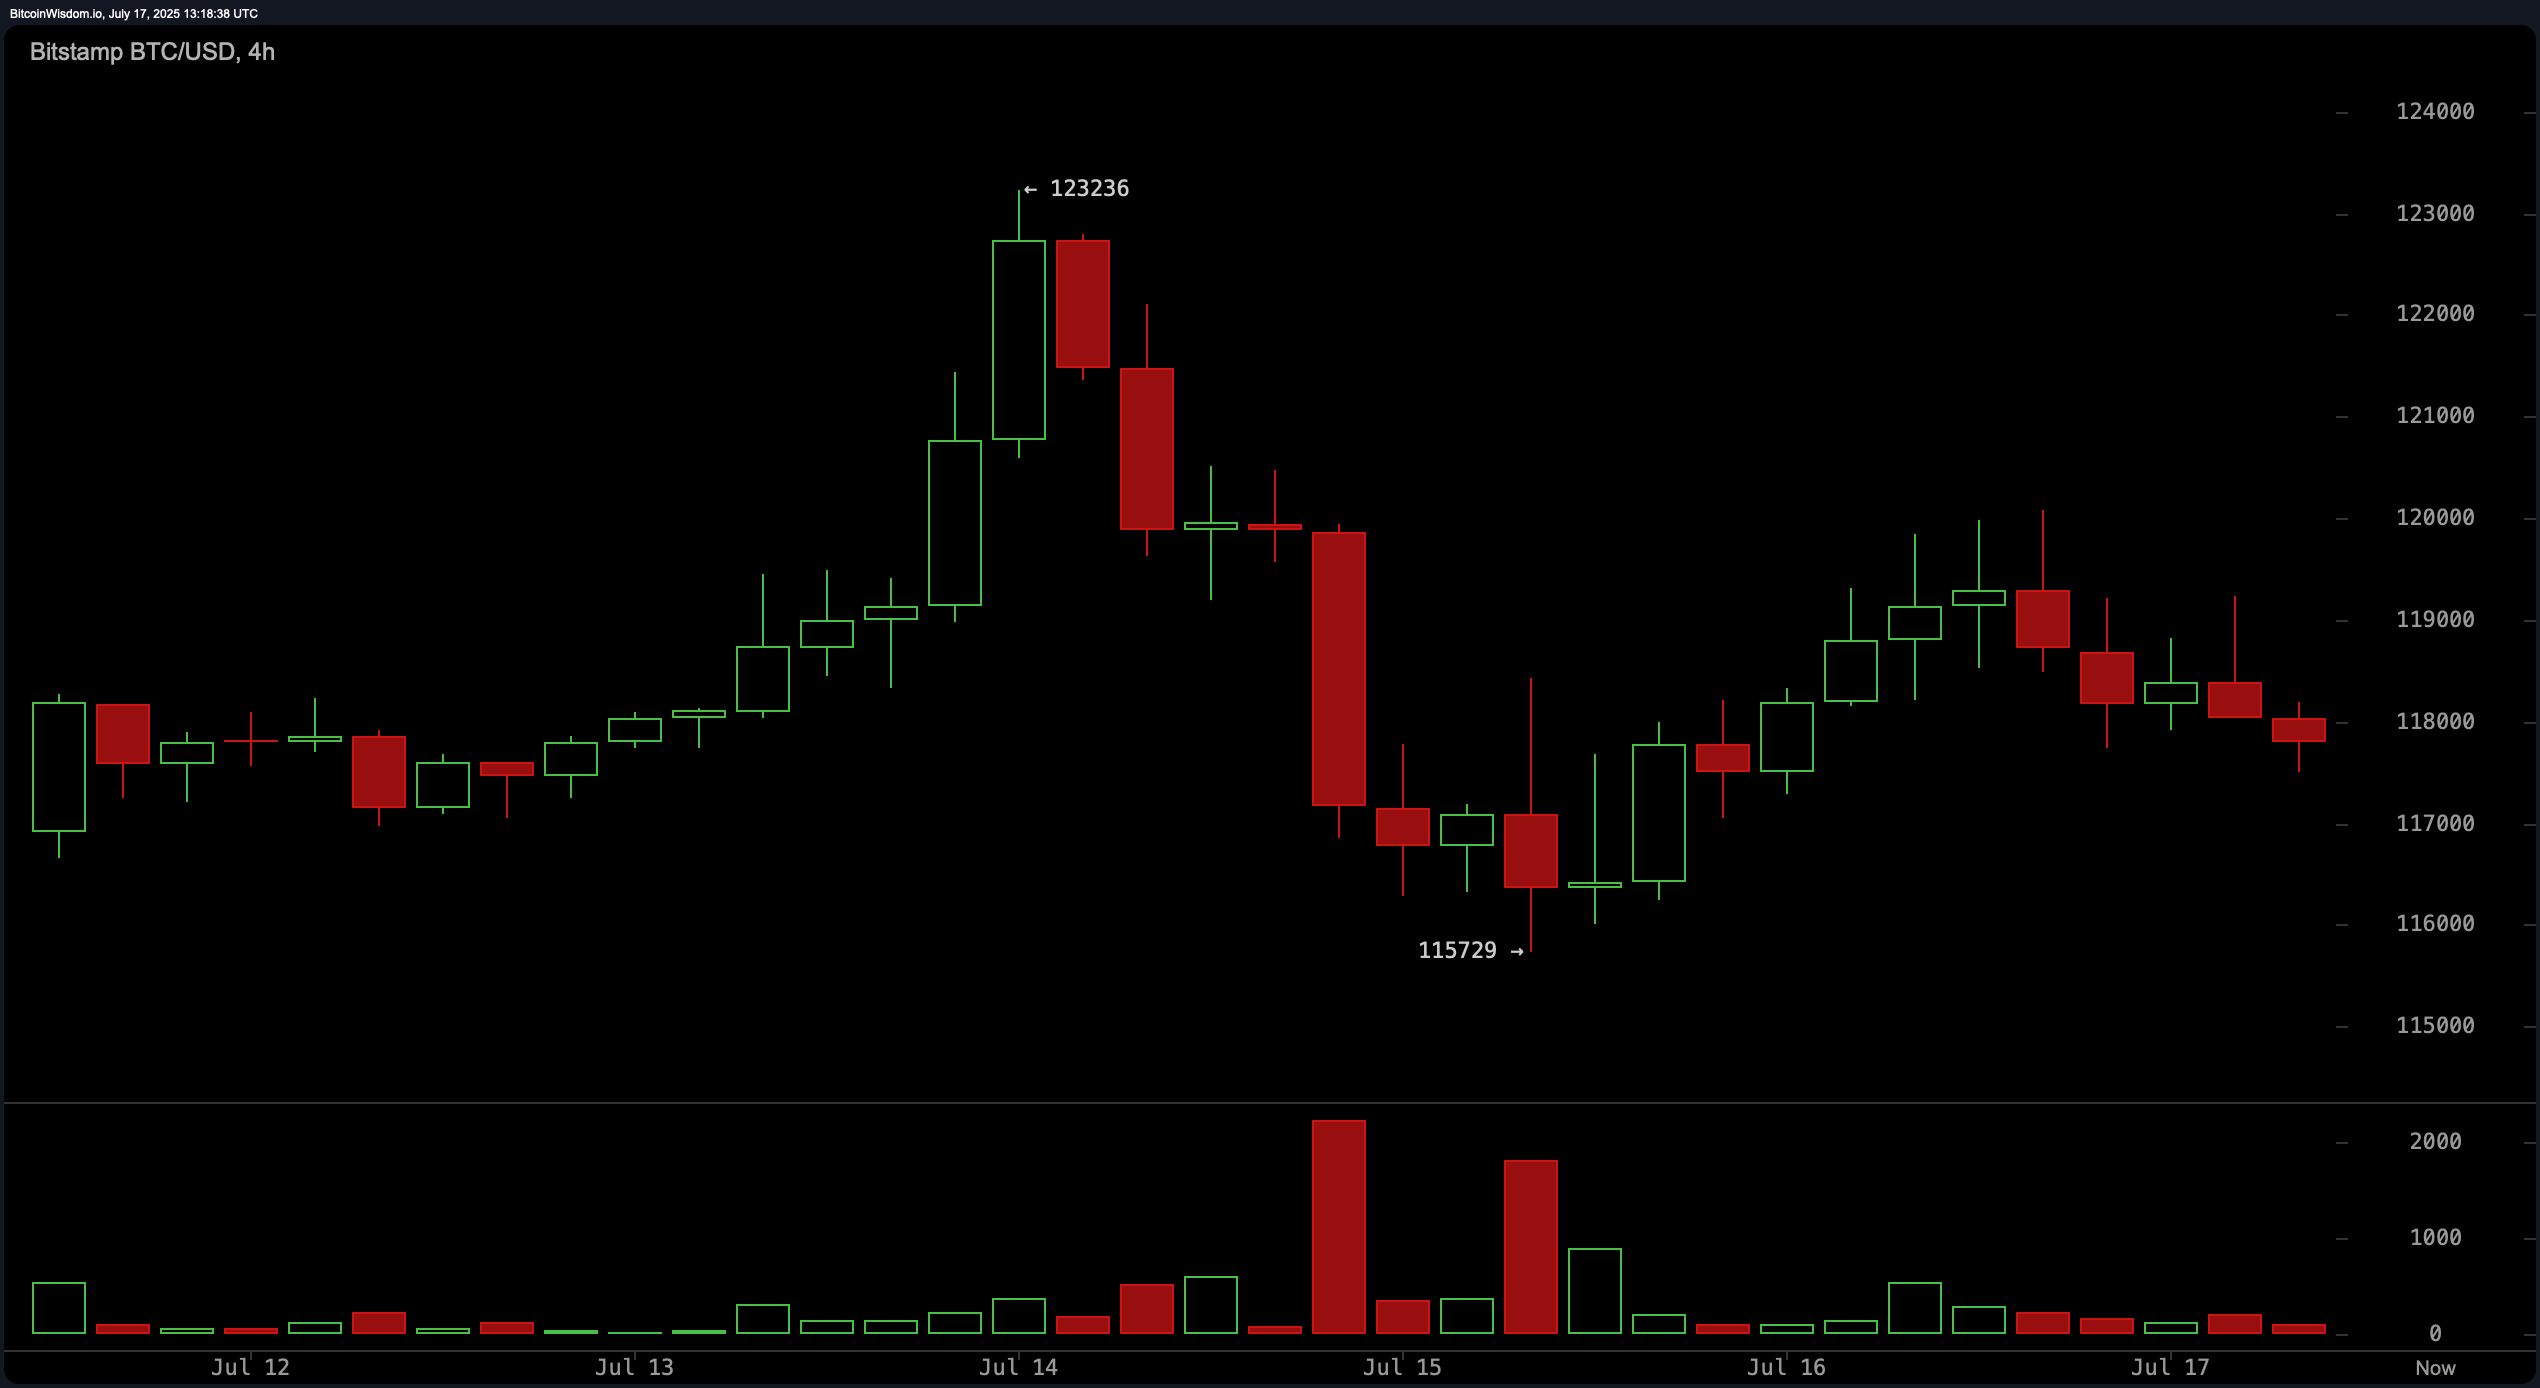
Analysis of the 4-hour bitcoin chart shows that bitcoin’s sharp uptrend reached a climax at $123,236, followed by a decisive reversal characterized by significant red candles and elevated selling activity. A temporary floor was found at $115,729, after which a modest rebound failed to break prior highs. The recent series of lower highs and lower lows points to weakening bullish momentum. Potential short-term long entries could arise if bitcoin holds above the $115,700–$116,000 support area, but profit targets should be set near $120,000–$121,000, where resistance is anticipated. Conversely, if price action fails at $119,000–$120,000 and forms bearish reversal signals, a deeper correction may follow.
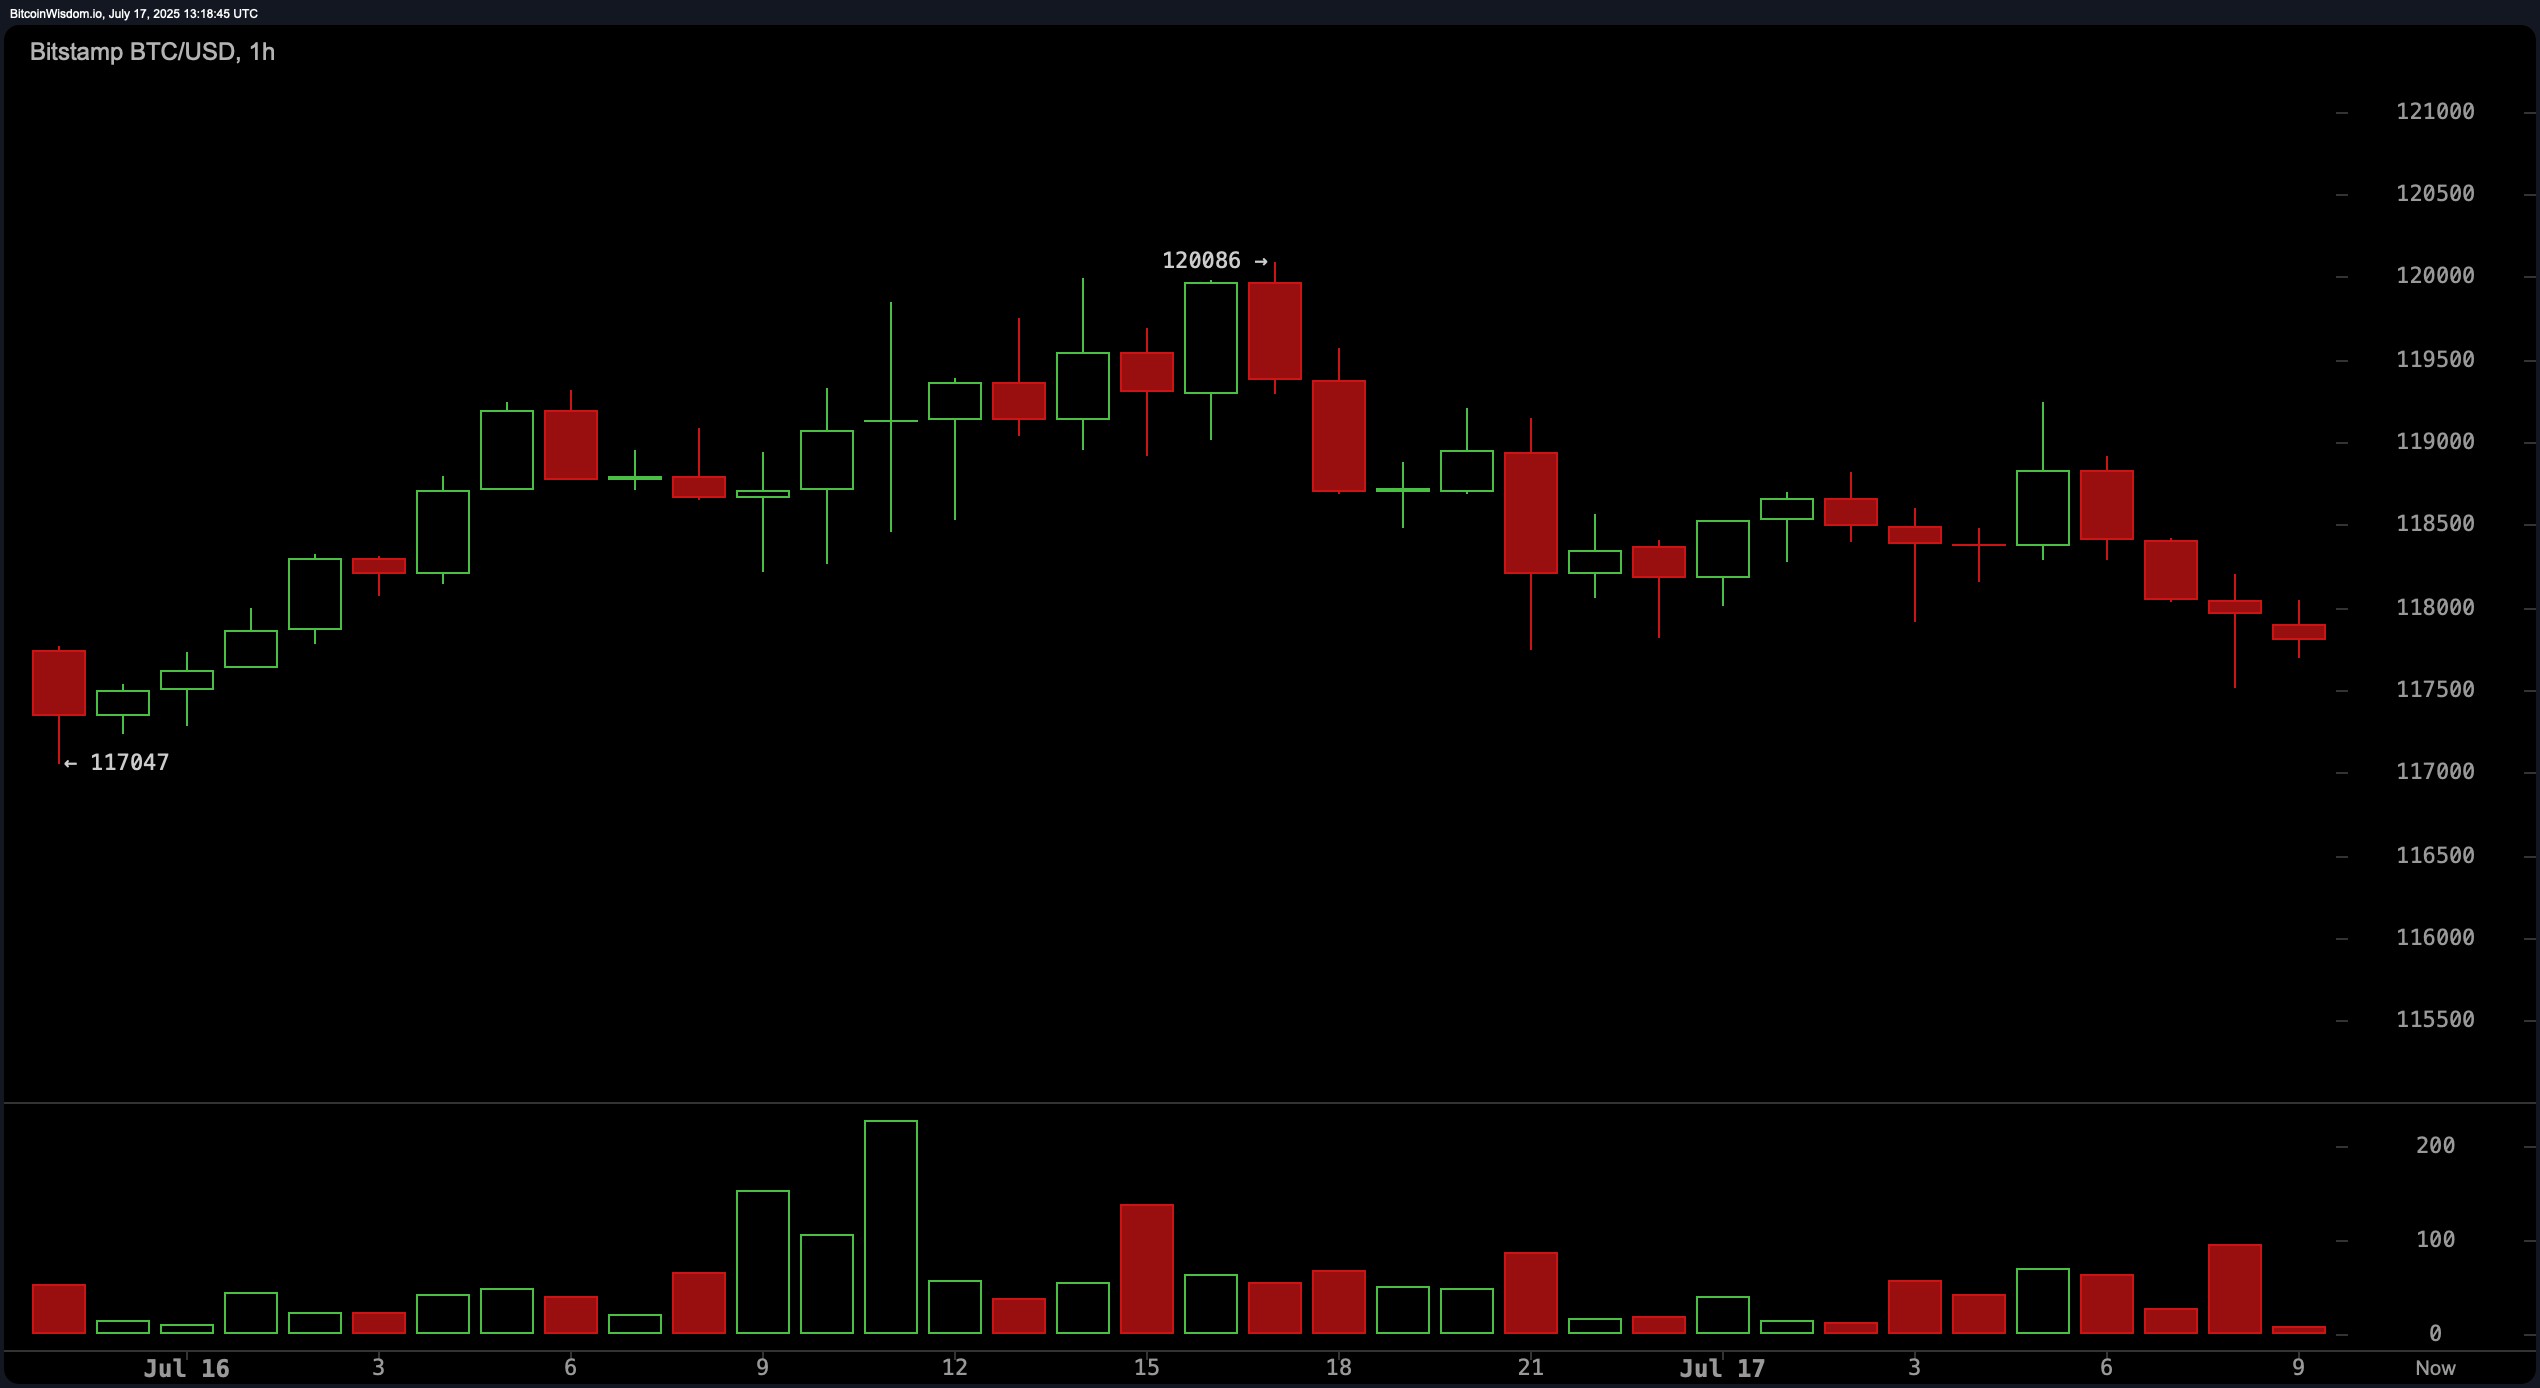
Turning to the 1-hour bitcoin chart, a rounded top pattern has emerged, with repeated failures to breach the $120,086 mark, which subsequently shifted momentum downward. Increasing selling volume coincided with the decline, and bitcoin is currently trending toward the $117,500–$118,000 support range. Scalping opportunities could exist if bullish reversal candles such as hammers or engulfing patterns form near $117,000–$117,500, with a short-term exit at the $119,000 resistance. A breakdown below $117,000 on strong volume may prompt an accelerated sell-off, favoring short continuation strategies.
Oscillator readings on the day offer a predominantly neutral outlook, with the relative strength index (RSI) at 66.0, Stochastic at 69.1, commodity channel index (CCI) at 87.3, average directional index (ADX) at 25.8, and the Awesome oscillator reading 9,679.9. The momentum indicator, however, is in bullish territory at 9,499.0, as is the moving average convergence divergence (MACD) at 3,333.0, indicating some underlying positive bias in the short-term despite broader signs of consolidation.
Moving averages (MAs) across all major periods—including the exponential moving average (EMA) and simple moving average (SMA) for 10, 20, 30, 50, 100, and 200 intervals—are aligned in a bullish mode. This suggests the longer-term trend remains bullish even as momentum appears to be waning in the lower timeframes. Key support is observed between $115,700 and $117,000, while resistance remains firm from $120,000 to $123,200. For now, bitcoin’s price action continues to consolidate, with decisive movement expected on a confirmed break of these critical levels.
Bull Verdict:
If bitcoin successfully defends the $115,700–$117,000 support zone and bullish signals re-emerge, the prevailing alignment of moving averages and momentum indicators suggests the broader uptrend could resume. A breakout above the $120,000–$123,200 resistance band would likely signal renewed buying strength, opening the door for a potential move toward new all-time highs.
Bear Verdict:
Should bitcoin lose support at $115,700 and selling pressure intensify, especially with bearish patterns confirmed on lower timeframes, a deeper correction could follow. This would invalidate the bullish structure and potentially lead to a retest of previous swing lows near $110,000 or even lower, as consolidation turns into an extended pullback.