After briefly retesting $107,500, the Bitcoin price today is back under pressure near $106,970 as bulls struggle to maintain momentum. A lack of follow-through above the key Fibonacci zone and continued resistance near $108,000 has capped upside attempts. The structure remains bullish overall, but signals of exhaustion are building.
What’s Happening With Bitcoin’s Price?
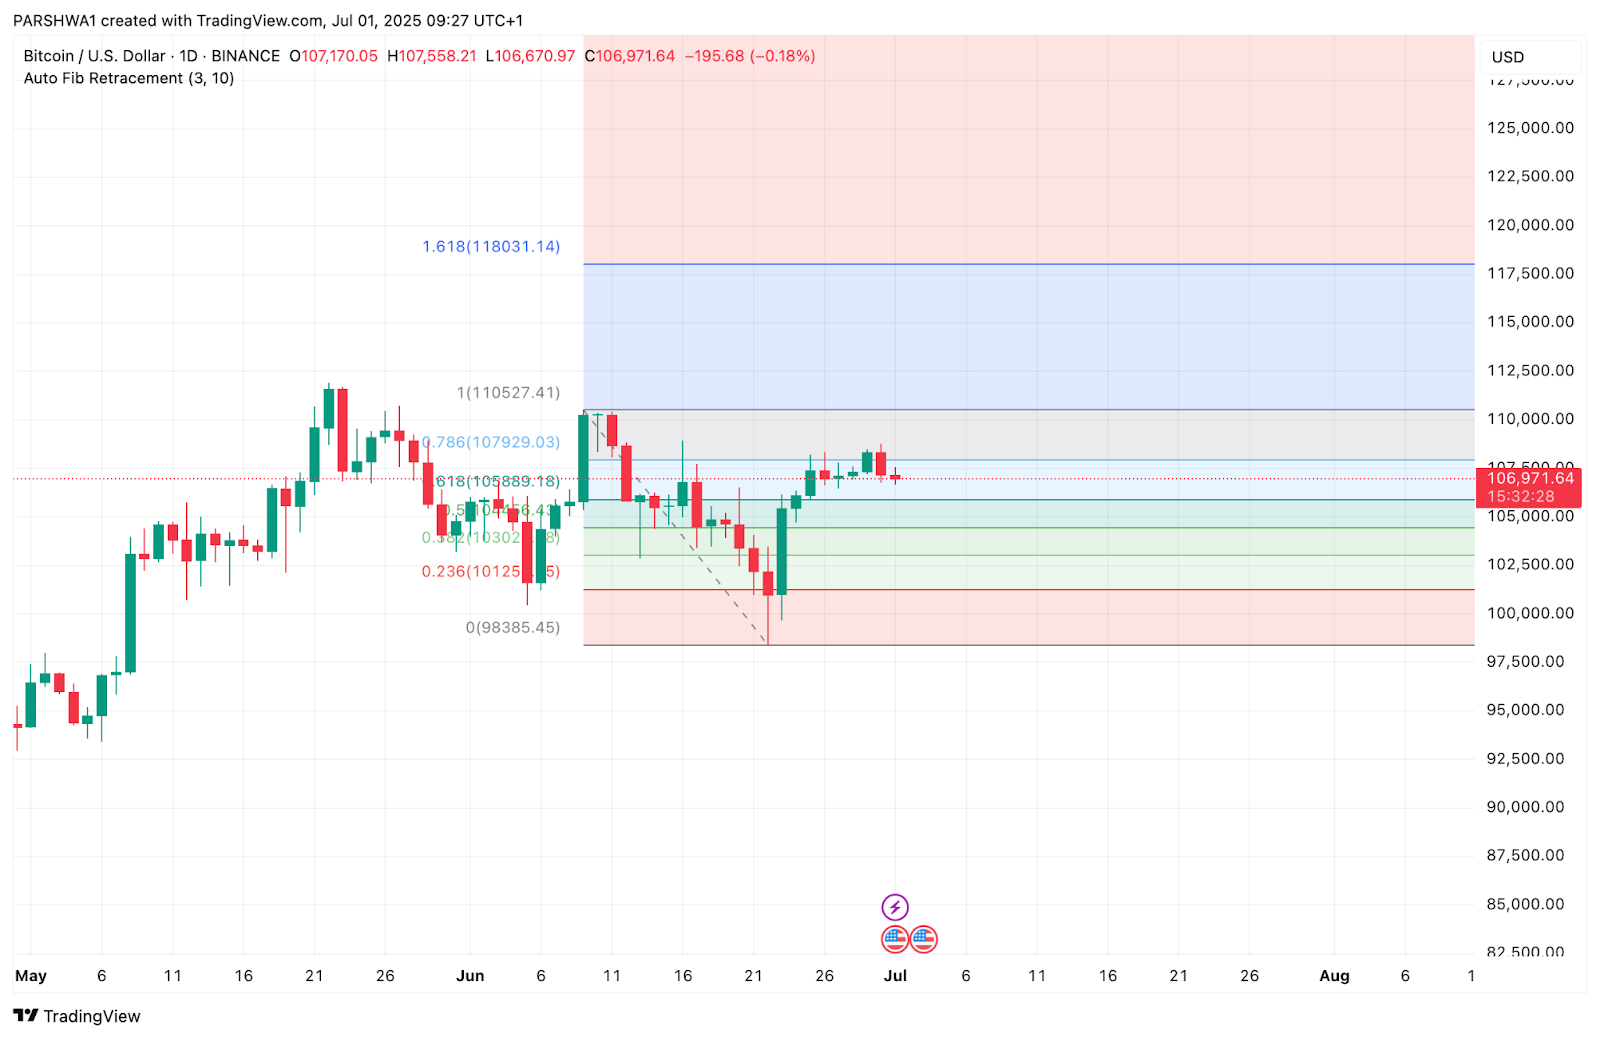
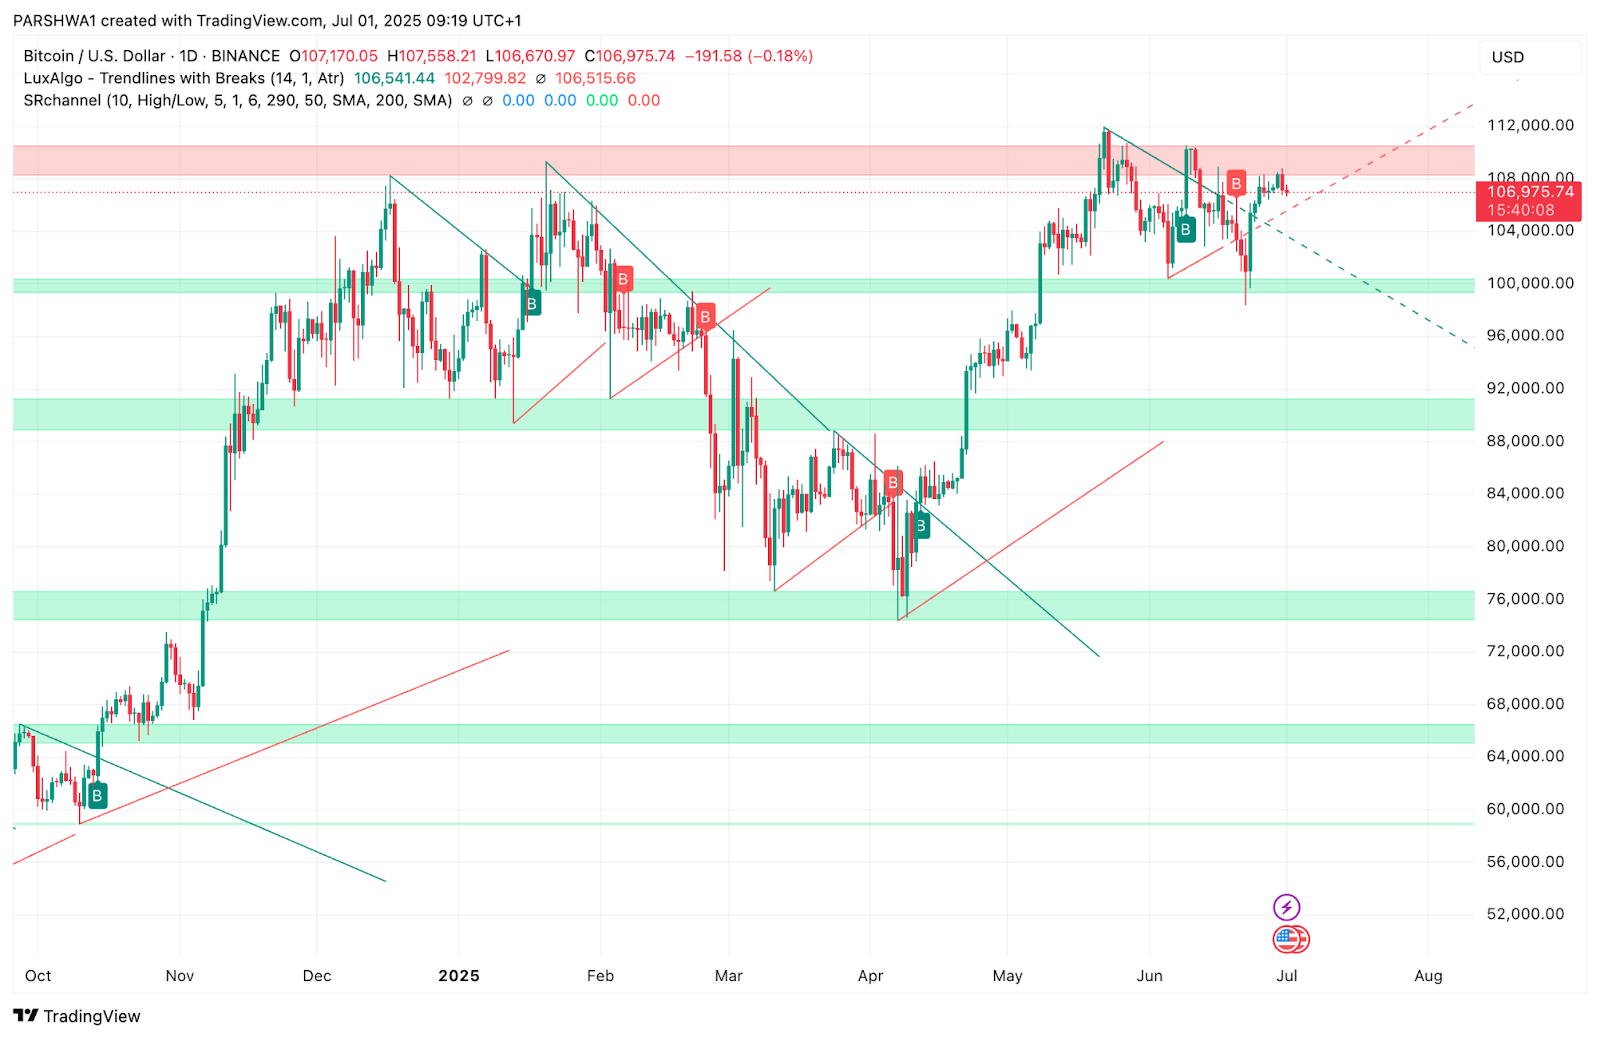
The daily chart shows Bitcoin price consolidating below the $108,000–$110,500 resistance band, which aligns with the 0.786 and 1.0 Fibonacci retracement levels. Price is still above the 0.618 Fib support at $105,889, keeping BTC in a neutral-to-bullish posture for now.
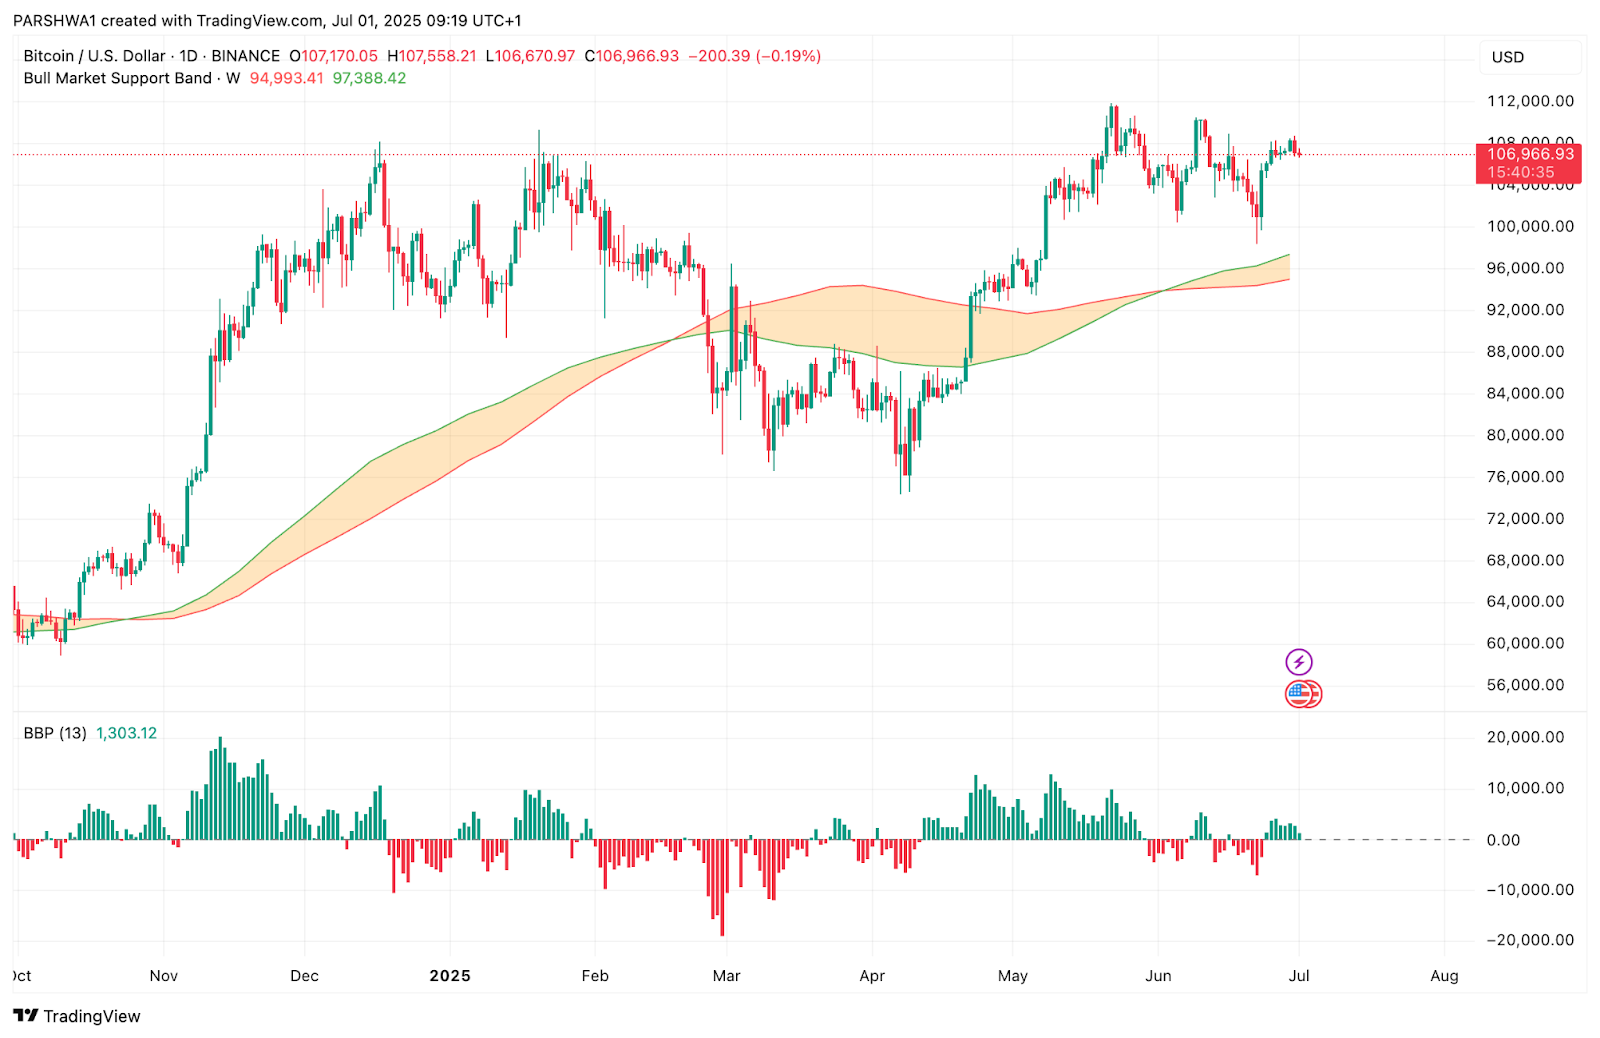
BTC remains above the Bull Market Support Band ($94,993–$97,388), with trend bias still favoring buyers in the broader outlook. However, momentum has slowed sharply over the past five sessions, and recent candles show small bodies and long upper wicks—indicating weakening bullish intent.
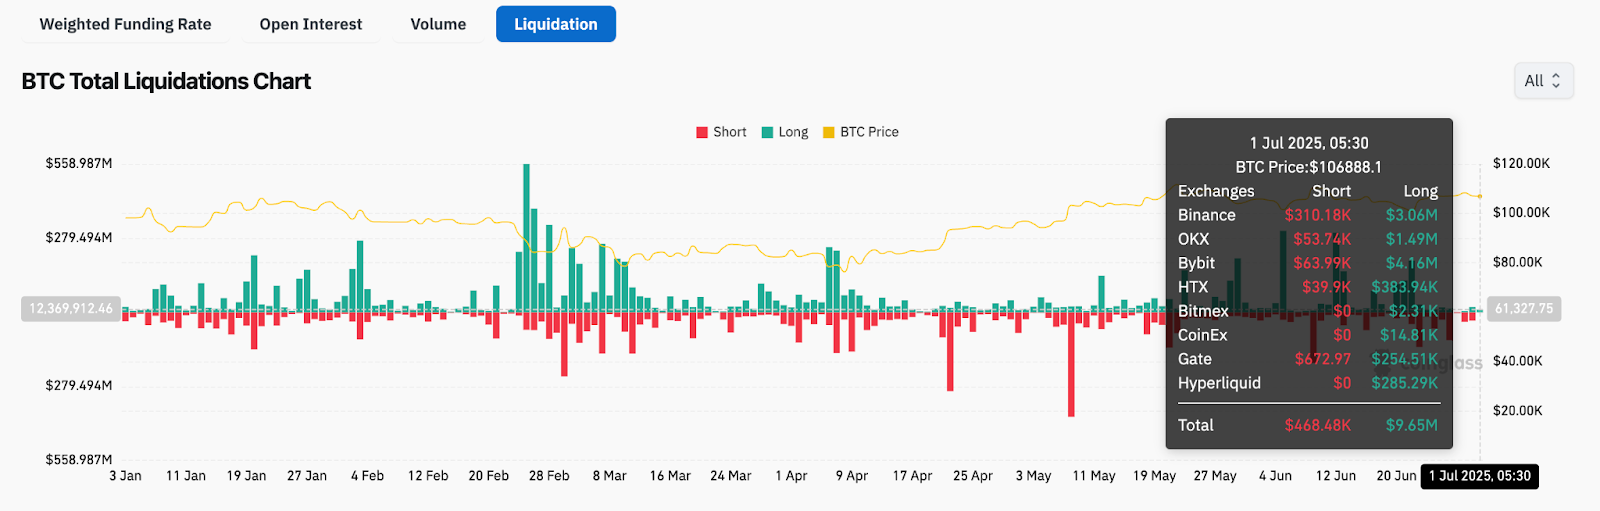
The liquidation chart shows over $9.6M in long positions wiped on July 1, with shorts reentering across exchanges. This imbalance hints at increased caution among bulls heading into a new session.
Why Is the Bitcoin Price Going Down Today?
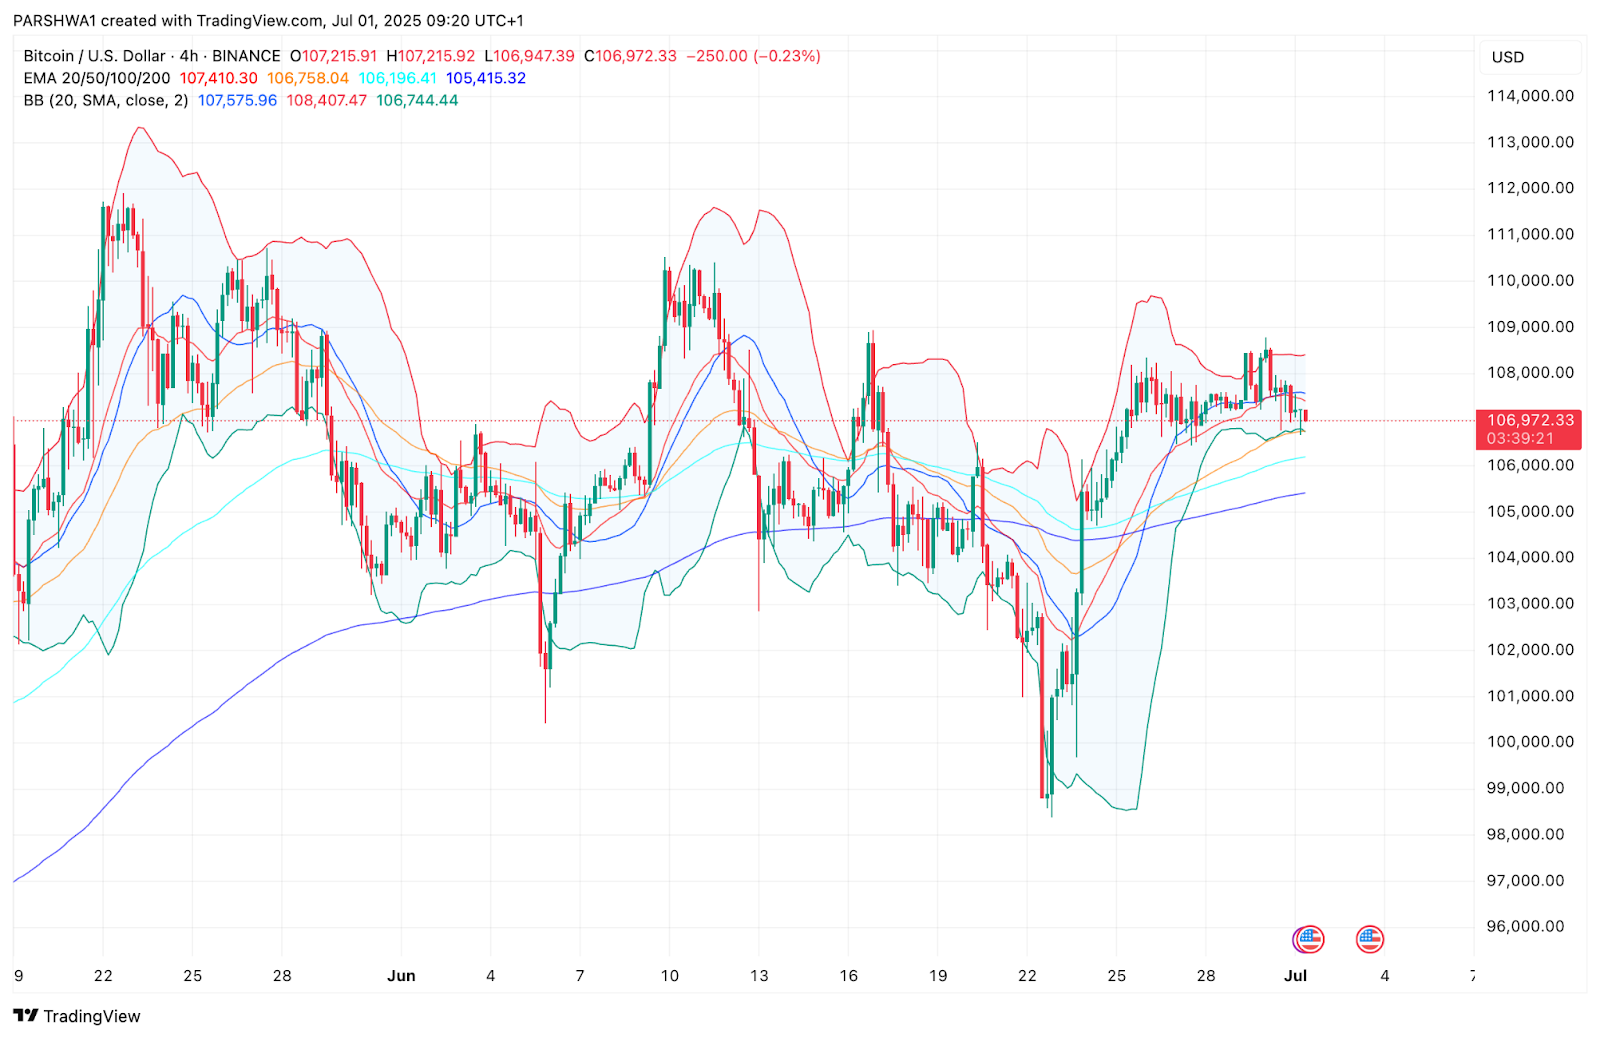
A mix of indicator rejection and liquidity dynamics explains why Bitcoin price going down today. The 4-hour chart reflects a key rejection from the $107,500–$108,400 resistance range, which includes the upper Bollinger Band and EMA 20–50 cluster. The failure to break above this area has allowed bears to regain temporary control.
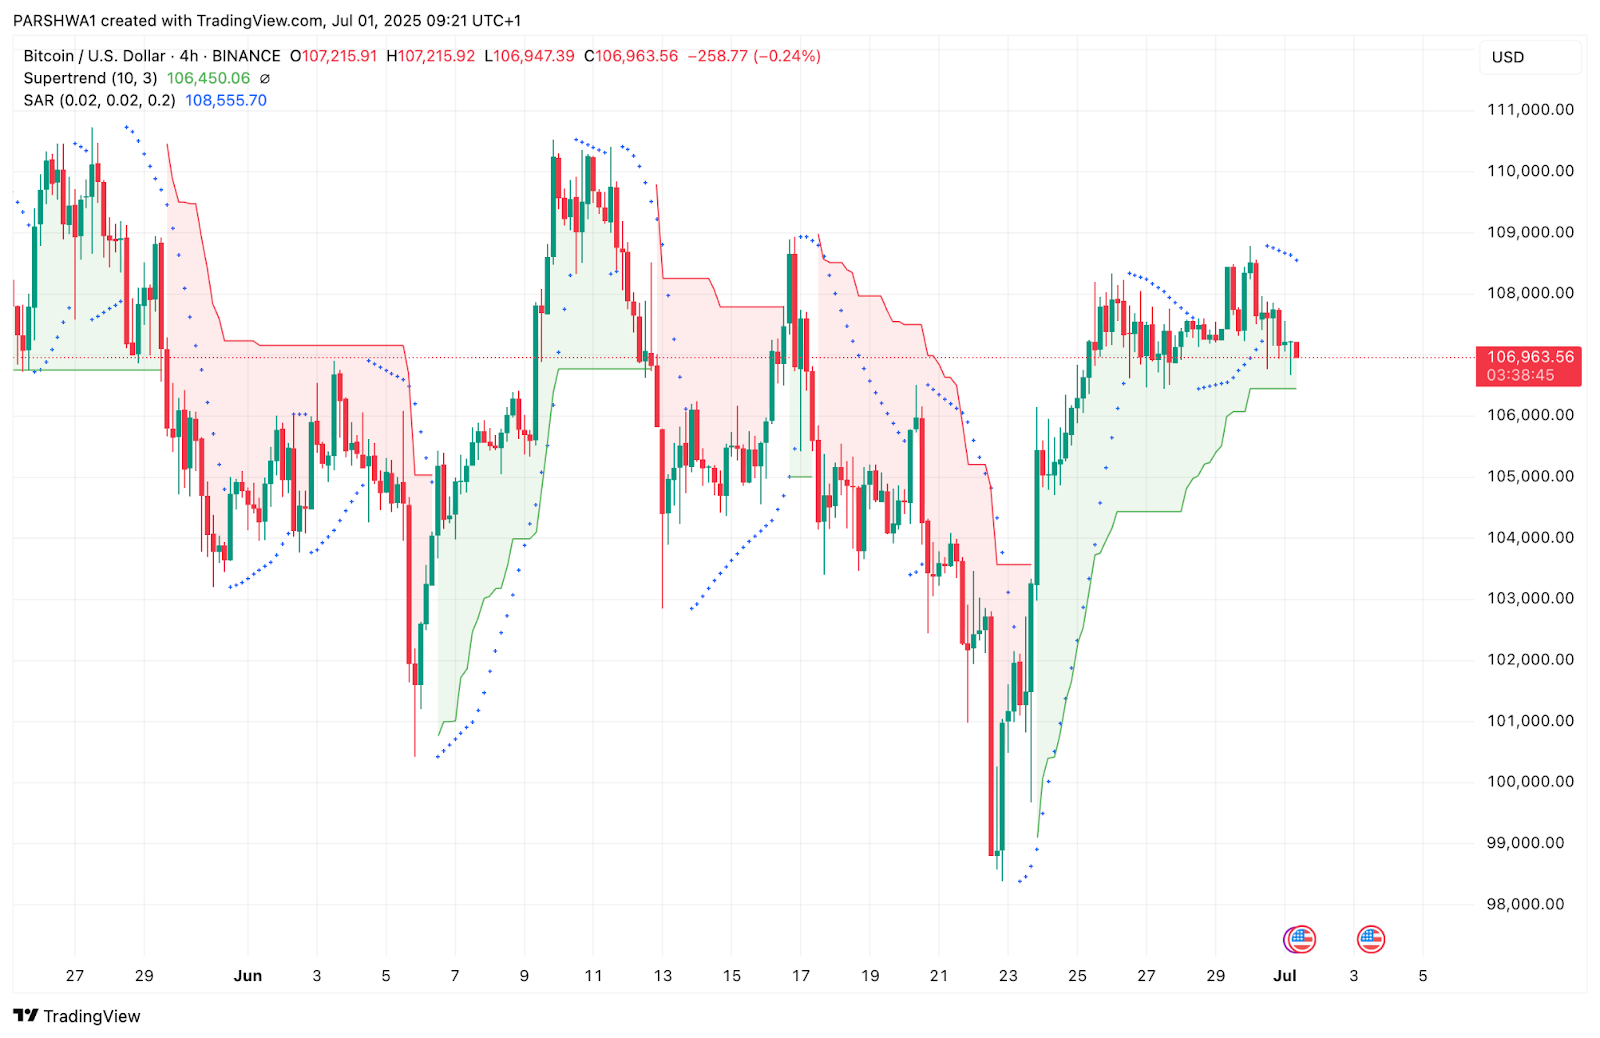
The Supertrend indicator flipped bearish on the 4-hour chart at $106,450, just as the Parabolic SAR dots reappeared above price. This confluence suggests growing downside pressure.
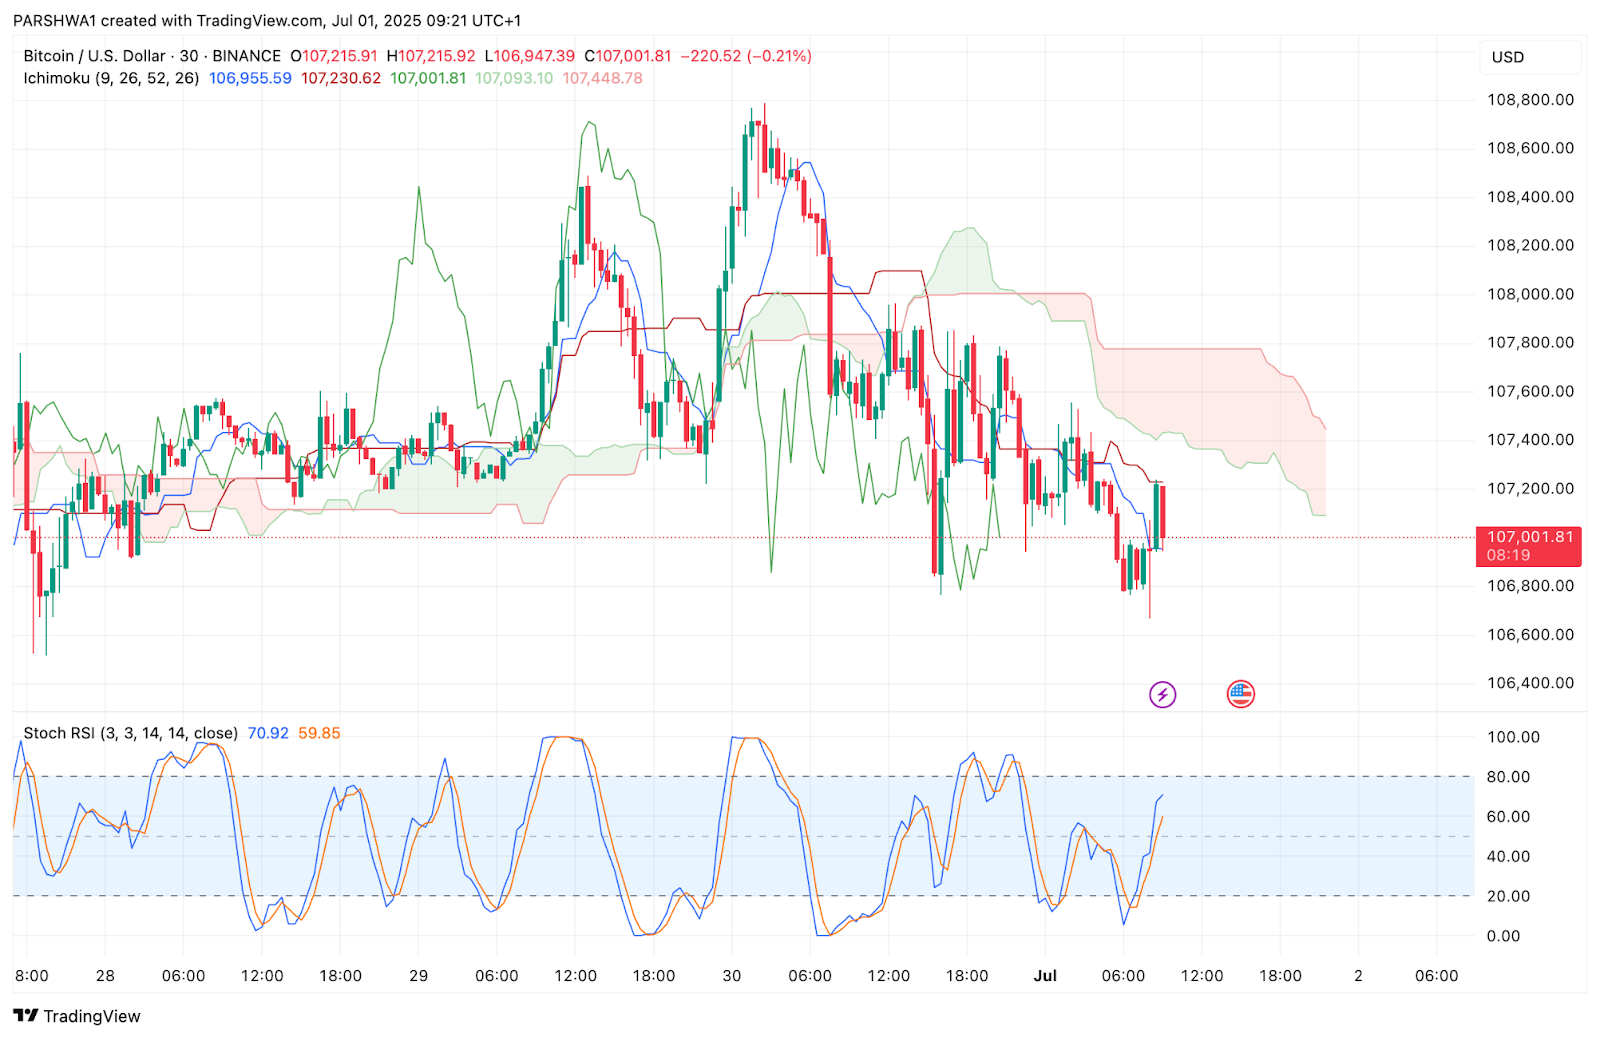
Meanwhile, the 30-minute Ichimoku Cloud shows BTC trading below the Tenkan and Kijun lines, inside the cloud—a classic signal of indecision and short-term stagnation. The Stoch RSI also shows a bearish crossover from overbought territory, pointing to declining momentum in the immediate timeframe.
BTC Structure Holds But Compression Signals Loom
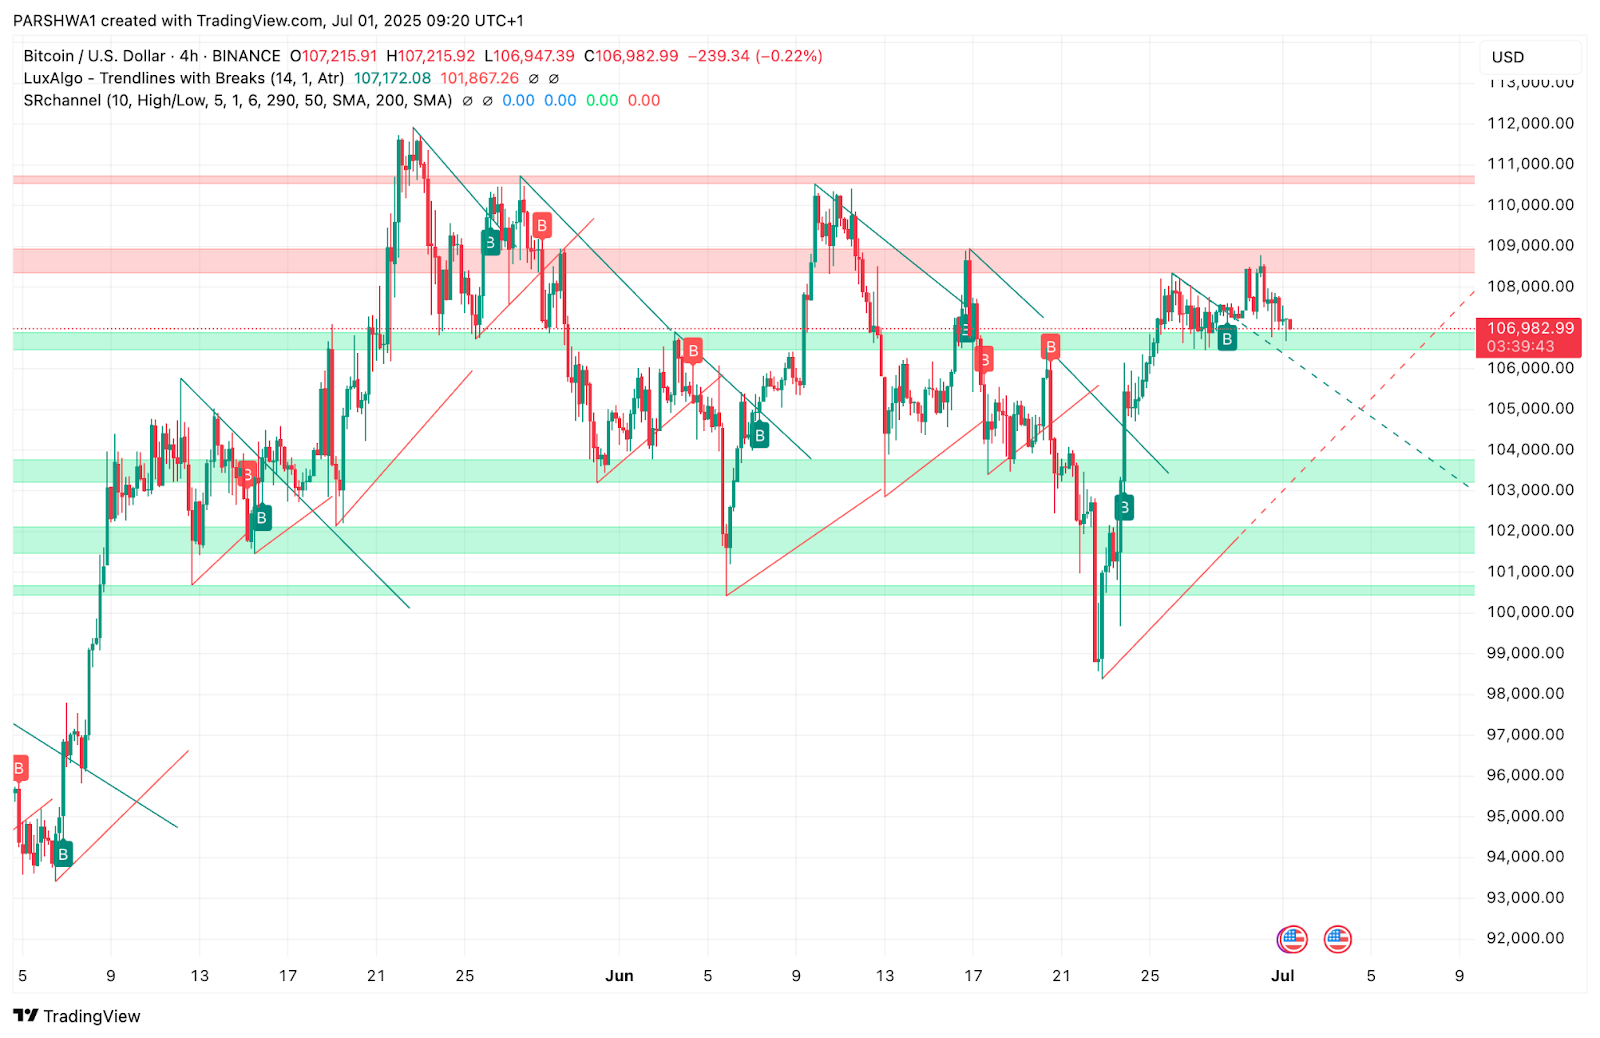
Despite the rejection, Bitcoin price action remains inside a broader bullish structure. The 4-hour chart shows that BTC has been printing higher lows since the June 24 low near $101,900. A bullish internal trendline continues to hold, with the next test expected near $106,000 if current pressure continues.
On the daily timeframe, BTC remains supported above a key demand zone near $105,000, which aligns with both the 0.618 Fibonacci level and the breakout retest zone from June 21. This range has historically absorbed downside pressure, but repeated failures to break $108,000 raise the risk of a deeper retest.
The Bollinger Bands on the 4-hour chart are narrowing, which typically precedes a volatility expansion. Given BTC’s coiling structure, a breakout could occur as early as July 2, with direction likely dictated by a daily close above $108,500 or below $105,500.
Bitcoin Price Prediction: Short-Term Outlook (24h)
The Bitcoin price update suggests BTC is preparing for a decisive move. If bulls reclaim $107,500 with a high-volume breakout, the next leg could target $110,500 and $118,000, the 1.0 and 1.618 Fibonacci extensions respectively.
On the downside, failure to hold above $105,500 could expose $103,200 and then $101,250, the 0.382 and 0.236 Fib levels. A daily close below $105,000 would invalidate the current short-term bullish bias.
With trend signals flattening, traders should focus on the $105,500–$107,500 pivot band for confirmation.
Bitcoin Price Forecast Table: July 2, 2025
| Indicator/Zone | Level (USD) | Signal |
| Resistance 1 | $107,500 | Upper range resistance, BB top |
| Resistance 2 | $110,500 | Fib 1.0 level, key breakout zone |
| Support 1 | $105,500 | Fib 0.618 and EMA support |
| Support 2 | $103,200 | Fib 0.382 retracement |
| EMA 20/50/100/200 (4H) | 106,758 / 106,196 | Price between short EMAs |
| RSI (Stoch, 30-min) | Bearish Crossover | Momentum fading |
| Supertrend (4H) | $106,450 | Bearish bias if under this level |
| Ichimoku Cloud (30-min) | Inside/Below | Indecision, no clear direction |
| Bollinger Band Width (4H) | Tight | Volatility breakout likely |
| Bull Market Support Band | $94,993–$97,388 | Macro bullish floor |
Disclaimer: The information presented in this article is for informational and educational purposes only. The article does not constitute financial advice or advice of any kind. Coin Edition is not responsible for any losses incurred as a result of the utilization of content, products, or services mentioned. Readers are advised to exercise caution before taking any action related to the company.