Bitcoin is trading at $107,059, with a market capitalization of $2.12 trillion and a 24-hour trade volume of $27.75 billion. The digital asset has seen an intraday range between $105,030 and $107,219, indicating modest volatility amid signs of recovery across multiple timeframes.
Bitcoin
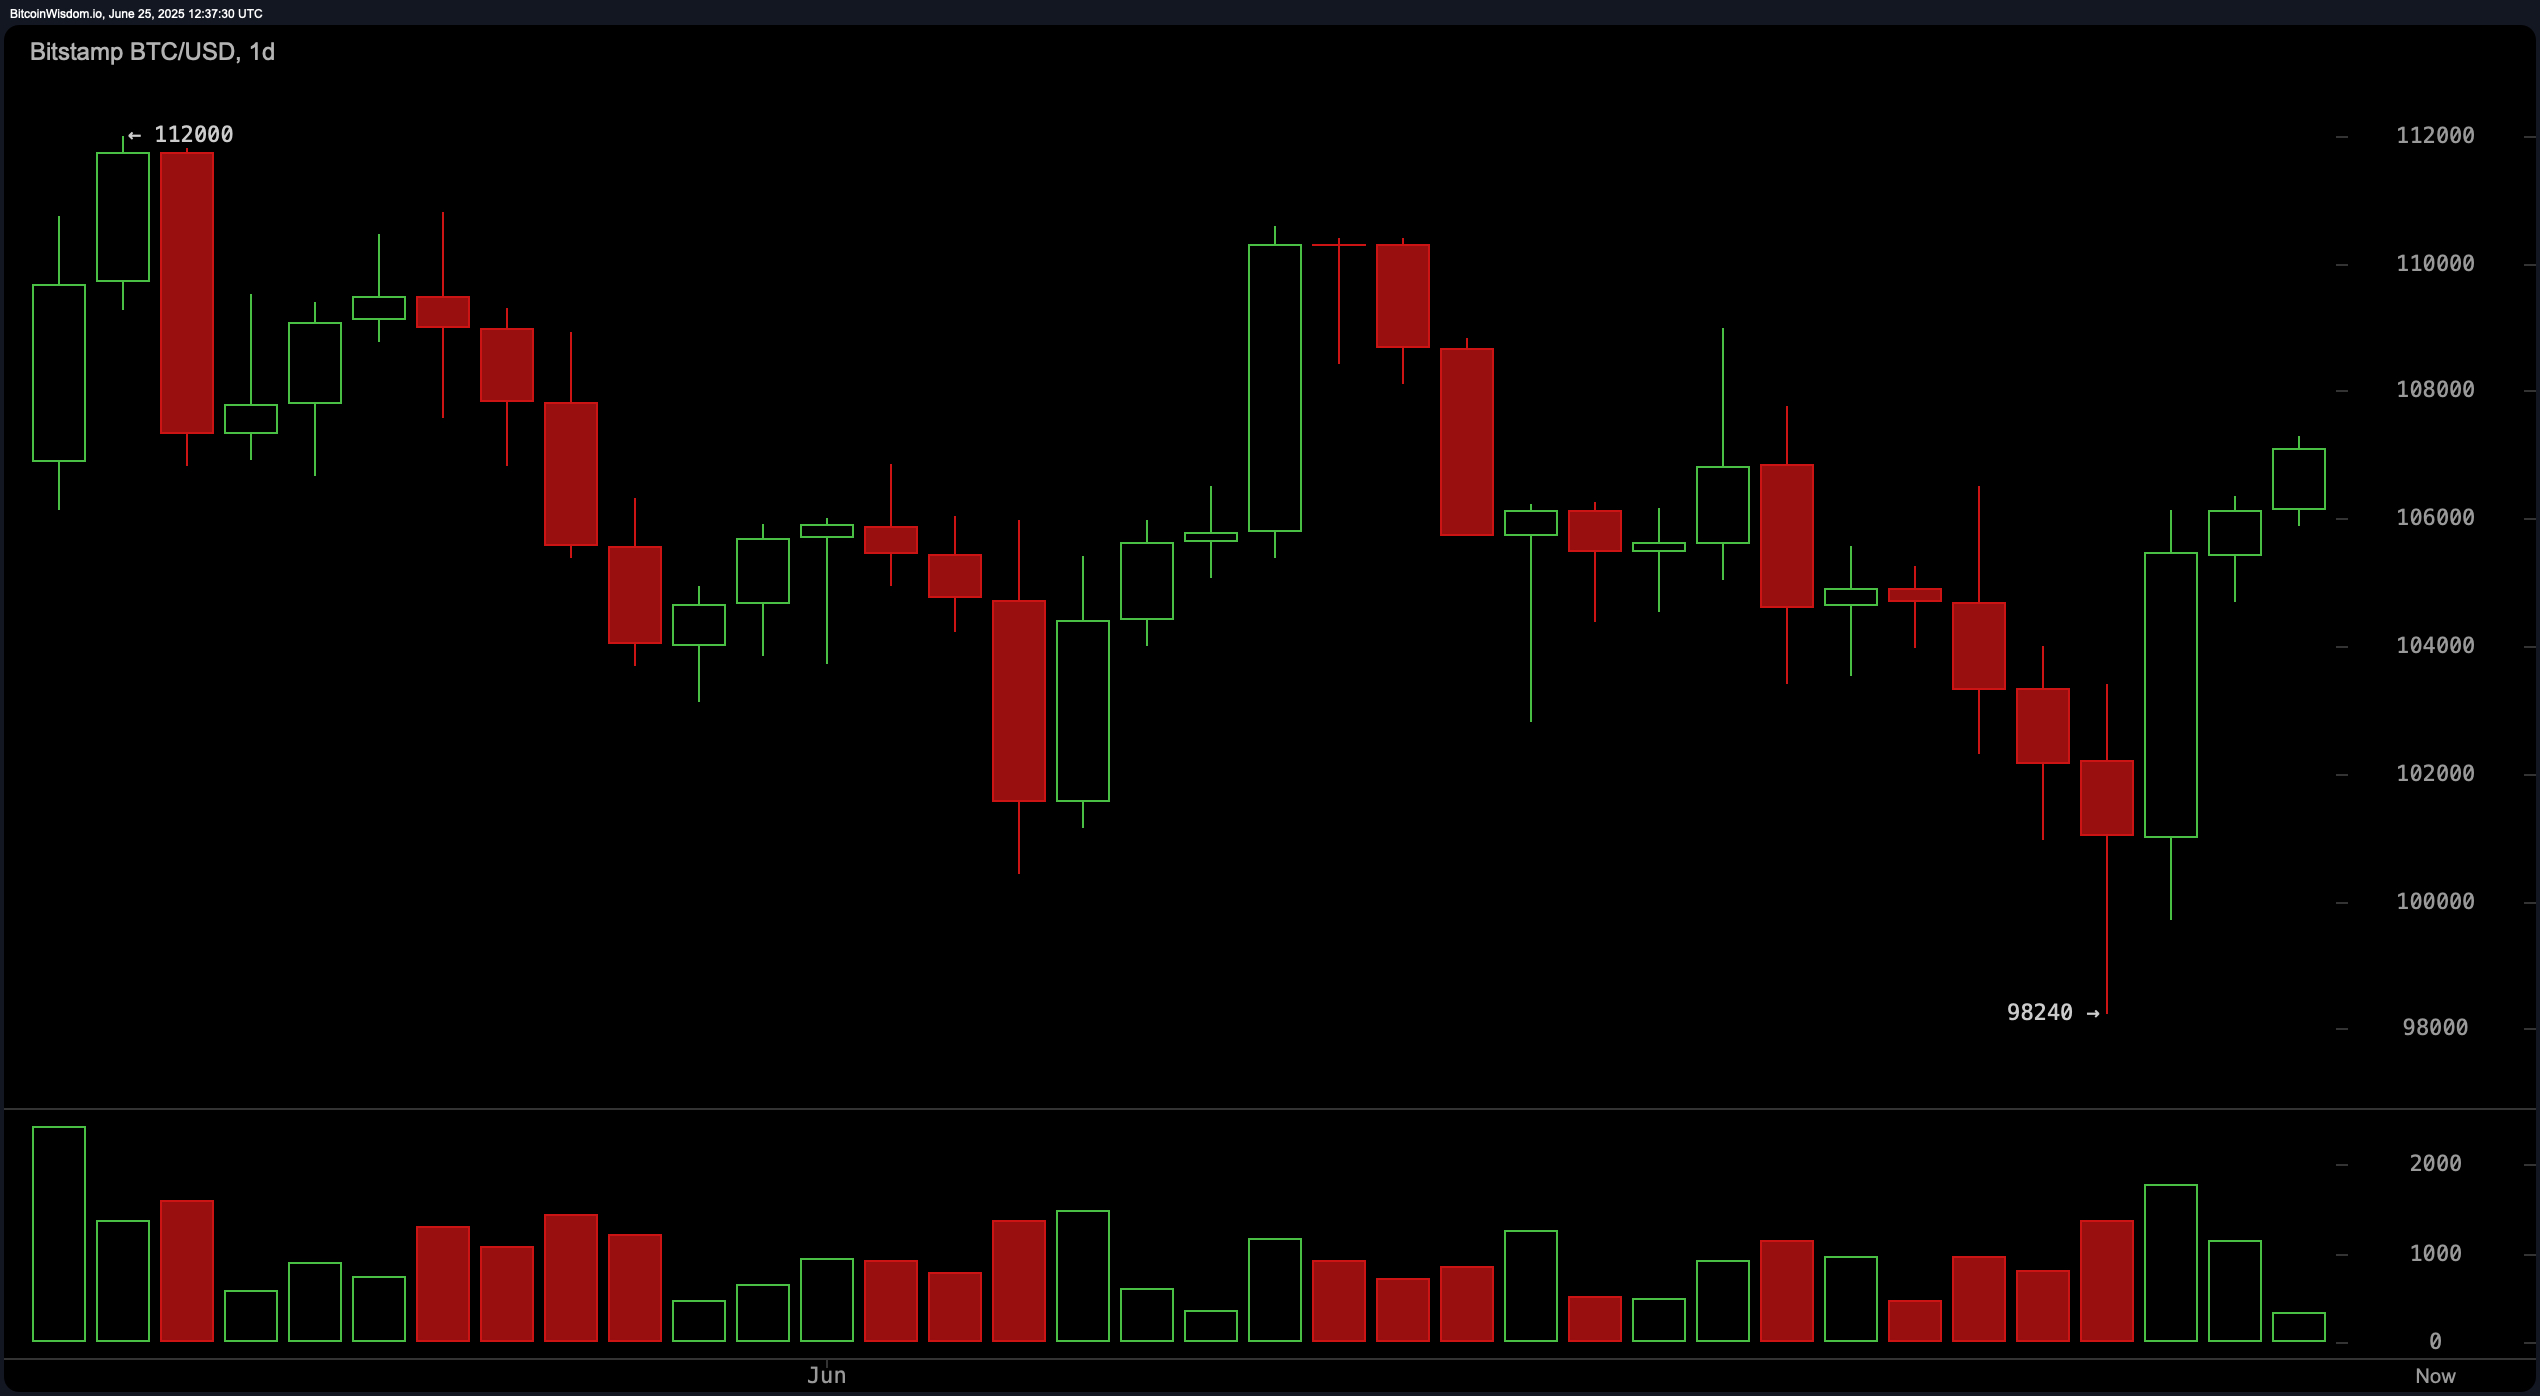
From the daily chart, bitcoin has staged a notable rebound from a recent low of $98,240, recovering past $106,000 after a sharp selloff that brought heavy volume. The subsequent bullish engulfing candlestick pattern signals a potential continuation of upward momentum. Support remains solid at $98,240, with resistance near the $112,000 mark. While buyer volume remains cautious, the price structure suggests strengthening control by bulls.
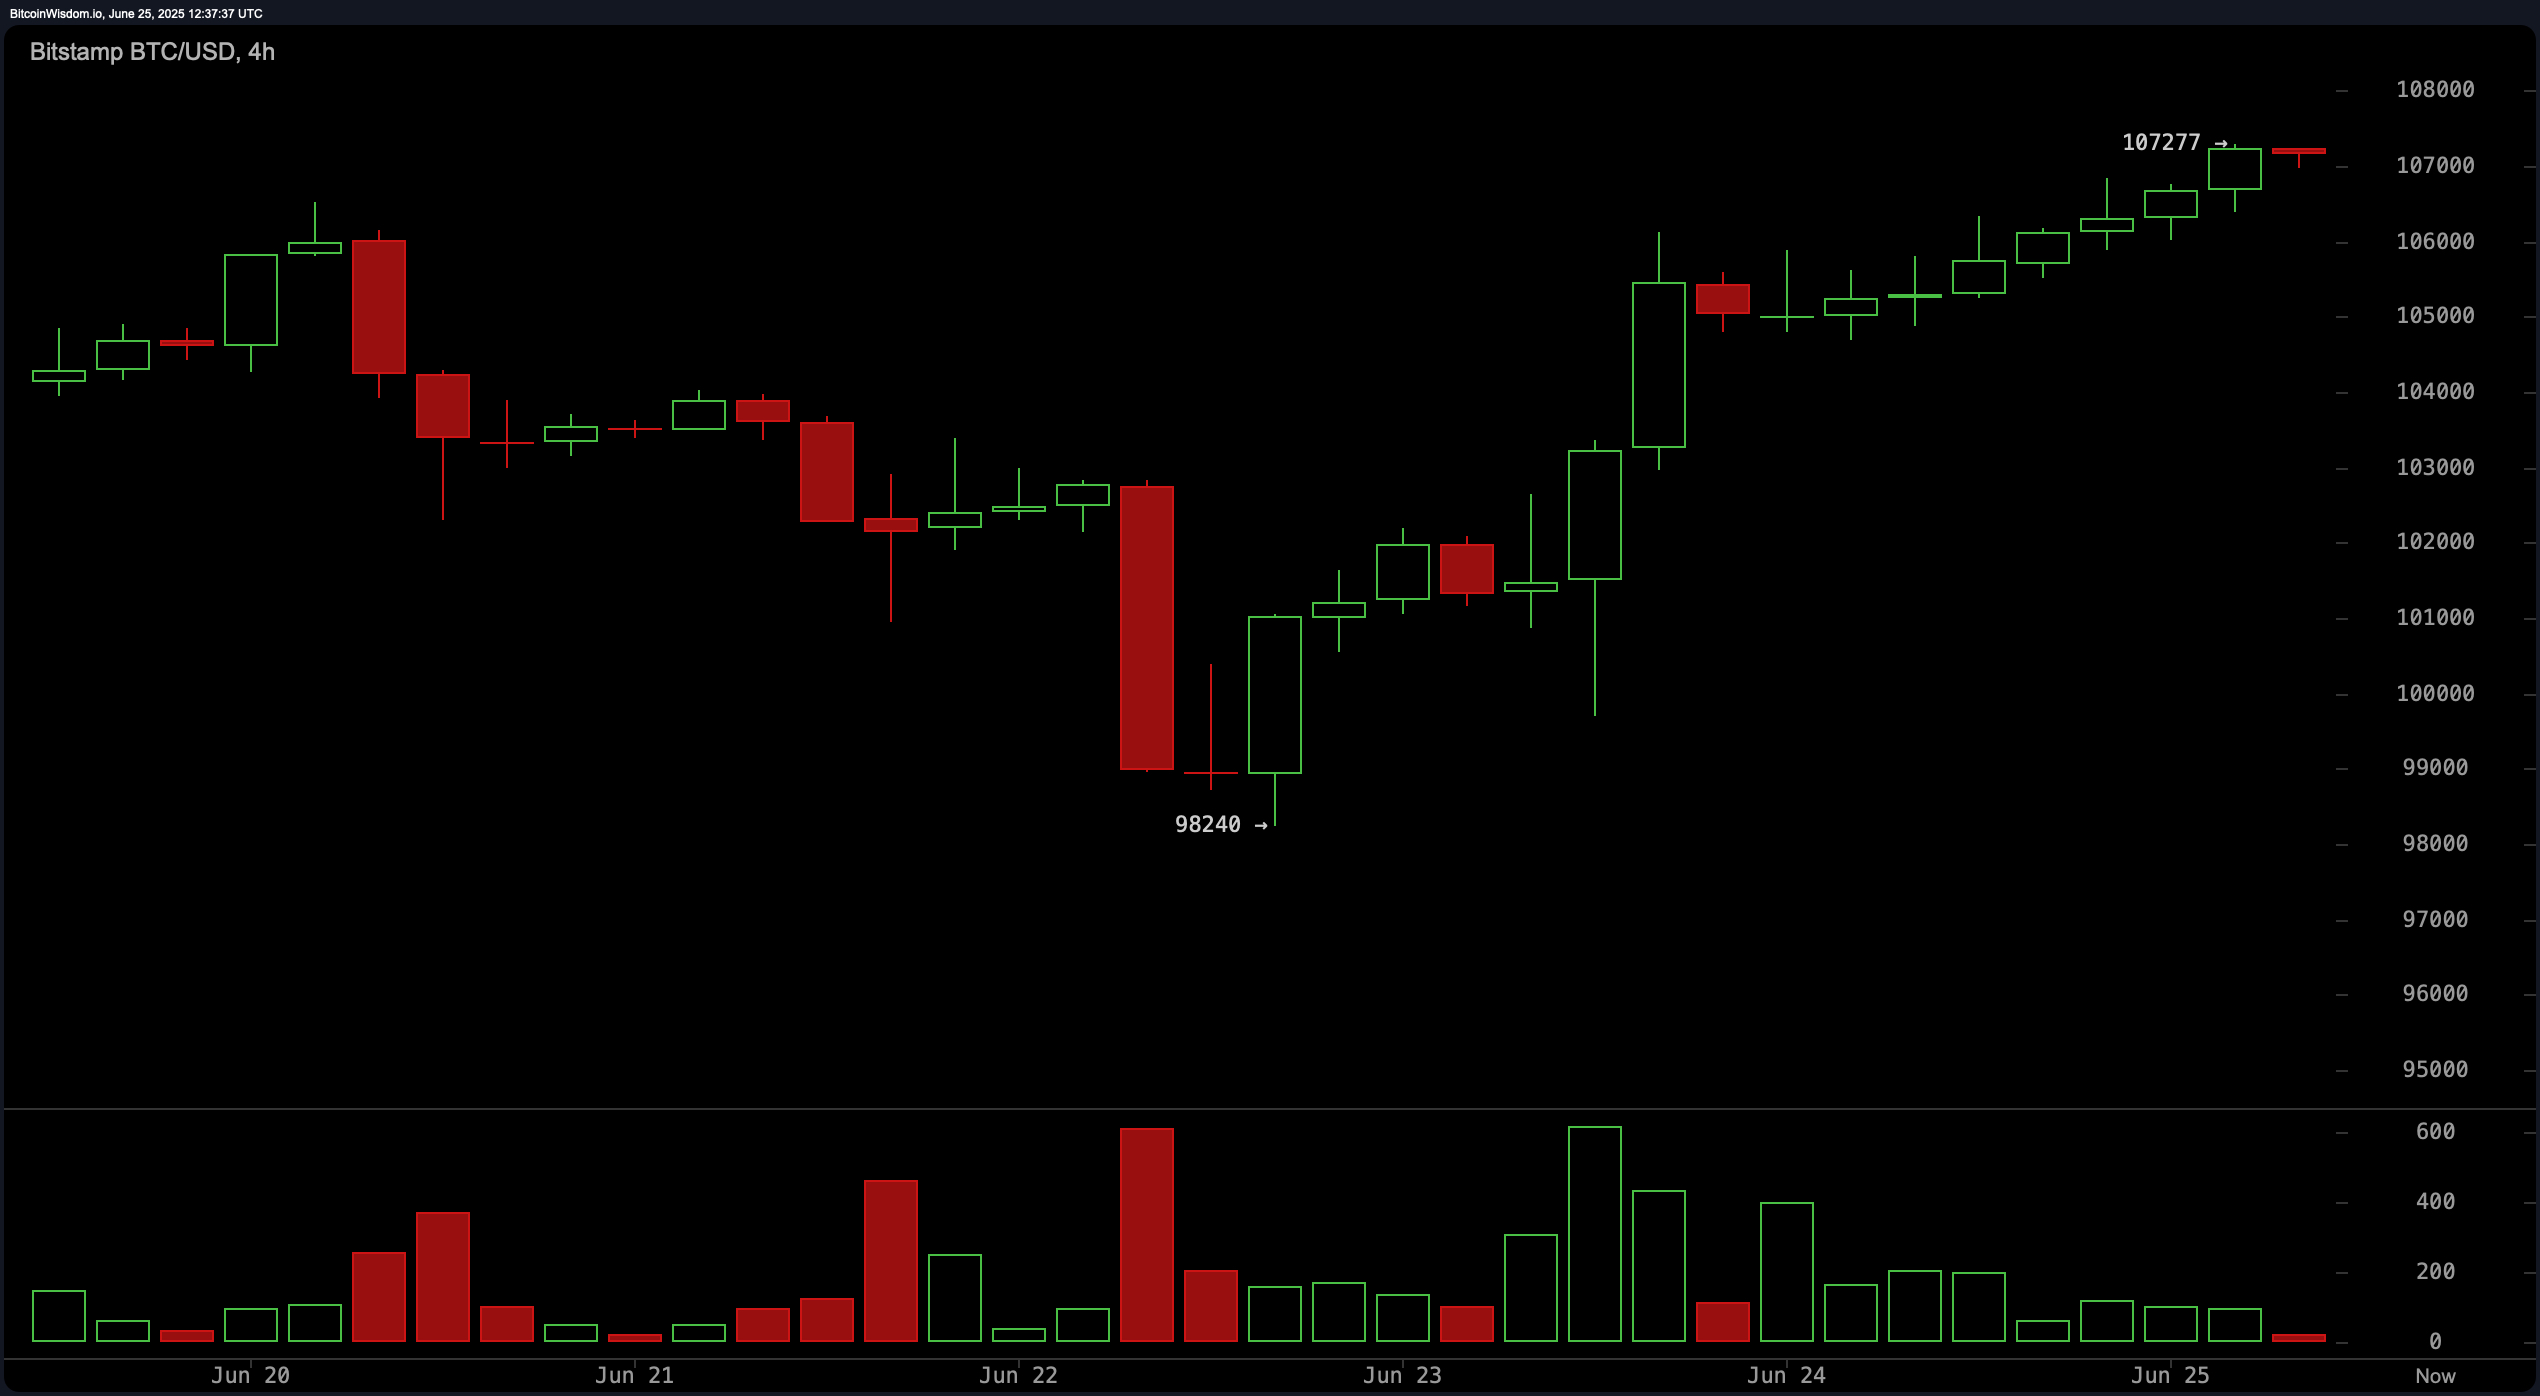
On the 4-hour chart, bitcoin is forming a classic V-shaped recovery, rallying from $98,240 to $107,277. The trend exhibits a healthy bullish structure, defined by higher highs and higher lows, supported by increased buying volume and waning selling pressure. The recent pullback levels near $104,500–$105,000 may serve as optimal entry zones, which were prior resistance levels turned into support. Continuation toward $108,000 appears likely if this structure holds, with risk mitigation placed below $103,000 in case of trend invalidation.
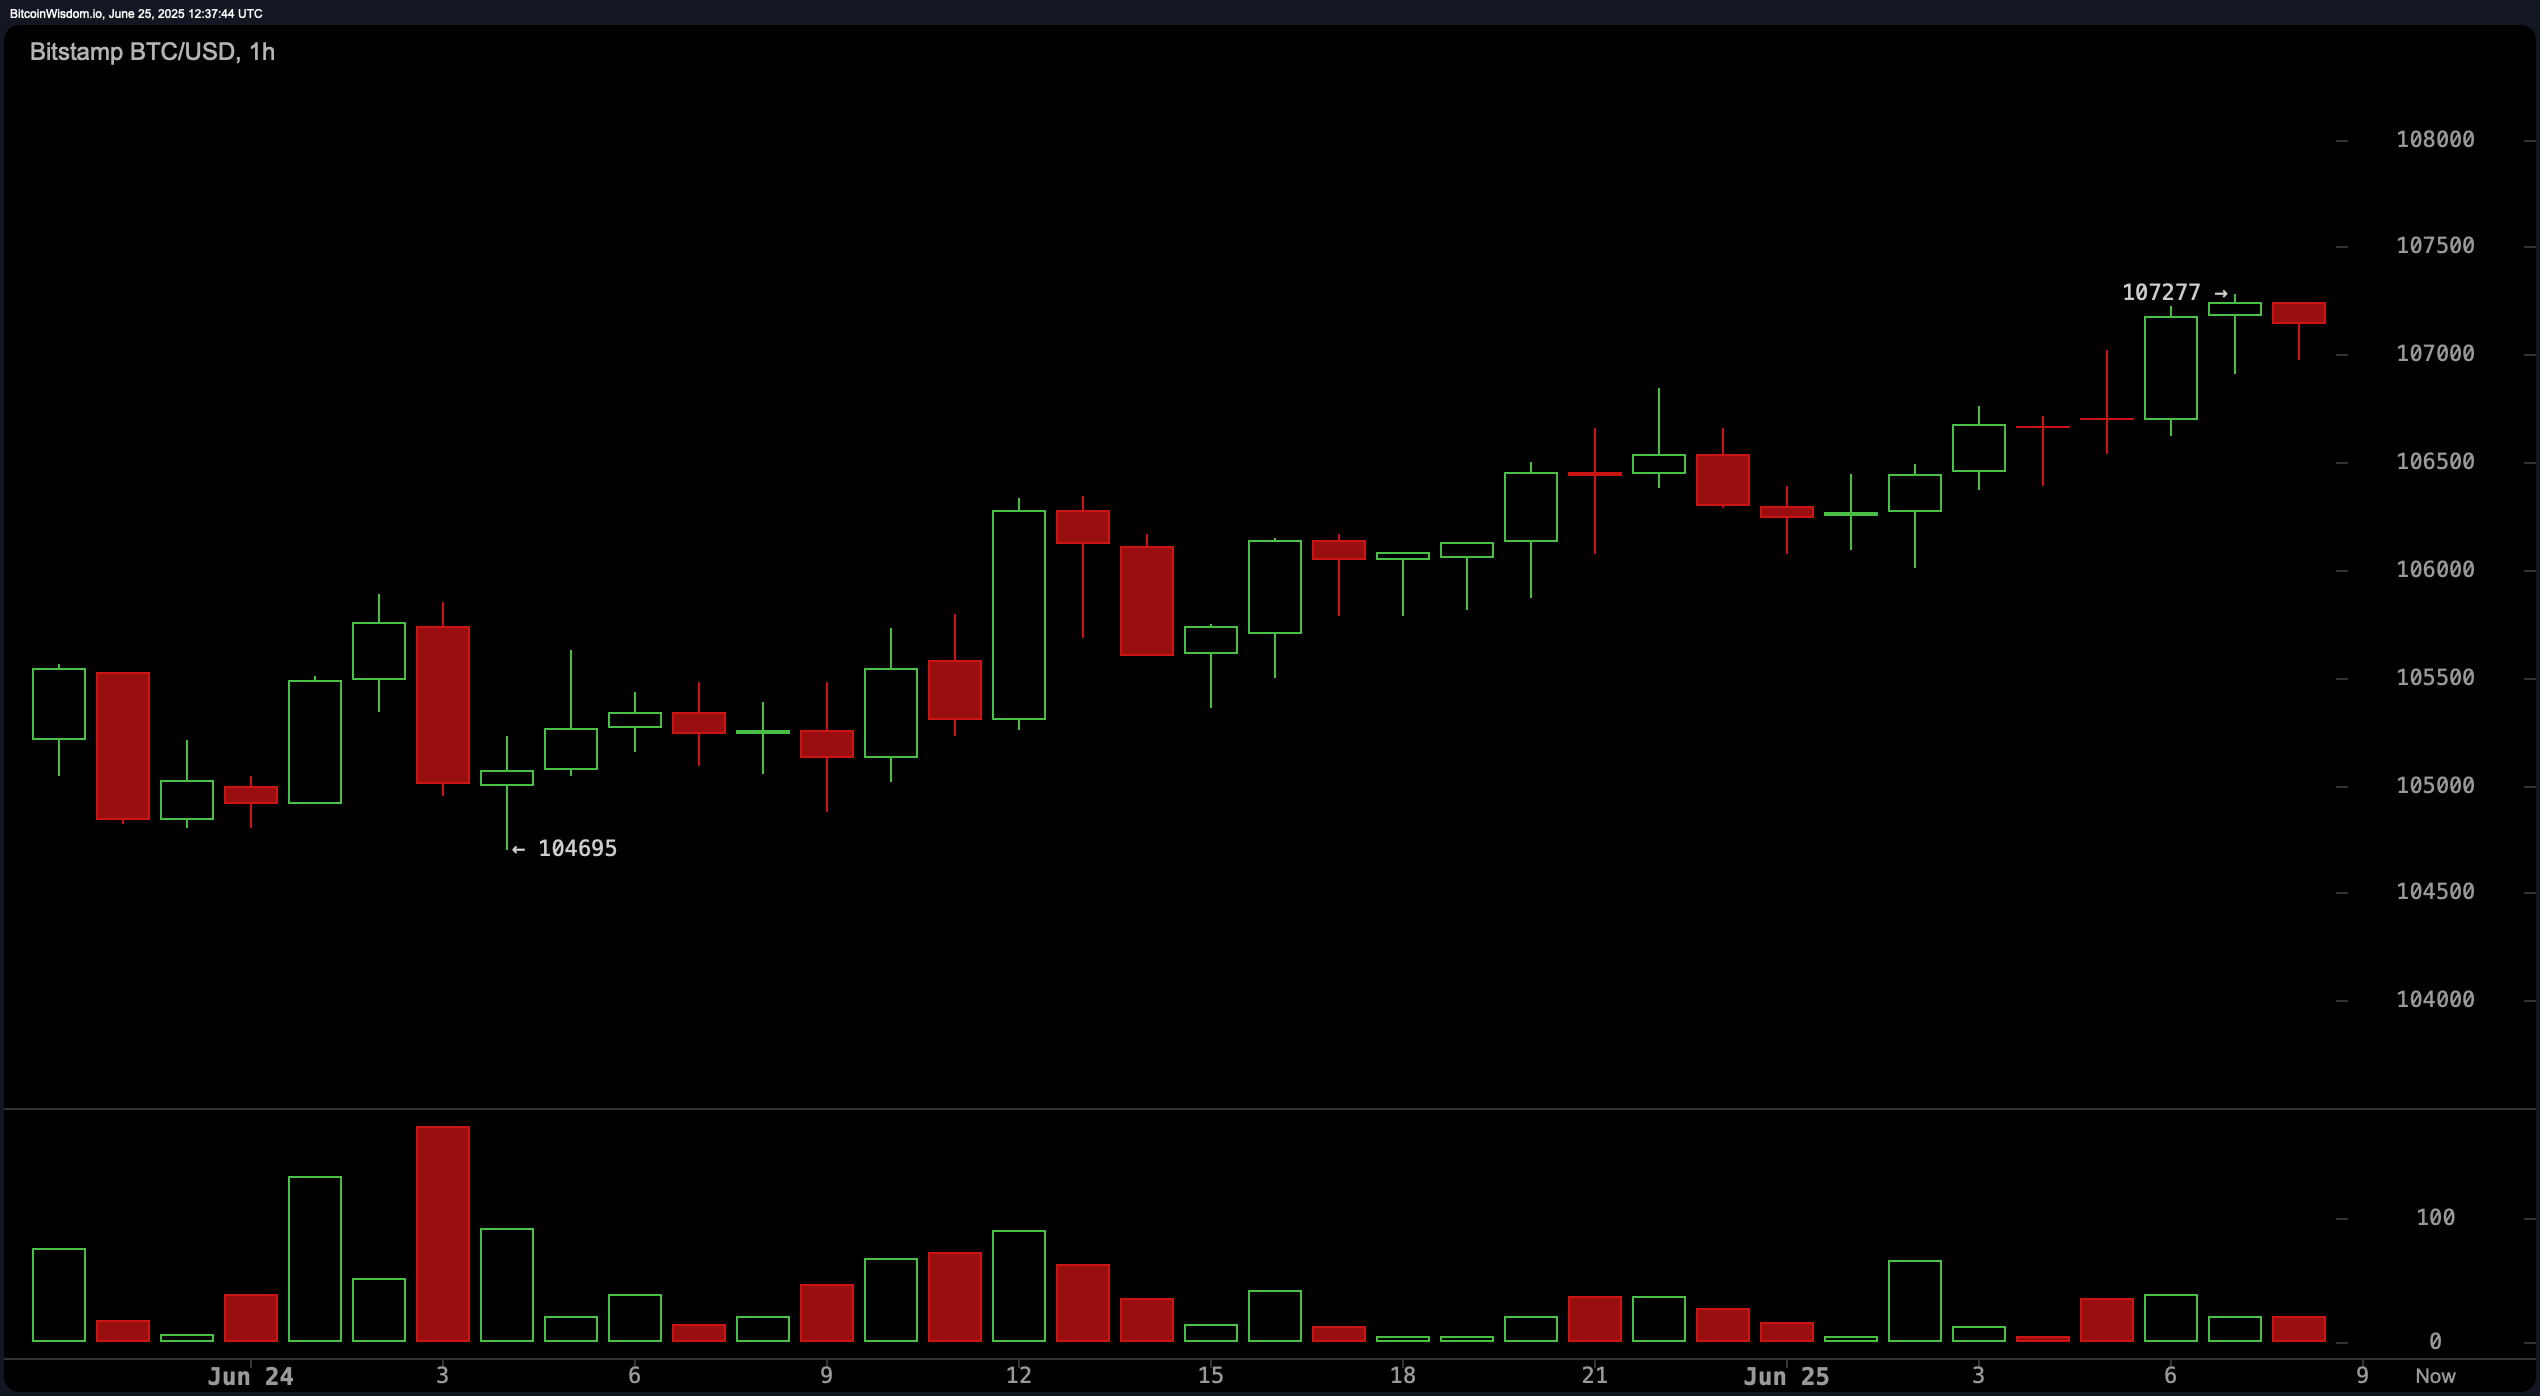
The 1-hour BTC/USD chart reveals a short-term bullish flag forming within a gradual uptrend. Although volume has tapered off slightly, the consolidation above $106,000 hints at a potential breakout. If the price breaches the $107,300 level with volume confirmation, scalpers might target moves toward $108,000–$108,500. Caution is warranted below $106,200, where an intraday bullish structure would likely be compromised.
Oscillators remain mostly neutral across all readings, with the relative strength index (RSI) at 56, Stochastic at 69, and commodity channel index (CCI) at 54. The average directional index (ADX) stands at 17, suggesting a weak trend. While momentum supports a buy signal at 1,447, the moving average convergence divergence (MACD) level shows a bearish -19, aligning with some short-term hesitation. These readings reflect a mixed sentiment that may tilt bullish with a confirmed breakout.
Moving averages (MAs) paint a broadly bullish picture. All major averages — including the exponential moving averages (EMA) and simple moving averages (SMA) across 10, 20, 30, 50, 100, and 200 periods — currently issue bullish signals. The 10-period EMA at $105,051 and 10-period SMA at $104,607 affirm short-term momentum, while the 200-period EMA and SMA at $93,942 and $96,056, respectively, highlight longer-term strength. This convergence across multiple timeframes strengthens the bullish outlook for bitcoin, though close attention should be paid to volume and price confirmation around key resistance levels.
Bull Verdict:
The alignment of all key moving averages with bullish signals across short- and long-term timeframes, coupled with a successful rebound and formation of higher lows, suggests bitcoin is positioned for a continuation toward $112,000. If volume supports a breakout above $107,300, momentum may accelerate, validating the broader uptrend and reinforcing a bullish stance.
Bear Verdict:
Despite the recovery, neutral oscillator readings and a bearish moving average convergence divergence (MACD) hint at potential exhaustion in the current rally. If bitcoin fails to break above $107,300 and slips below the $106,000 support, it risks retesting lower levels, with downside pressure potentially dragging it back toward the $102,000–$101,500 range.