Bitcoin's latest bounce might not be as encouraging as it looks. The price has just passed $106,000, but behind the scenes, one of the market's most watched volatility indicators — the Bollinger Bands — is showing a picture that is more about being careful than celebrating.
On the daily chart, the Bitcoin price is trading right near the midline of the bands — that is the 20-day moving average — but what stands out is not where the price is. It is what the bands themselves are doing: narrowing.
This squeeze between the upper and lower bands is often a sign that a bigger move is on the way. But when it happens at a local top, as we are seeing now, it often flips bullish optimism into a trap.
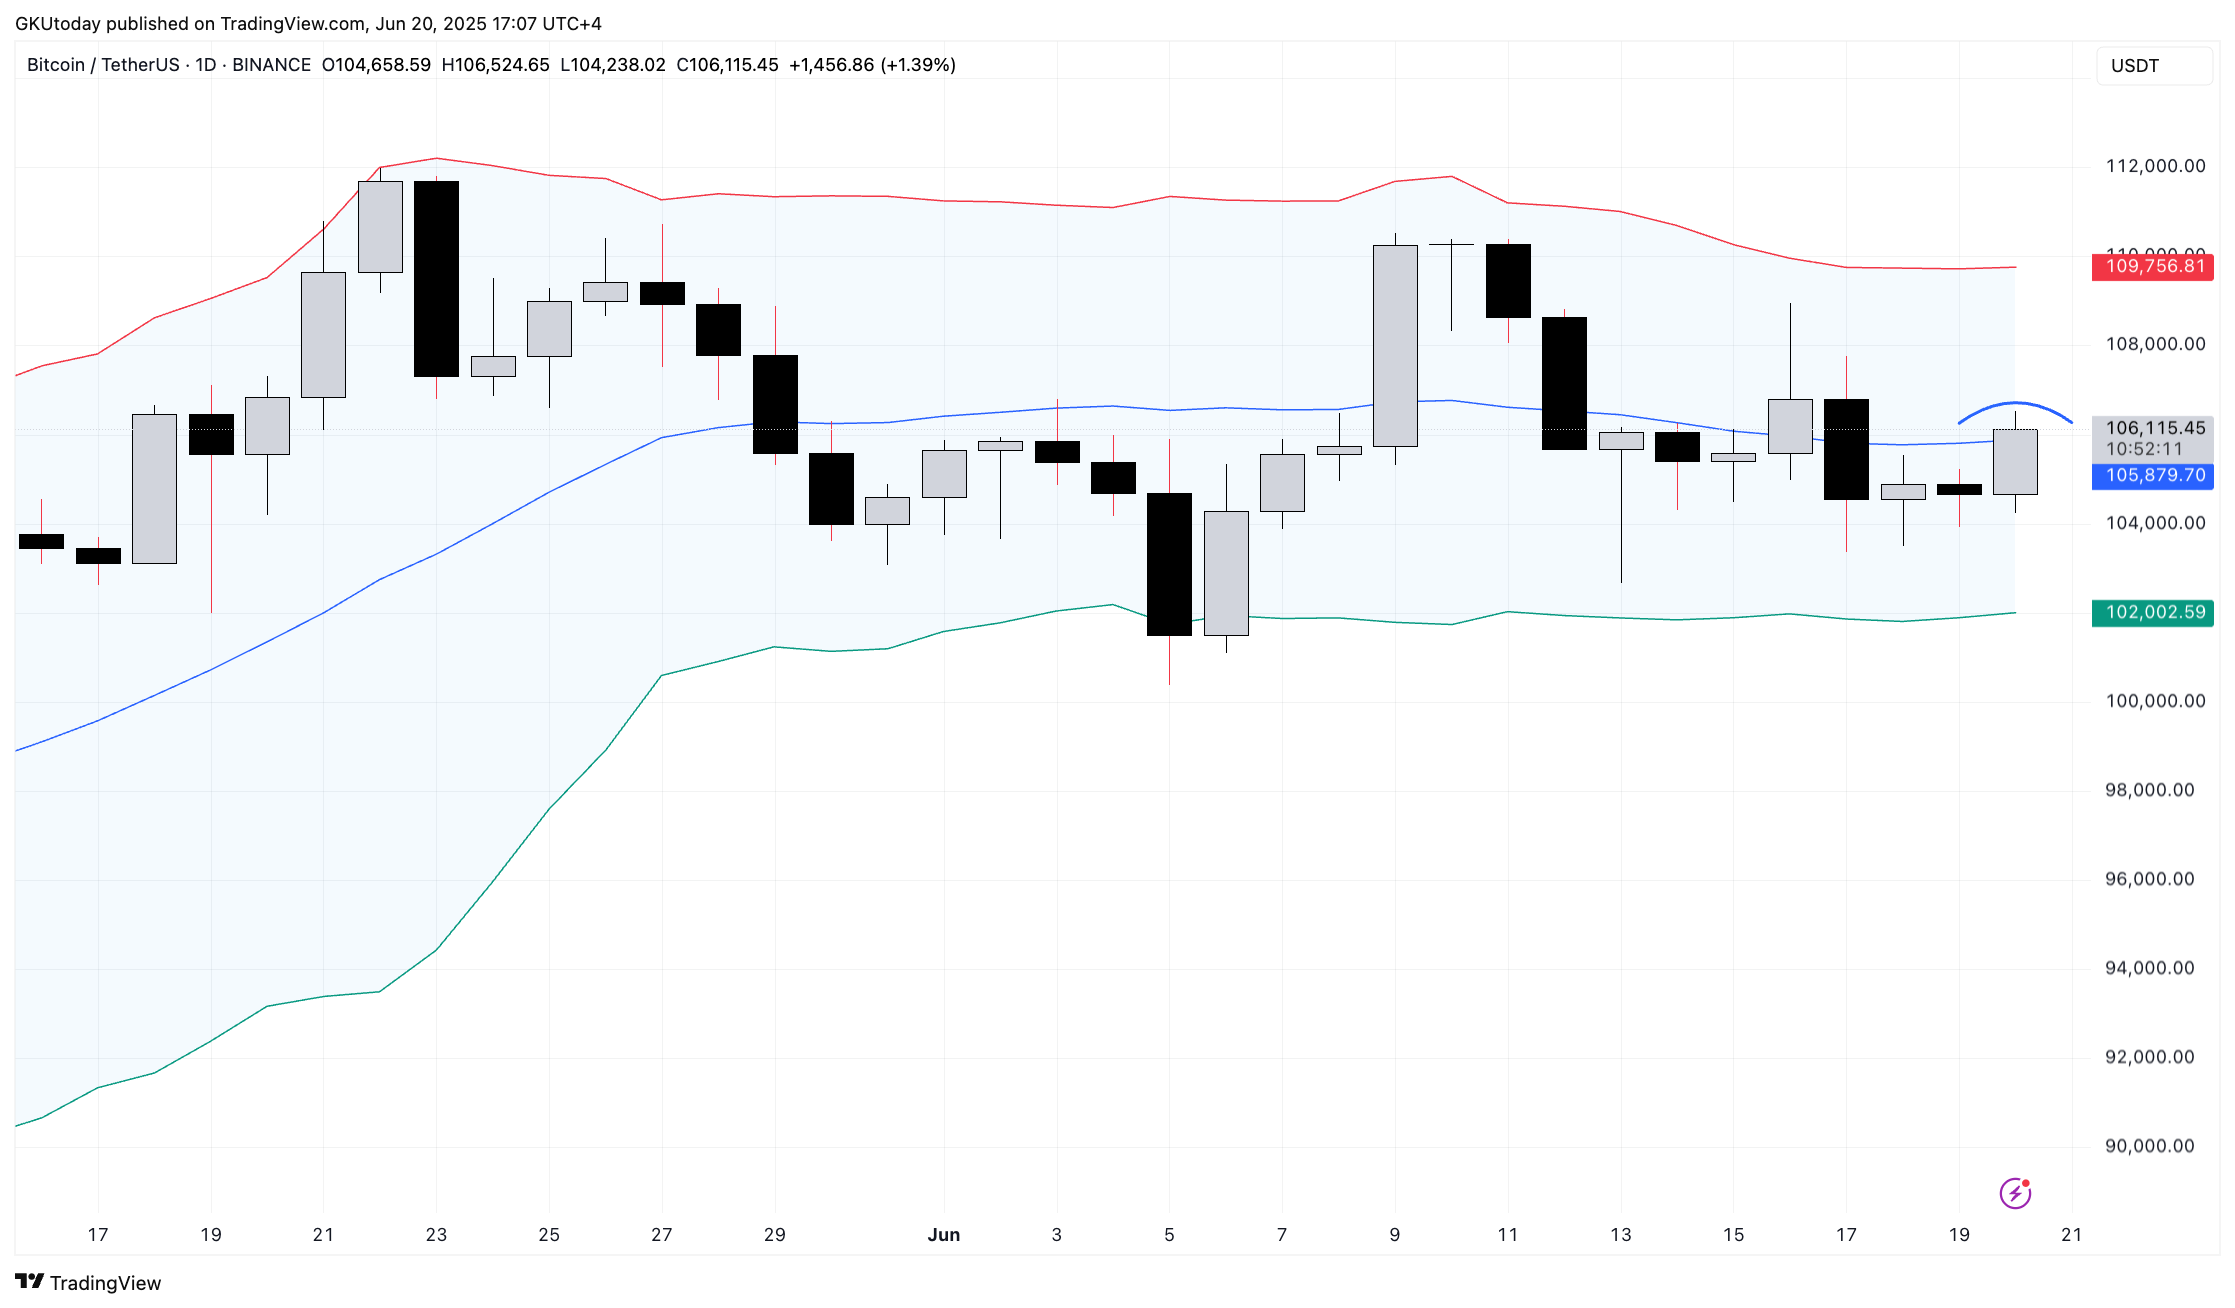
Recent candles suggest some uncertainty. There have been a few sessions testing the area just above the mid-band and so far, it has not held. The highs are getting clipped lower, and price is fading after each intraday push.
The bands are currently stuck near $109,746, but the lower edge has risen to $101,995, and it is the lower level that is looking more vulnerable.
Then there is the move's character
The rebound that brought Bitcoin back into this range did not have the kind of volume and conviction seen in past trend reversals. That is not really how recoveries work. It is actually more like how bull traps work: a convincing but short-lived push that attracts buyers but then unwinds just as fast.
If the lower band gives out and Bitcoin breaks beneath $102,000, that would be a technical breakdown right inside a volatility pinch — exactly the kind of move that punishes late longs and rewards patient shorts.
Basically, the bands are not showing any real strength. They are flashing a setup that has caught traders off guard before. If history is anything to go by, Bitcoin might not be going up — it might just be getting ready to go down.