Bitcoin Price USD Testing Crucial Zone
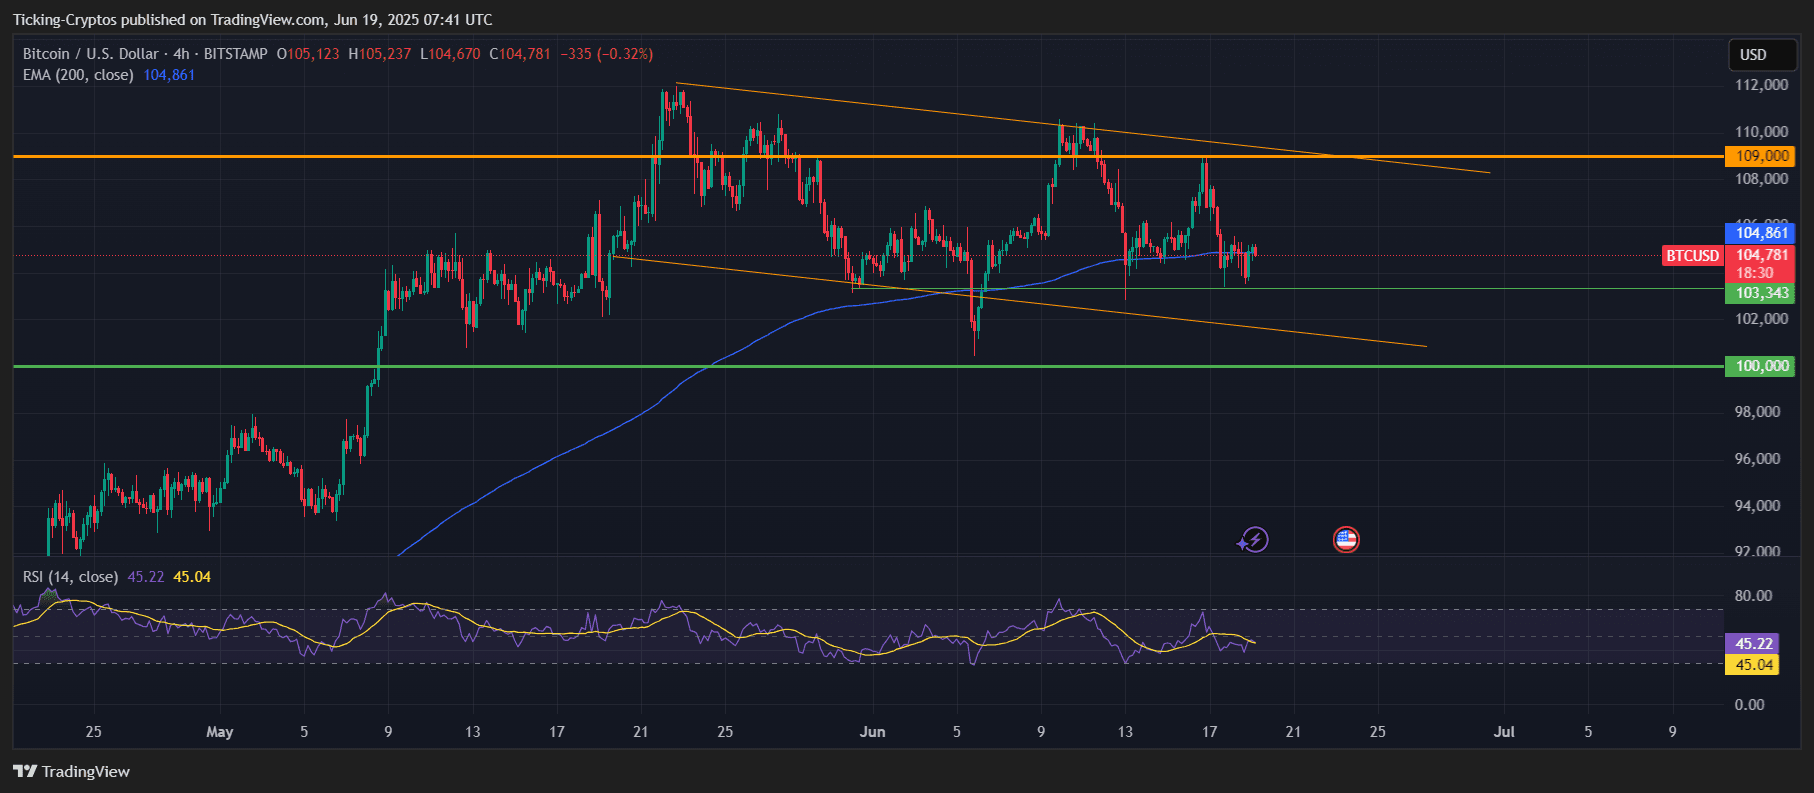
Bitcoin is currently trading at $104,781, hovering just above its 200 EMA on the 4-hour chart at $104,861. The chart shows BTC consolidating inside a clear descending triangle pattern, with lower highs forming resistance and a flat support zone around $103,343. This setup typically signals a bearish continuation unless a breakout occurs.

BTC/USD 4-hours chart - TradingView
Adding to the caution, the Relative Strength Index (RSI) sits around 45, suggesting neutral momentum with no clear bullish divergence. The momentum has faded over the past two weeks, and price action remains weak near the triangle’s lower edge.
Bitcoin Price Prediction: Bearish Breakdown or Surprise Reversal?
If the Bitcoin price (USD) fails to hold above $103,343, we could see a quick drop toward the psychological support at $100,000, marked by a clean green line on the chart. This level also aligns with the lower bound of the descending triangle and may serve as the final defense before a larger correction.
Should $100K fail, the next potential support zone is around $97,000–$95,000, opening the door to a possible retest of April breakout levels.
On the flip side, a strong bounce from the 200 EMA or a breakout above the upper triangle trendline (~$107,000–$109,000) could invalidate the bearish setup. In that case, BTC may push to retest $110K and aim for new highs above $112K.
Entry and Exit Setups for Traders
Short Setup (Bearish Bias):
- Entry: On breakdown below $103,300
- Target 1: $100,000
- Target 2: $97,000
- Stop-Loss: $105,800
Long Setup (Bullish Scenario):
- Entry: On confirmed breakout above $107,000 with strong volume
- Target 1: $109,000
- Target 2: $112,000
- Stop-Loss: $104,000
 cryptoticker.io