The Bitcoin price today is trading around $106,950 after facing rejection from the $108,000 resistance zone earlier in the session. Over the past 48 hours, Bitcoin price action has remained choppy as the asset navigates between a key supply zone and a short-term order block.
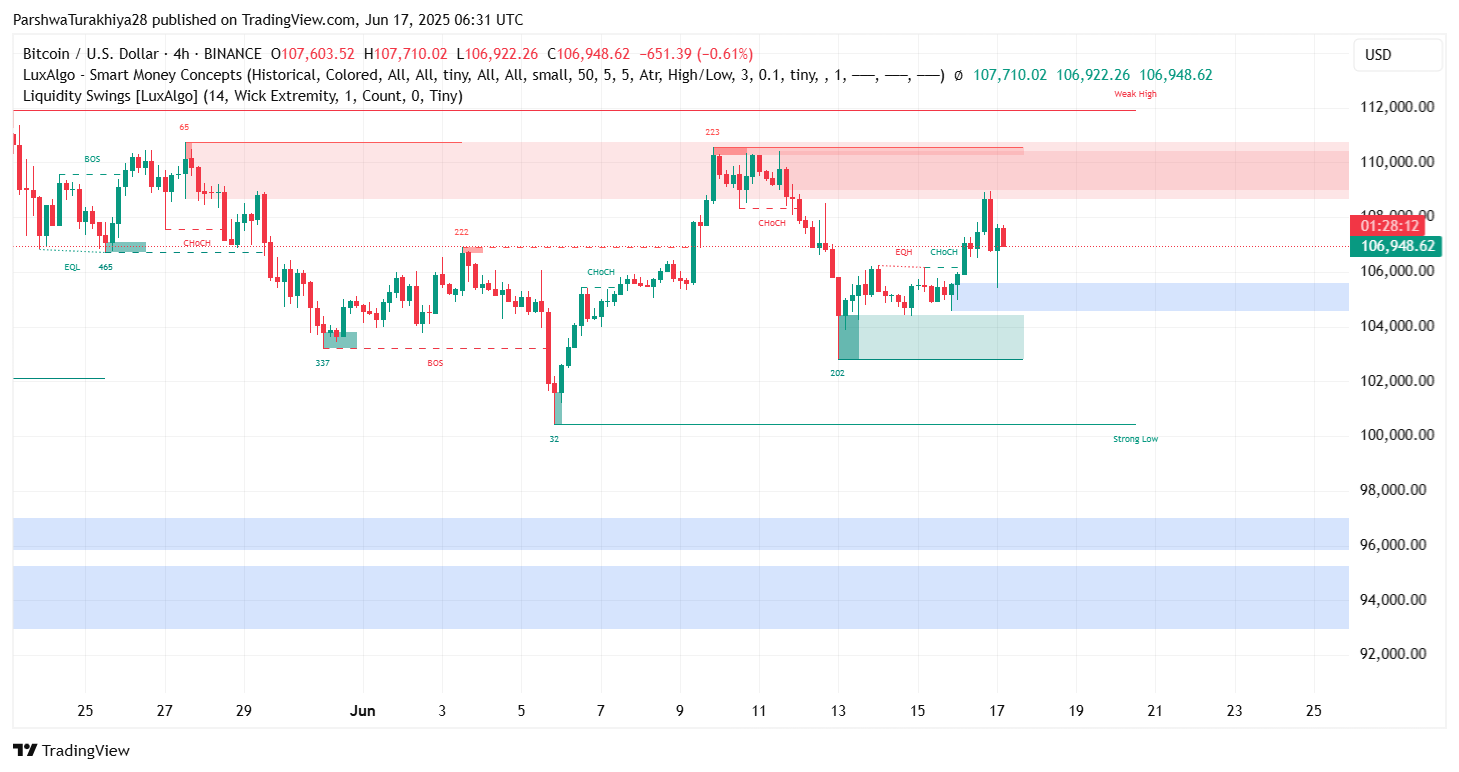
The rejection near the red liquidity area marked by a Change of Character (ChoCH) confirms sellers defending the $108,800–$110,000 range. However, bulls are holding onto structure, with price still above the $106,000 demand zone.
What’s Happening With Bitcoin’s Price?
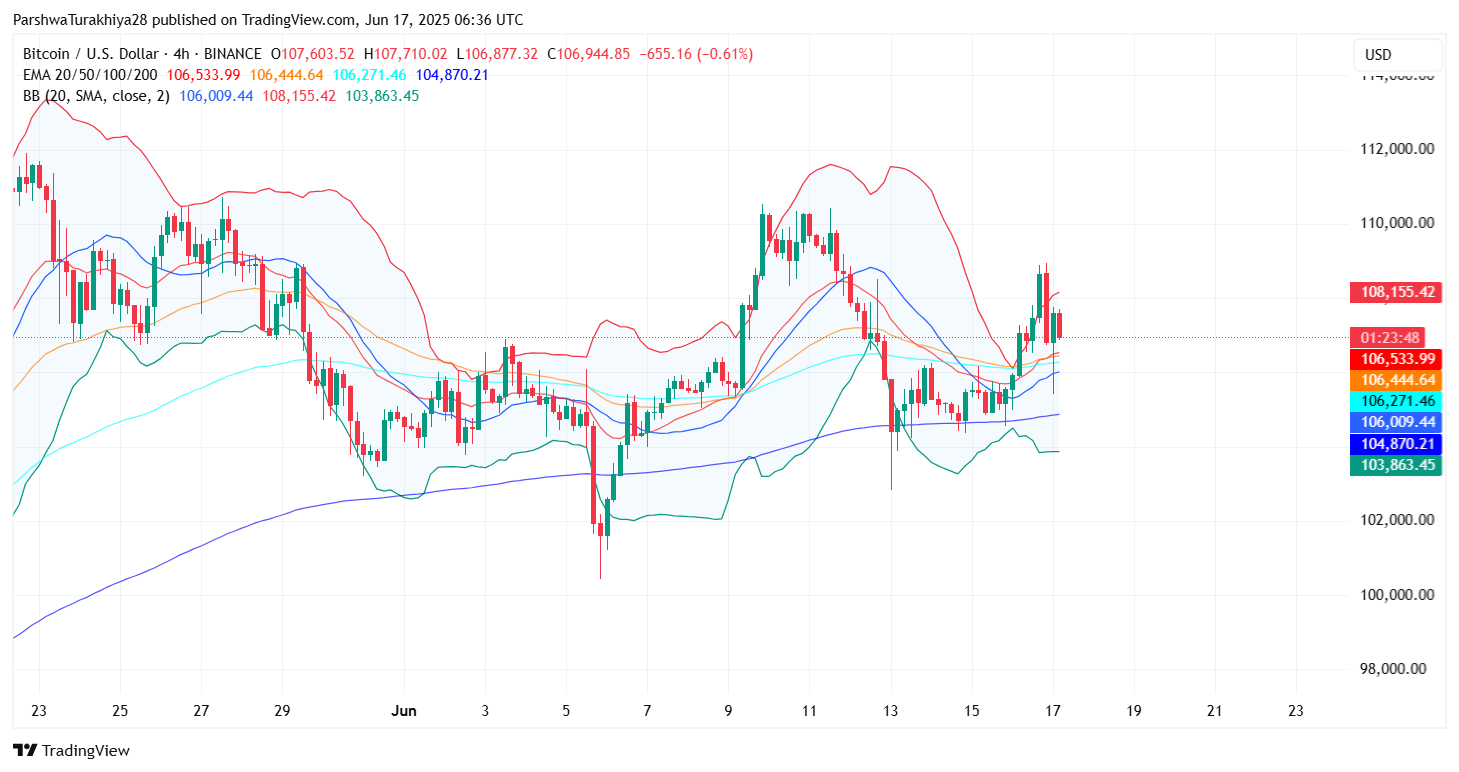
A closer look at the 4-hour chart shows that Bitcoin price retraced after testing the overhead imbalance zone. Despite the bearish reaction, price has not violated the recent bullish ChoCH support formed near $105,900. The Bollinger Bands show expanding volatility, but the upper band rejection aligns with the local top. Meanwhile, price is hovering near the 20/50/100 EMA cluster between $106,270 and $106,530, keeping the trend neutral in the short term.
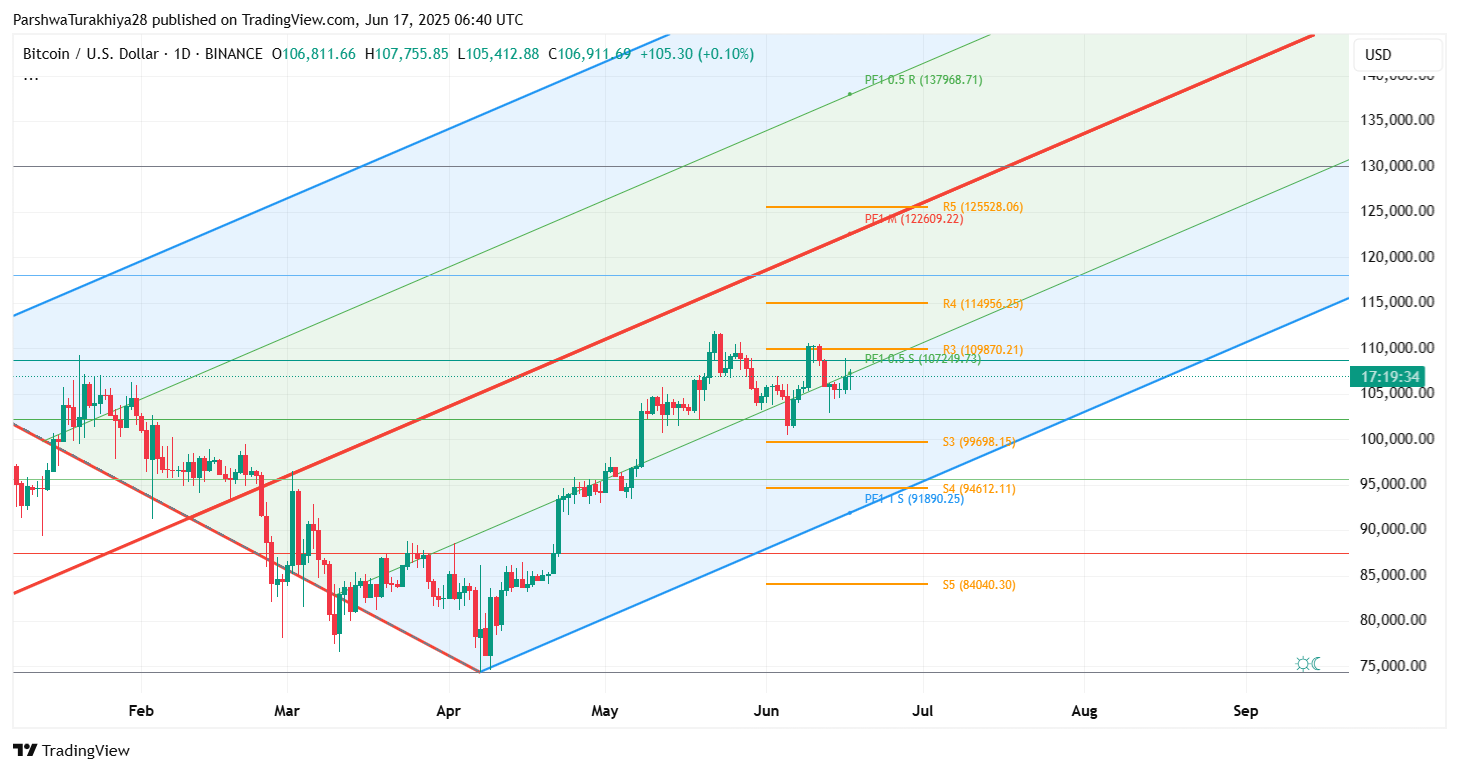
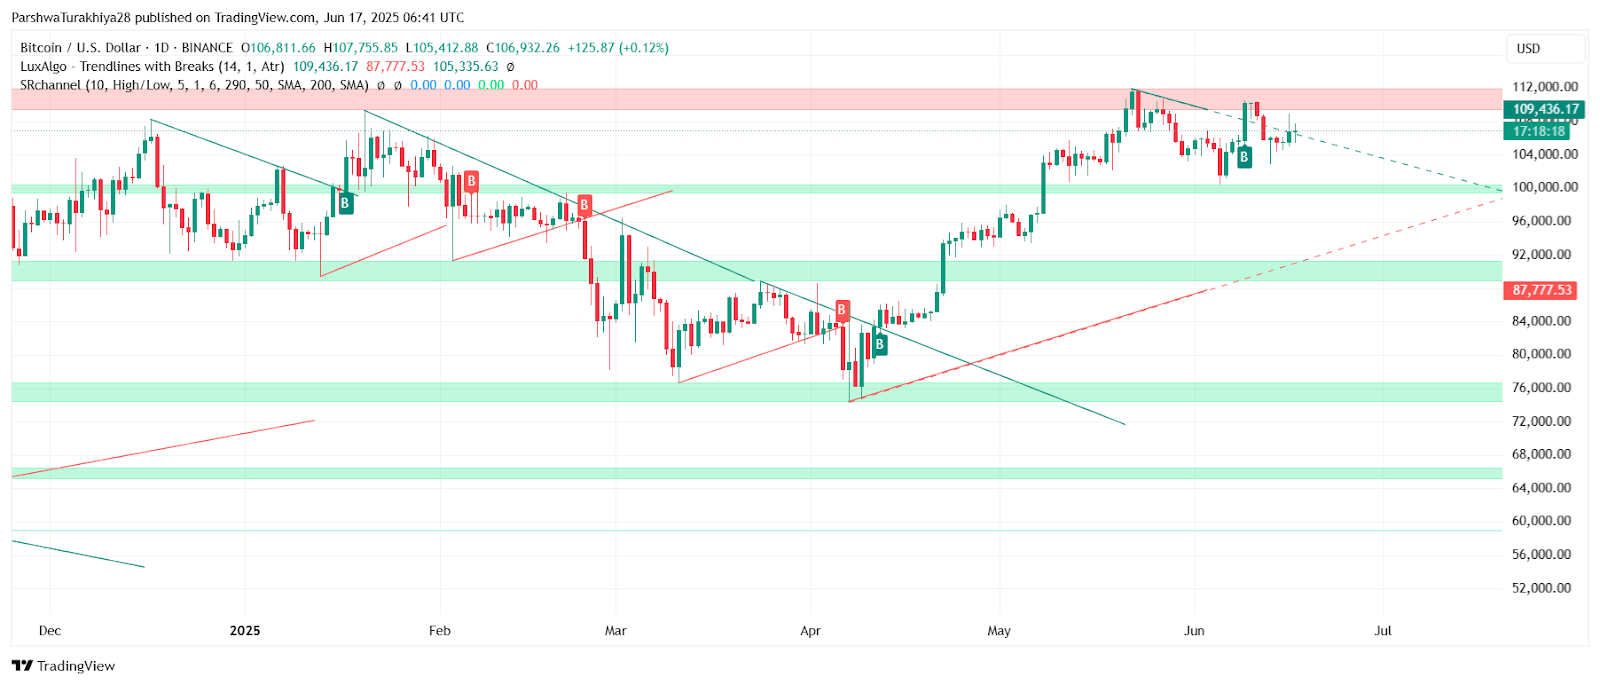
On the daily chart, Bitcoin price today remains confined below the pivotal resistance at $109,870. That level, aligning with a Fib confluence and historical rejection zone, remains the upside target for bulls if structure holds. On the downside, the $104,800–$105,300 green zone remains the key support cluster to prevent deeper pullbacks.
Bitcoin (BTC) Price: Momentum Weakens After Rally
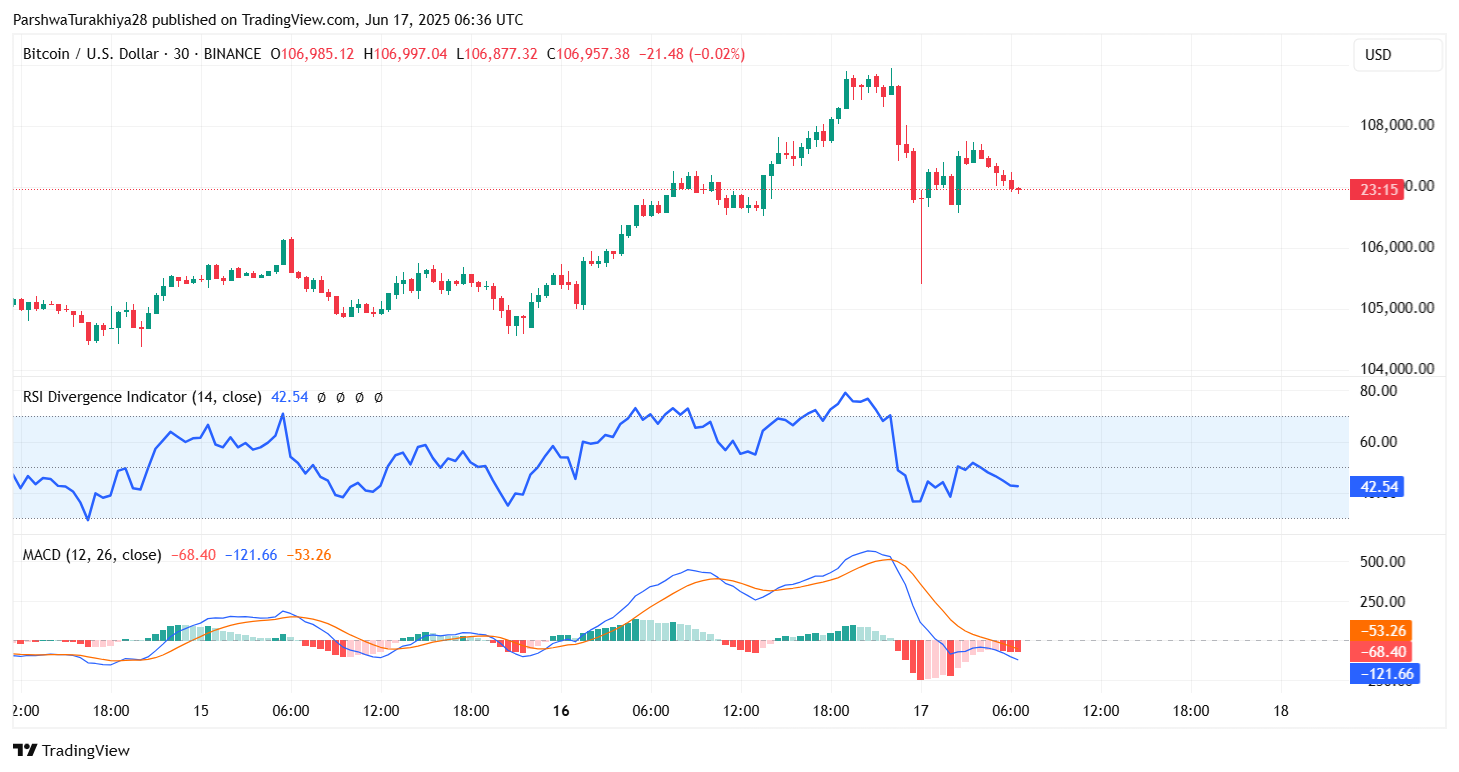
Short-term momentum indicators suggest fading strength. The 30-minute RSI has dropped to 42.5 after hovering near overbought territory on June 16, indicating exhaustion. MACD shows a bearish crossover with declining histogram momentum, supporting the idea of a temporary pullback.
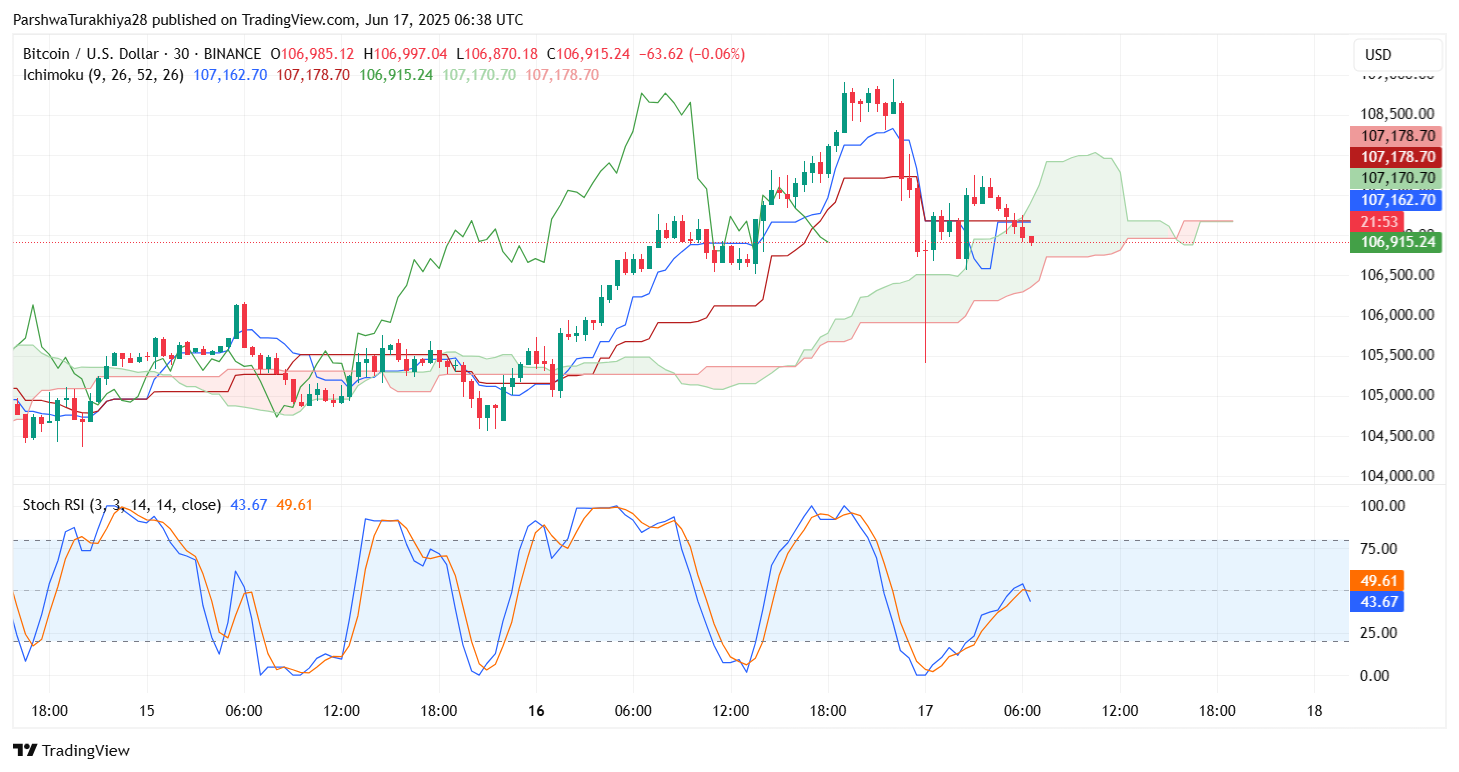
Ichimoku Cloud on lower timeframes shows price hovering near the Kijun line with a flat cloud ahead, suggesting short-term consolidation before the next impulse move.The Stochastic RSI is also turning lower, showing early signs of momentum slowdown. However, it has not fully exited bullish territory, indicating that sellers lack full control for now.
Bitcoin Price Prediction: VWAP and OBV Support Caution
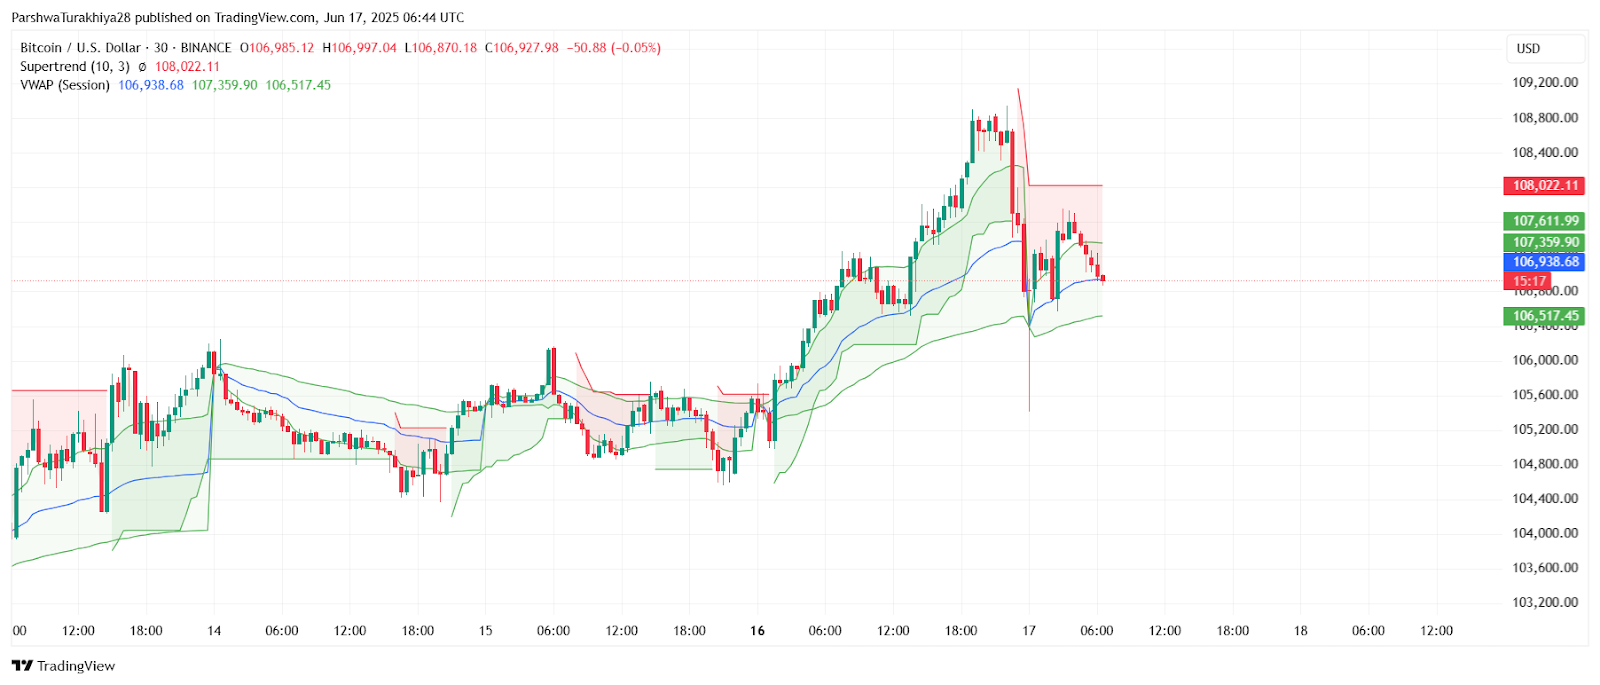
The Volume Weighted Average Price (VWAP) lines on the 30-minute chart show price returning toward mean reversion at $106,500, a level that also intersects with the Supertrend flip zone. Price remains above session VWAP, but the narrowing bands suggest compression.
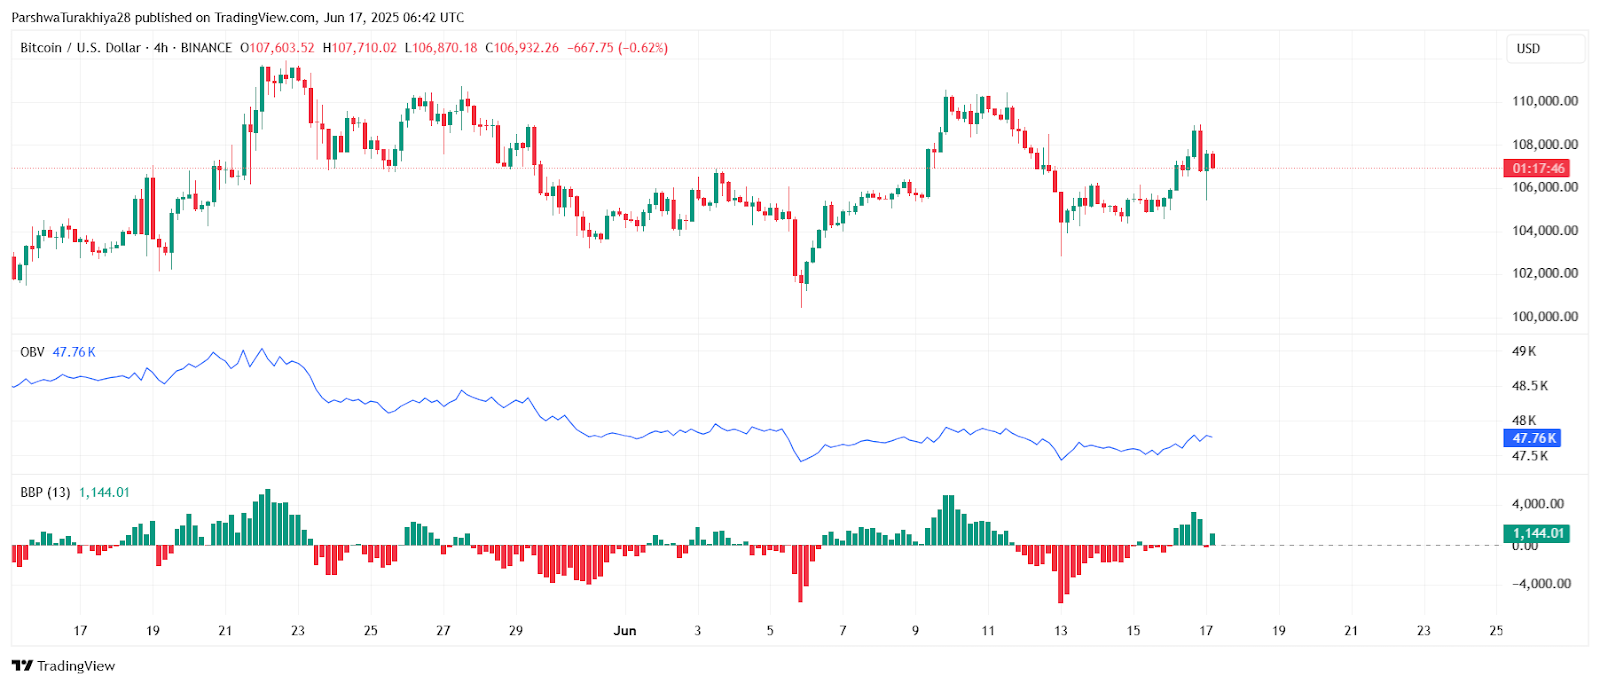
The On-Balance Volume (OBV) has flattened, confirming that volume participation has stalled during the recent move down. The BBP indicator, however, remains positive, suggesting a potential rebound if buyers step back in at lower levels. But confirmation is still pending from fresh volume influx.
Why Bitcoin Price Going Down Today
Why Bitcoin price going down today ties back to the rejection from the red Smart Money Concept supply zone around $108,800. This area has historically triggered sell-offs, and Friday’s failure to break through that ceiling triggered short-term profit-taking. Coupled with declining momentum and reduced buying volume, a corrective move below $107,000 was triggered heading into the Monday session.
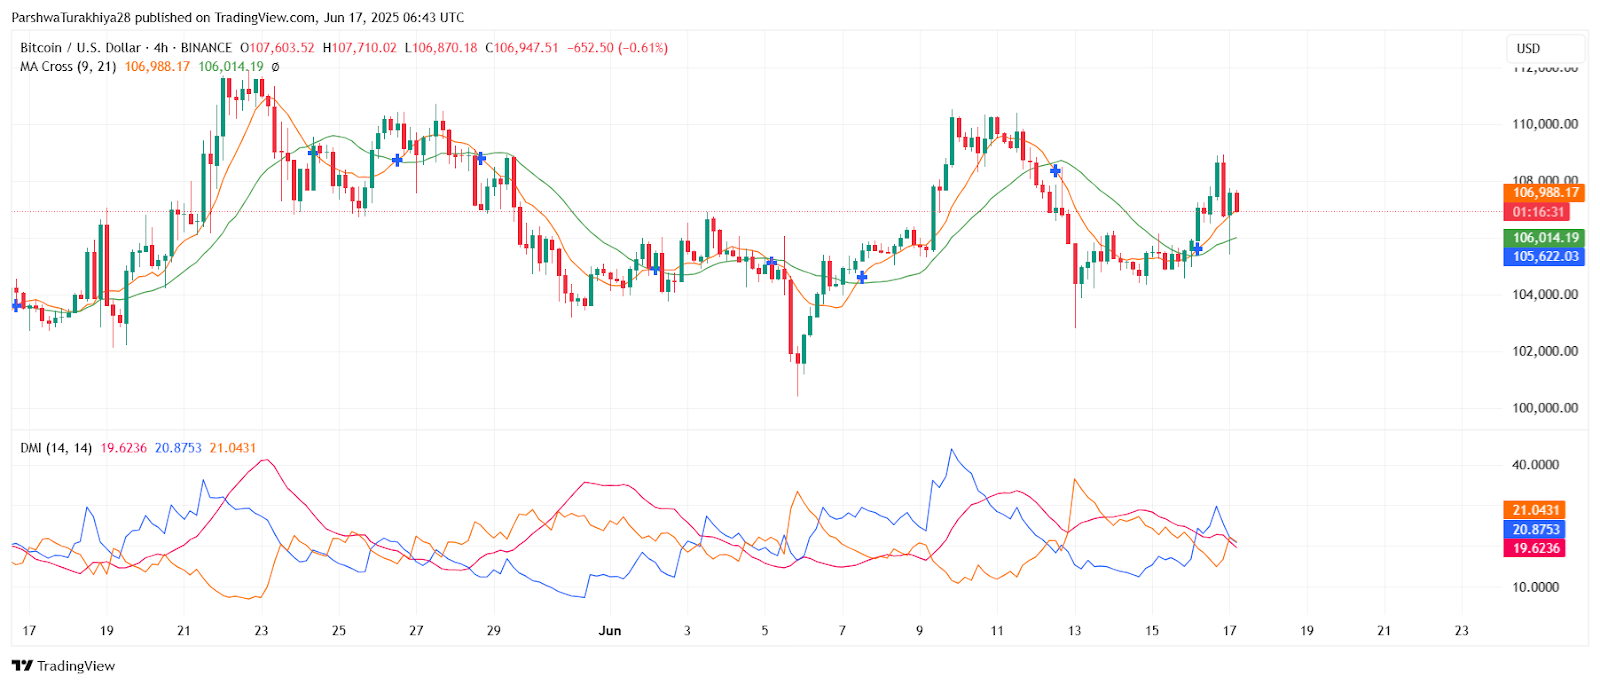
The directional movement index (DMI) also shows ADX flattening while DI+ and DI– remain entangled, signaling indecision rather than trend strength. This environment supports a sideways to mildly bearish view in the short term unless bulls reclaim $108,200.
Short-Term Bitcoin (BTC) Price Forecast
Over the next 24 hours, Bitcoin price is expected to range between $106,200 and $108,000. The trend remains mildly bullish as long as $105,800 support holds. A clear break and close above $108,200 would open the path toward $109,870. On the other hand, a loss of $105,300 could attract sellers targeting $103,600 and possibly $100,000 in case of volume expansion.
| Indicator | Value/Signal |
| Current BTC Price | $106,950 |
| Immediate Resistance | $108,200 and $109,870 |
| Immediate Support | $106,270 and $105,300 |
| RSI (30-min) | 42.5 (neutral-bearish) |
| MACD | Bearish crossover |
| VWAP | Converging at $106,500 |
| DMI | No strong trend |
| Bias | Short-term consolidation with downside risk |
Disclaimer: The information presented in this article is for informational and educational purposes only. The article does not constitute financial advice or advice of any kind. Coin Edition is not responsible for any losses incurred as a result of the utilization of content, products, or services mentioned. Readers are advised to exercise caution before taking any action related to the company.